Conversion rate optimization (CRO) is incomplete without the right tools. To aid you in your optimization journey, this blog provides a curated list of the best conversion rate optimization tools. But before delving into the list, let’s first explore what CRO tools are and when you need them.
What are conversion rate optimization tools?
Conversion rate optimization tools are software platforms that marketers, developers, and UI/UX designers use to dig into user behavior, identify roadblocks, and run experiments to improve the user experience and boost conversion rates.
CRO tools can be standalone solutions or bundled platforms. Common features include:
These tools are essential for overcoming the leaky bucket syndrome and maximizing the returns on business efforts.
This guide covers 23 tools across six stages of the CRO process, from research and hypothesis building through to testing, personalization, and learning.
Our evaluation methodology is based entirely on secondary research. Each tool in this guide was assessed using official product documentation, publicly available feature information, and third-party user reviews from sources like G2 and TrustRadius. No tool was independently tested or trialed firsthand.
The order in which tools appear and the way they are described reflects only what each tool actually offers based on these sources, with no bias toward any particular platform. We recommend taking advantage of free trials wherever available before making any commitment.
Quick picks: Best CRO tools by use case
Here is a snapshot of the top tools across the most common use cases, based on the tools covered in this guide:
Category
Tool
Description
Best overall
VWO
All-in-one CRO platform for businesses of all sizes, ranging from small businesses to enterprises
Best for enterprise experience analytics
Contentsquare
360-degree experience intelligence platform trusted by enterprises
Best for AI-powered insights
Fullstory
AI-powered behavioral analytics that turns real user data into actionable insights
Best for product analytics
Mixpanel
Event-based product analytics with AI that surfaces insights
Best for design validation
Lyssna
Fast, reliable user testing for validating design decisions with real users
For a detailed breakdown of each tool across every stage of the CRO journey, keep reading.
Analyze your eCommerce website for FREE
Why analyze?
Get a free UX audit powered by VWO Copilot
Spot Gaps: Reveal hidden conversion leaks.
Data-Backed: Get a prioritized list of fixes.
Test Smarter: No more guessing what works.
Beta
Complete CRO tools comparison table
Sr. No.
Tool
Stage
Starting Price
Free Trial
Best For
1
Google Analytics
Research
Free
Free plan available
Quantitative traffic
2
VWO Insights
Research
Custom pricing
30-day free trial
All-in-one qualitative behavior research
3
Hotjar
Research
$39/month
30-day free trial
Accessible behavior analytics and feedback
4
Contentsquare
Research
$39/month
Free plan available
Enterprise experience intelligence
5
Fullstory
Research
Custom pricing
14-day free trial
AI-powered behavioral analytics
6
Mixpanel
Research
Custom pricing
Free plan available
Event-based product analytics
7
Lyssna
Research
$165/month
Free plan available
Design validation with real users
8
Craig Sullivan Framework
Hypothesis
Free
No
Structured hypothesis writing
9
Test Hypothesis Creator
Hypothesis
Free
No
Quick guided hypothesis drafting
10
VWO AI
Hypothesis
Custom pricing
30-day free trial
AI-powered hypothesis generation
11
VWO Plan
Prioritization
Free
No
Experiment scoring and pipeline management
12
TestLodge
Prioritization
$99/month
No
Test plan management across teams
13
TestRail
Prioritization
Custom pricing
No
QA and stakeholder coordination
14
A/B Test Duration Calculator
Pre-Testing
Free
No
Calculating how long to run a test
15
A/B Test Significance Calculator
Pre-Testing
Free
No
Validating statistical significance of results
16
Sample Size Calculator
Pre-Testing
Free
No
Minimum traffic planning before testing
17
Split Test Duration Calculator
Pre-Testing
Free
No
Duration planning for multi-variation tests
18
VWO Testing
Testing
Custom pricing
30-day free trial
Comprehensive A/B and multivariate testing
19
Optimizely
Testing and Personalization
Custom pricing
No
Enterprise experimentation and personalization
20
Kameleoon
Testing
Custom pricing
No
Flexible client and server-side testing
21
VWO Personalize
Personalization
Custom pricing
30-day free trial
Rule-based personalization with compliance control
22
Dynamic Yield
Personalization
Custom pricing
No
AI-driven product recommendations at scale
After evaluating the tools, let’s now look at some top conversion rate optimization tools based on different conversion rate optimization stages.
Top conversion rate optimization tools for different testing stages
The research stage
When it comes to conducting research, multiple CRO tools exist that help map both quantitative and qualitative data. Quantitative data tools, such as web analytics, offer insights into what’s happening on your site. Qualitative tools such as heatmaps, scroll maps, and surveys provide deeper context into why users behave the way they do.
More importantly, they help teams identify conversion barriers that prevent visitors from taking the desired actions.
Mentioned below are some of the best CRO research tools you can use to gather qualitative insights that explain why users behave the way they do, collect meaningful visitor data, and build data-driven hypotheses for your testing campaigns.
User research: user interviews, prototype testing, surveys, first click testing, five-second testing, preference testing, card sorting
Free plan available
$165/month
Detailed overview
Disclaimer: The pros and cons listed are based on reviews and feedback from third-party sites such as G2, TrustRadius, and other sources.
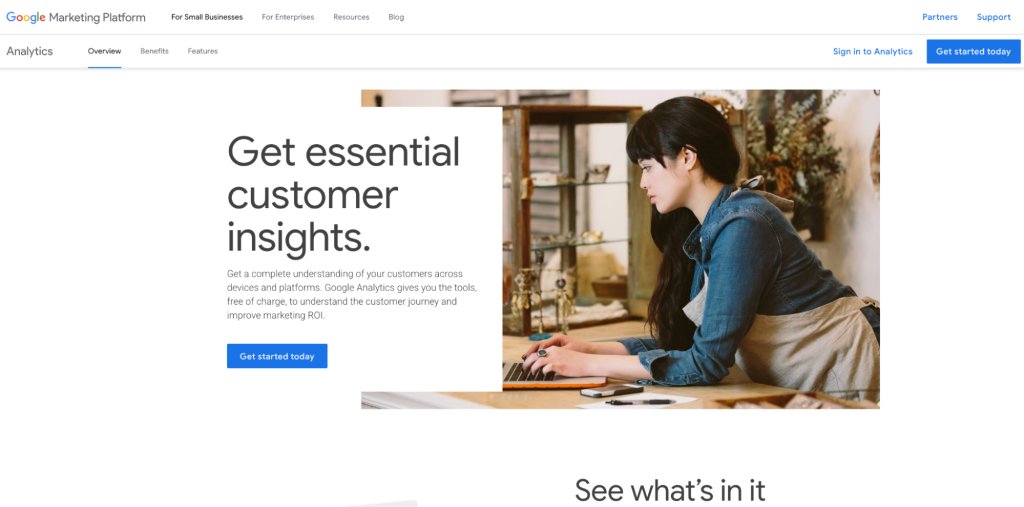
1. Google Analytics
What it does
Google Analytics is a free web analytics platform that tracks key interactions, events, traffic sources, and conversions across devices and platforms. It gives teams a broad, quantitative view of website performance, revealing traffic patterns, funnel drop-offs, page performance, and conversion bottlenecks across the entire site.
During the research stage, this data helps teams identify where optimization opportunities exist before investigating the underlying reasons behind user behavior. It is the starting point for most CRO programs, pointing teams toward the pages and journeys that need the most attention.
A premium version, Google Analytics 360, is available for enterprise teams that need higher data limits and advanced reporting capabilities.
Key features
Real-time and acquisition reporting across sites and apps
Predictive capabilities using Google’s machine learning to identify users likely to purchase or churn
Cross-platform attribution to understand the role of each marketing channel
Funnel exploration, path exploration, and cohort analysis for deeper behavioral insights
Integrates with Google Ads, Search Ads 360, Display and Video 360, Google Search Console, and Salesforce Marketing Cloud
Pros
It is free to use, making it one of the most accessible tools available for businesses of all sizes.
It offers comprehensive reporting and customizable dashboards, which allow users to tailor data views to their specific needs.
GA4’s event-based tracking enables more flexible and in-depth analysis of user engagement across both websites and mobile apps.
Cons
Some users report data delays in standard reports, which can hinder real-time decision-making.
Data discrepancies and sampling issues can reduce accuracy and create confusion.
While integration with Google tools is strong, third-party integrations can be complex to configure.
Pricing
Google Analytics (GA4) is free to use
Google Analytics 360 is a paid plan
A customer experience as per G2 reviews:
Google Analytics gives a lot of useful insights about how people are using your website or app. You can see where your visitors are coming from, what pages they visit, how long they stay, and what actions they take. The event-based tracking system is very flexible, and you can set up custom events without needing extra code in many cases. It also works well across websites and mobile apps in one place. Once you understand how it works, you can get a clear view of what’s helping your site grow and where you might be losing visitors.
Lilee Sah L. Senior SEO Executive
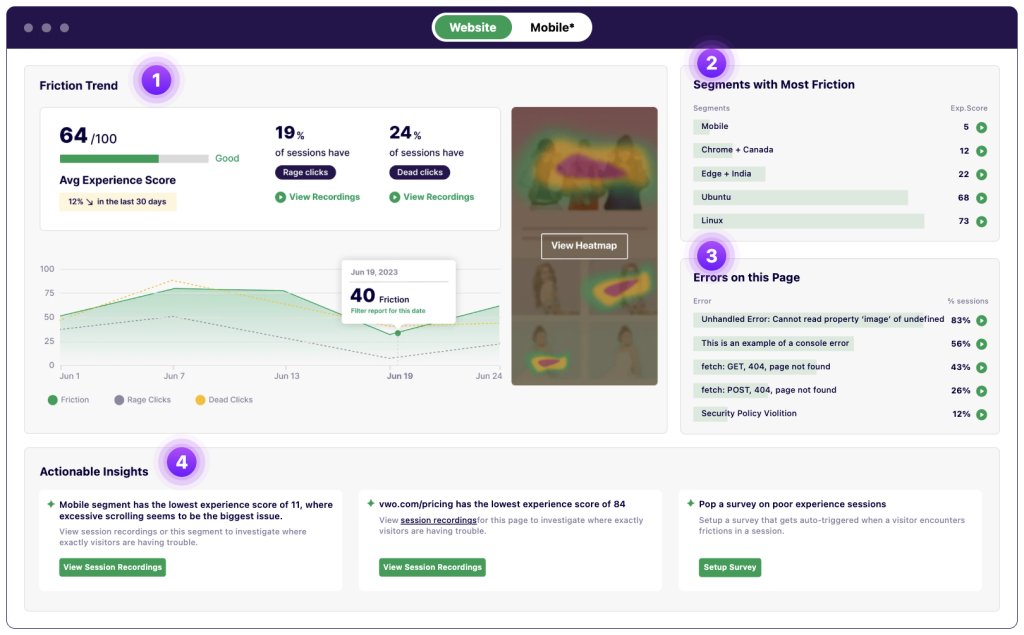
2. VWO Insights
What it does
VWO Insights is the behavior analytics capability within the VWO ABTasty platform that helps CRO teams across businesses of all sizes, including enterprises, to understand not just what is happening on their website, but also the ‘why’. It consolidates all visitor behavior data into one dashboard, covering heatmaps, session recordings, funnel analytics, and form analytics.
Key features
Heatmaps, clickmaps, and scroll maps across site pages
Session recordings with filters for rage clicks, dead clicks, and drop-off behavior
Funnel analytics to pinpoint the exact step where users abandon
Form analytics to identify friction in checkout or sign-up flows
Insights Dashboard with an experience score graded from 0 to 100 for every page
Segment-level experience scores for targeted analysis by device, user type, or behavior
Heatmaps for both the control and variation, allowing users to see how visitors interact with test variations and better understand how test changes influence user behavior.
Pros
Dynamic and flexible data sampling methods offer enhanced control over the data collection process
Flexible pricing plans are available, catering to businesses of all sizes
AI-powered features improve efficiency and save time
Exceptional customer support with a 99% CSAT score
Cons
Session recordings are restricted to a maximum of 2 hours or 20 page views, which means very long browsing sessions may not be fully recorded.
VWO Insights has been invaluable for understanding our customers’ behavior. Instead of guessing, we now make data-driven decisions backed by heatmaps, clickmaps, funnels, and recordings. It helps us identify crucial UX issues and build strong AB test hypotheses. Using VWO Insights, we achieved significant uplifts – such as an 11% increase in product page visits and a 9% increase in sales after implementing customer reviews on the homepage. It’s an essential tool in our conversion optimization process.
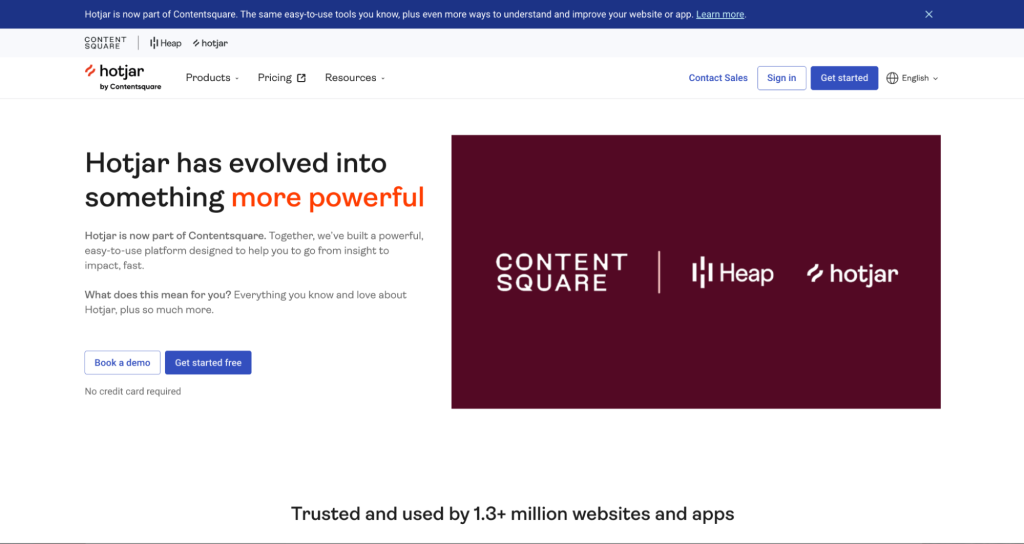
Hotjar helps teams understand how users interact with their website through heatmaps, session recordings, surveys, and feedback tools. As part of Contentsquare alongside Heap, it has evolved into a broader experience intelligence platform.
Key features
Heatmaps, including an Attention Heatmap that shows where visitors spend the most time
Session replay and funnels to visualize drop-offs in key journeys
On-site surveys and feedback tools
User interviews and unmoderated tests for in-depth qualitative research
Sense AI for session replay summaries and conversational insight exploration
Product analytics dashboards powered by Heap for tracking acquisition, retention, churn, and feature adoption
Pros
Provides a well-rounded view of the user experience
It provides heatmaps and session recordings that clearly show how users click, scroll, and interact with pages.
It includes feedback tools like surveys and on-page widgets to capture user input directly.
Cons
The free plan has limits on session recordings, which can restrict visibility.
Filtering and segmentation options can feel limited, especially when working with larger datasets.
Pricing
Hotjar offers a free plan with limited features
Paid plans start at $39 per month
Hotjar offers a 30-day free trial
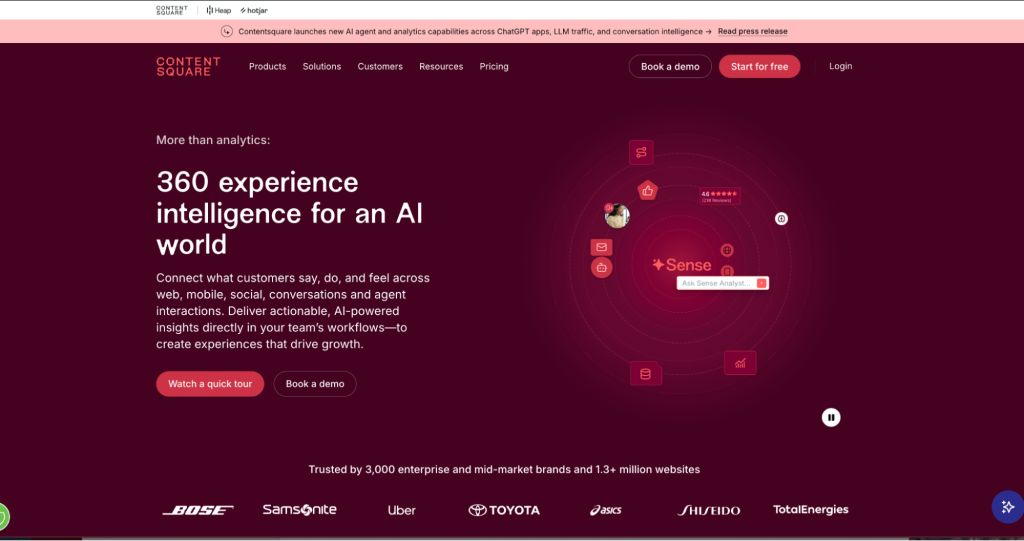
4. Contentsquare
What it does:
Contentsquare is an enterprise-grade experience intelligence platform that connects what customers say, do, and feel across web, mobile, social, conversations, and agent interactions. It captures entire user journeys without manual tagging and uses AI to surface the most important insights directly in team workflows, giving teams a complete view of what customers are really experiencing. It brings together experience analytics, product analytics, voice of customer, conversation intelligence, and experience monitoring under one roof.
Key features
Experience Analytics includes heatmaps, session replays, acquisition analysis, and impact quantification to visualize how users interact with every page.
Experience Monitoring includes error and speed analysis to identify and resolve issues before they impact users
Product Analytics for tracking user behavior, funnels, and retention across web and mobile
Voice of Customer tools to capture and analyze customer feedback at scale
Conversation Intelligence to connect insights from customer support and agent interactions
Sense AI is an always-on AI agent that runs in-depth analysis and delivers goal-driven next steps for the entire team
Pros
It offers powerful dashboards and segmentation capabilities while still being relatively easy to build and customize.
It enables both high-level overviews and deep-dive analysis, making it suitable for varied use cases and team maturity levels.
The platform complements quantitative analytics tools by adding qualitative and behavioral context.
Cons
Page mapping and zoning setup can be time-consuming, complex, and sometimes difficult to manage at scale.
Exporting raw data and integrating with other tools can be limited, especially for advanced analysis needs.
Pricing
It offers a free plan with limited features
Paid plans start at $39 per month
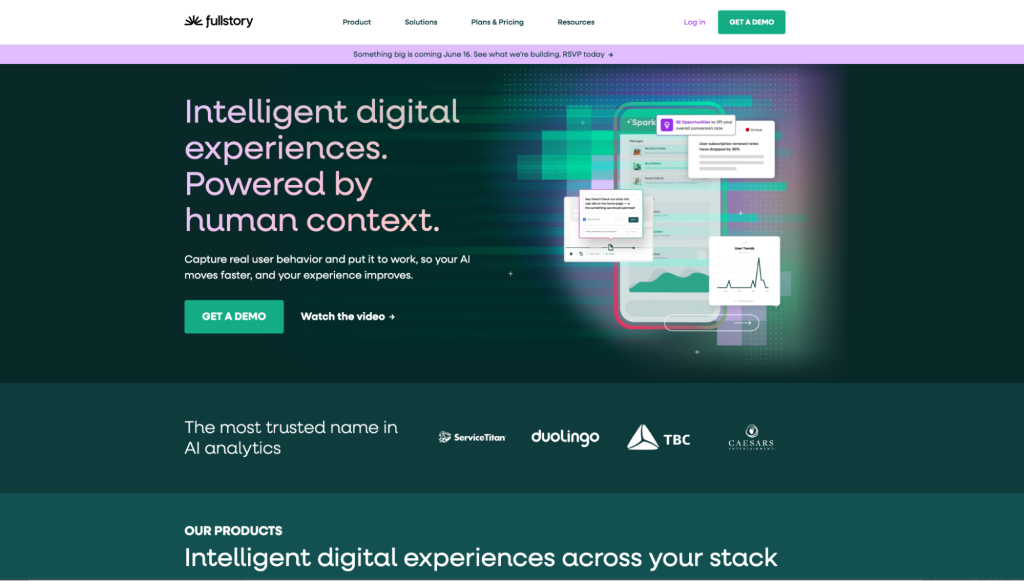
5. Fullstory
What it does:
Fullstory is a behavioral data and analytics platform that captures real user behavior and turns it into actionable intelligence. It provides a complete, privacy-first record of every user interaction through its Fullcapture technology, giving teams the behavioral context they need to remove friction, improve experiences, and make faster decisions. Beyond analytics, it also covers employee experience through Fullstory Workforce and data activation through Fullstory Anywhere.
Key features
Session replay to watch real user sessions and understand behavior in context
Heatmaps, funnel analysis, and journey maps to identify drop-off points and navigation patterns
StoryAI to turn behavioral data into clear, accurate answers without manual data digging
Sentiment Signals and rage click detection to surface frustration before it becomes churn
Mobile analytics for behavior tracking across mobile apps
Fullstory Anywhere to activate behavioral data and create personalized user experiences
Pros
Strong filtering and search capabilities help teams isolate specific user journeys, segments, and friction points efficiently.
The platform enables faster troubleshooting by linking technical data with user sessions to diagnose issues accurately.
Implementation on the web is relatively simple, especially via tag-based setup.
Cons
Mobile/app implementation is more complex compared to web, requiring additional setup (e.g., APIs for page definitions).
Exporting data reduces interactivity, making it harder to share insights effectively outside the platform.
Some usability gaps exist, such as the inability to capture exact screenshots or manage multiple orgs simultaneously.
Pricing
Fullstory Analytics offers three plans: Business, Advanced, and Enterprise
Pricing is not publicly listed and is available on request
A 14-day free trial is available
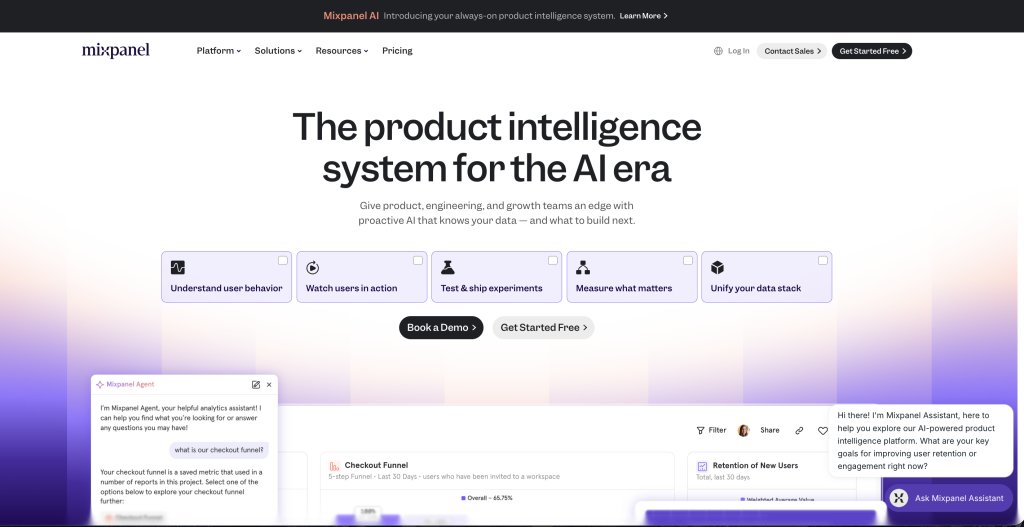
6. Mixpanel
What it does
Mixpanel is a product analytics platform that helps teams understand user behavior and make faster, more confident decisions. It tracks events, builds funnels, analyzes retention, and segments users with flexibility. Its always-on AI layer, Mixpanel AI, proactively surfaces insights, diagnoses problems, and recommends what to build next without waiting to be asked.
Key Features
Event tracking, funnel analysis, and retention reporting across web and app
Web analytics that goes beyond pageviews to capture real user behavior
Session replay and heatmaps tied directly to analytics
A/B testing and feature flags managed from the same platform
Metric Trees to map how KPIs relate to each other
Mixpanel AI for proactive insight surfacing, problem diagnosis, and next-step recommendations
Pros
Its event-based tracking model provides deep visibility into user behavior across the entire product journey.
Easy environment setup (e.g., dev vs. production) supports testing and experimentation workflows.
Reliable performance even with large datasets makes it suitable for scaling businesses.
Cons
Initial setup and implementation can be complex and time-consuming, especially when deciding on tracking approaches.
Some limitations exist in reporting (e.g., handling too many events, lack of templates, or customization constraints).
AI capabilities are helpful but not always proactive or advanced enough in suggesting insights.
Pricing
Mixpanel offers three plans: Free, Growth, and Enterprise
Pricing is not publicly listed and is available on request
A customer experience as per G2 reviews:
Two things stood out with Mixpanel for us – how easy it was to set up and start sending events from our application into it. And then how good the web ui tools were and how easy it was to build dashboards and graphs. We now use Mixpanel across our organization as our primary analytics platform.
Brian R. CEO
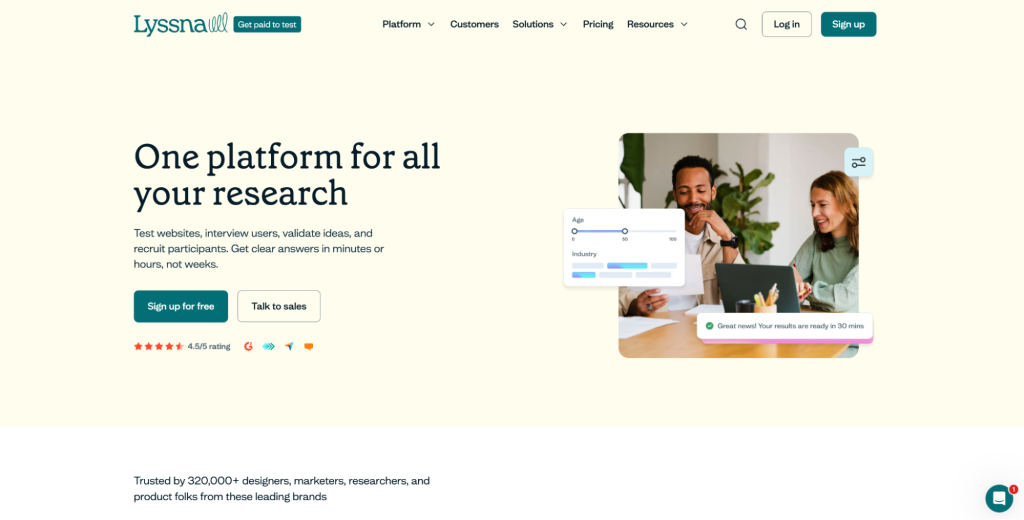
7. Lyssna
What it does
Lyssna, formerly known as UsabilityHub, is a user research platform that eliminates the guesswork out of design decisions by validating them with real users. It functions as an opinion-gathering tool that enables teams to sample responses from real users and make design decisions backed by evidence rather than assumptions. It covers the full spectrum of research needs, from qualitative to quantitative and moderated to unmoderated, giving design, research, marketing, and product teams a single place to validate decisions.
Key features
User interviews for in-depth moderated research conversations
Prototype testing to validate designs before development begins
Surveys for quantitative feedback at scale
First click testing to understand where users instinctively go on a page
Five-second testing to measure first impressions and message clarity
Preference testing to compare design options with real user input
Card sorting to understand how users categorize and navigate information
Built-in research panel of 530,000 panelists for guaranteed participant access
Pros:
It has a clean, intuitive, and easy-to-navigate interface, making it accessible for both beginners and experienced UX researchers.
Extremely fast turnaround times for results (often within minutes), enabling rapid iteration and quicker decision-making.
Simple and quick setup for usability tests (e.g., five-second tests, preference tests), reducing time to launch research.
Flexible participant recruitment options, including both built-in panels and external/self-recruited users.
Cons:
Lack of automated, polished report generation (e.g., summaries into presentations or documents).
Panel quality can be inconsistent, with some low-effort responses that require manual filtering.
Limited collaboration/account management flexibility (e.g., difficulty adding users across accounts or organizations).
Pricing:
Lyssna offers a free plan with limited features
Paid plans start at $165 per month
The hypothesis stage
Once you’ve gathered and analyzed all the necessary website visitor data using the above-mentioned research tools, it’s time to move to the next stage – create a hypothesis for your (next) experiment(s).
A data-backed hypothesis is key to properly running a CRO experiment. Here are some must-have tools to use when crafting a hypothesis.
Hypothesis framework: Simple and Advanced versions for writing data-backed hypotheses
No
Free
2
Test Hypothesis Creator
Online hypothesis tool: seven-step guided process based on Craig Sullivan’s legacy format
No
Free
3
VWO AI
Agentic optimization: automated hypothesis generation, friction point detection, AI-generated test ideas, hypothesis dashboard management
30-day free trial
Custom pricing
Detailed overview
1. Craig Sullivan’s hypothesis framework
What it does
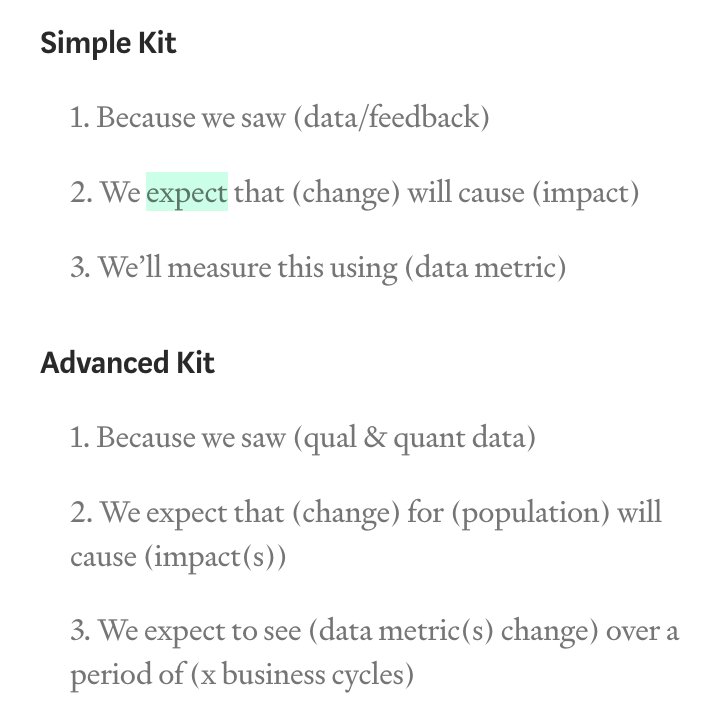
Craig Sullivan is a CRO influencer who shares a handy kit with two options to write a good, data-backed hypothesis. The kit includes a Simple and an Advanced version, each with its own meaning and relevance.
The Simple Kit covers the basics in three steps. It is best suited for teams that are new to hypothesis writing or running straightforward, lower-stakes experiments.
The Advanced Kit goes deeper by specifying the population affected, accounting for multiple impacts, and measuring results over a defined number of business cycles rather than a fixed timeframe. It is recommended when running high-impact experiments where precision and accountability matter most.
Key features
Two versions of the framework: Simple and Advanced
Structured format for writing data-backed hypotheses
Designed specifically for high-impact CRO experiments
Pricing
Free
2. Test hypothesis creator
What it does
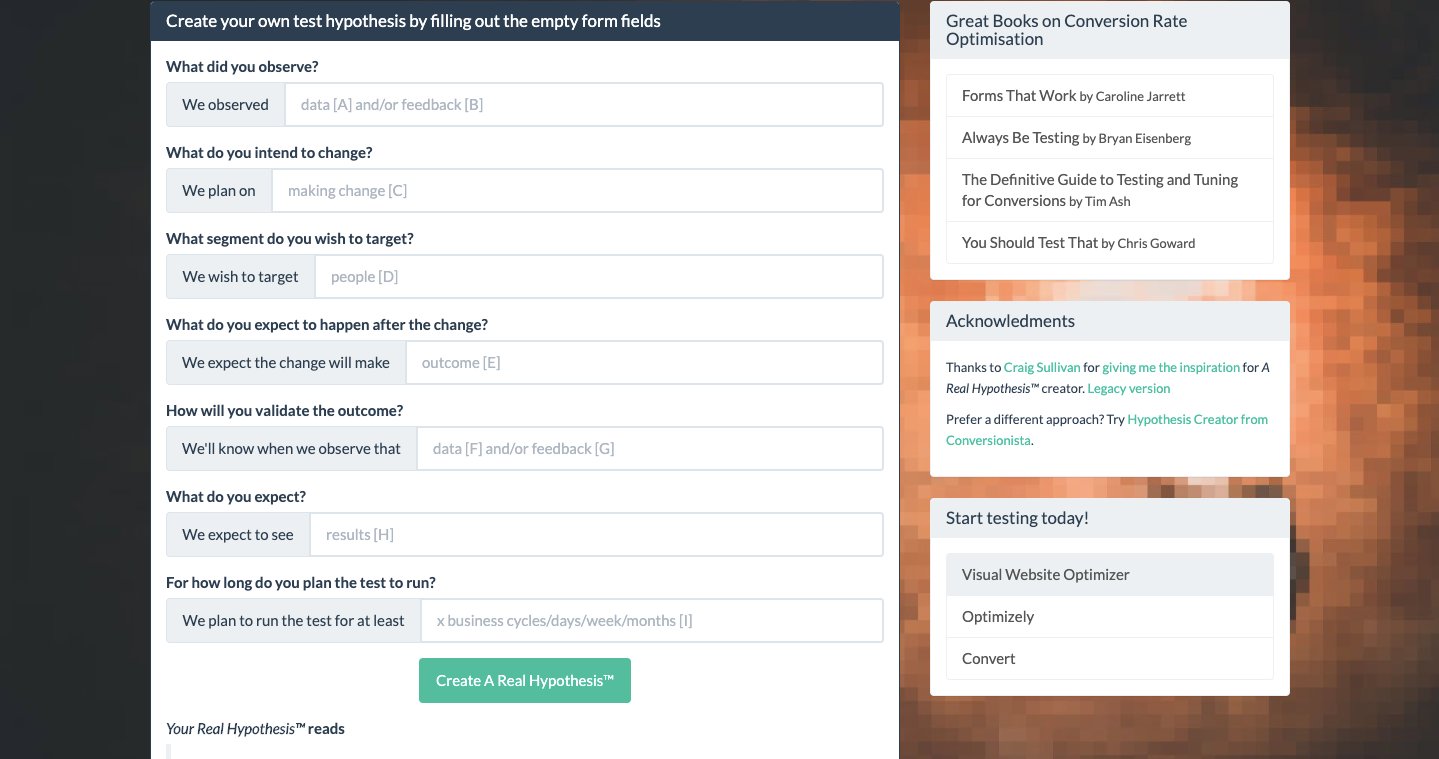
The Test Hypothesis Creator is a seven-step online tool that draws inspiration from Craig Sullivan’s legacy hypothesis format. It allows teams to create a structured hypothesis by filling in a series of form fields, making the process straightforward even for those new to CRO experimentation. However, we’d recommend you use one more hypothesis creator to validate your hypothesis.
Key features
Seven-step guided hypothesis creation process
Based on Craig Sullivan’s legacy hypothesis format
Simple form-field structure accessible to non-specialists
Pricing
Free
3. VWO AI
What it does
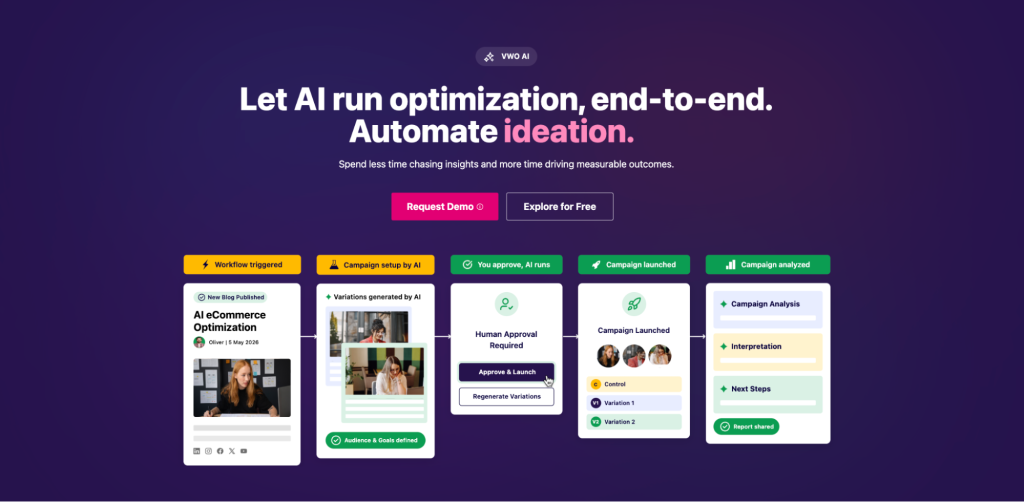
VWO AI is an agentic optimization system within the VWO platform that automates the hypothesis generation process by analyzing user behavior data, identifying friction points, and translating those insights into actionable test ideas with rationale.
Teams can also generate high-impact test ideas through simple prompts tailored to specific pages, goals, and user segments, drawing on AI trained on real-world data.
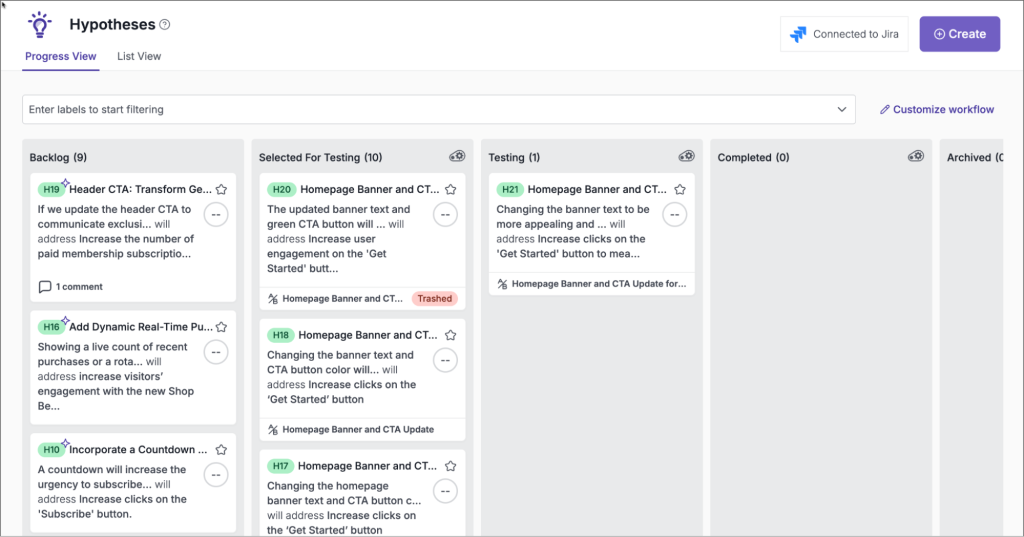
Once VWO AI generates hypotheses, VWO Plan’s hypothesis dashboard provides the operational layer to manage and track them, giving the entire team a live view of where each idea stands and keeping collaboration centered in one place.
Key features
Automated user behavior analysis that spots hidden friction points instantly
AI-generated hypotheses and test ideas tailored to specific pages, goals, and user segments, each with a rationale
Proactive insights and next-step recommendations without manual querying
VWO Plan hypothesis dashboard to manage, track, and organize generated hypotheses
Clone functionality to replicate similar hypothesis configurations without starting from scratch
Pricing
VWO offers a 30-day free trial
Visit VWO pricing and plans for detailed information.
Here’s what one of our customers had to say:
VWO Platform help me quickly and easily find conversion optimization wins that I can standardize across our whole enterprise. I don’t like to use the phrase “best practice” unless I can prove it, and my proof is in the data provided by VWO.
Brandon Gentry Director, User Experience at Warner Music Group
The prioritization stage
Once you’ve created your hypothesis, it’s time to design, develop, and test the variations you’re planning to run against the original versions. You can either hire a dedicated resource or a team to build A/B testing experiments or use the support provided by VWO.
Test case management: test case creation, test suite management, stakeholder coordination, real-time progress tracking
No
Custom pricing
Detailed overview
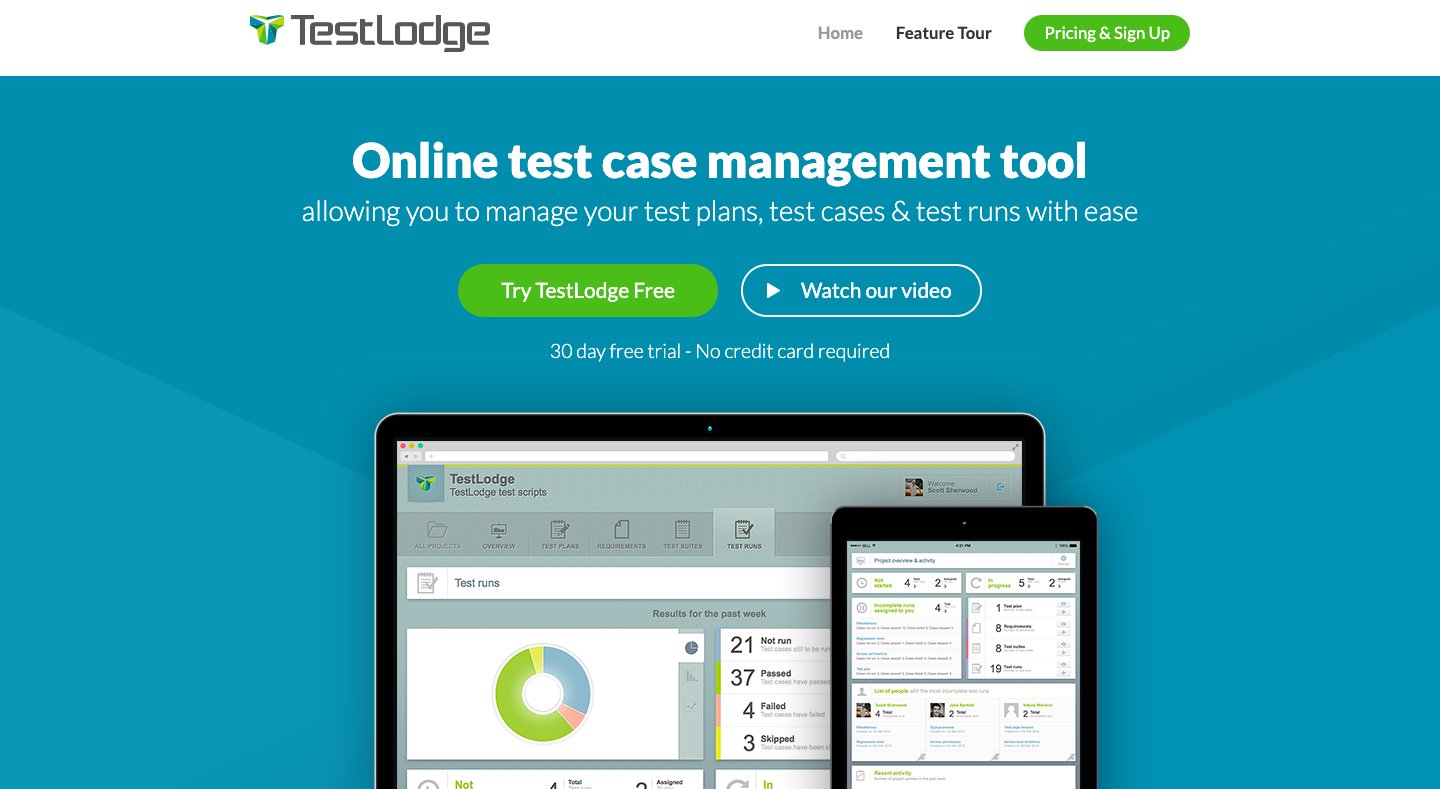
1. TestLodge
What it does
TestLodge is another test management tool that helps manage various project requirements, test plans, test cases, test runs, user testing, and related reporting. With a simple and easy-to-learn interface and no user limits, the tool allows you and your entire team to manage respective A/B testing plans, requirements, and test cases, all in one place. Another feature that makes TestLodge stand out is that it’s a web-based, cloud-hosted tool enabling you to access the tool anytime and anywhere you want.
Key features
Test case and test run tracking
User testing and reporting capabilities
Web-based and cloud-hosted for anytime access
Pricing
Enterprise plan at $499 per month.
Team plan at $99 per month.
Business plan at $299 per month.
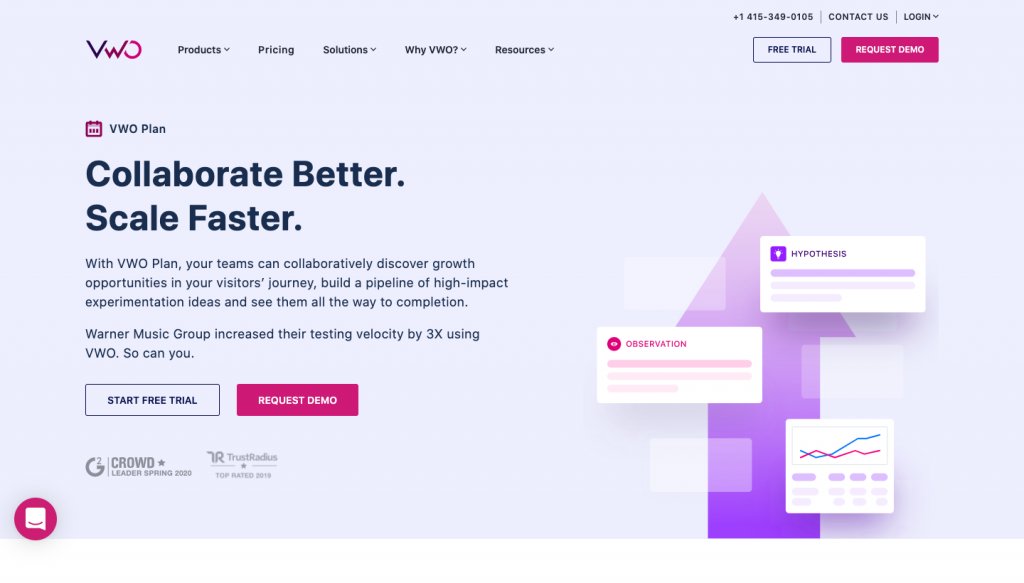
2. VWO Plan
What it does
VWO Plan is a module within the VWO AB Tasty platform that helps teams manage and prioritize their experimentation pipeline. It gives teams the structure to evaluate which experiments are worth running first and in what order.
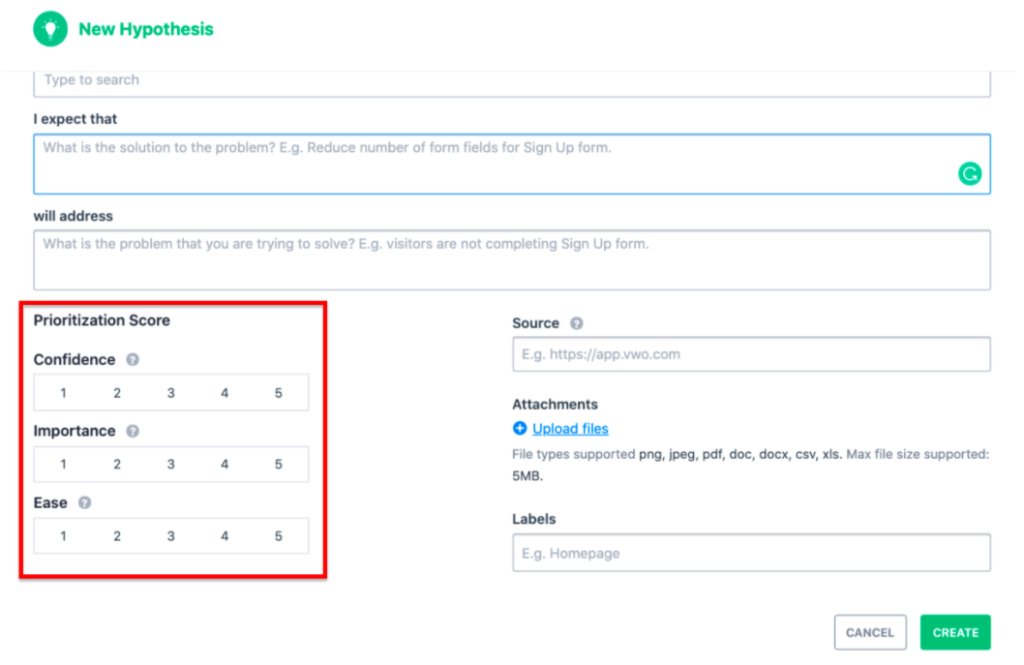
Each hypothesis is rated on three parameters: confidence in achieving the expected improvement, importance of the traffic being tested, and ease of implementing the proposed changes. Together, these ratings produce a prioritization score that scientifically sorts hypotheses so the most relevant and highest-ROI experiments get run first.
Beyond scoring, VWO Plan connects the entire optimization workflow in one place. User behavioral observations captured through VWO Insights can be synced directly into VWO Plan, turning qualitative findings into documented, prioritized, and validated experimentation ideas without switching between tools.
Key features
Hypothesis prioritization scoring based on three parameters: confidence, importance, and ease, each rated on a scale of 1 to 5
List View with sort and filter options by creation date, last updated, and prioritization score
Backlog tracking to maintain visibility over all test opportunities at every stage
Archive functionality to maintain a record of completed and discarded hypotheses
Pricing
Free
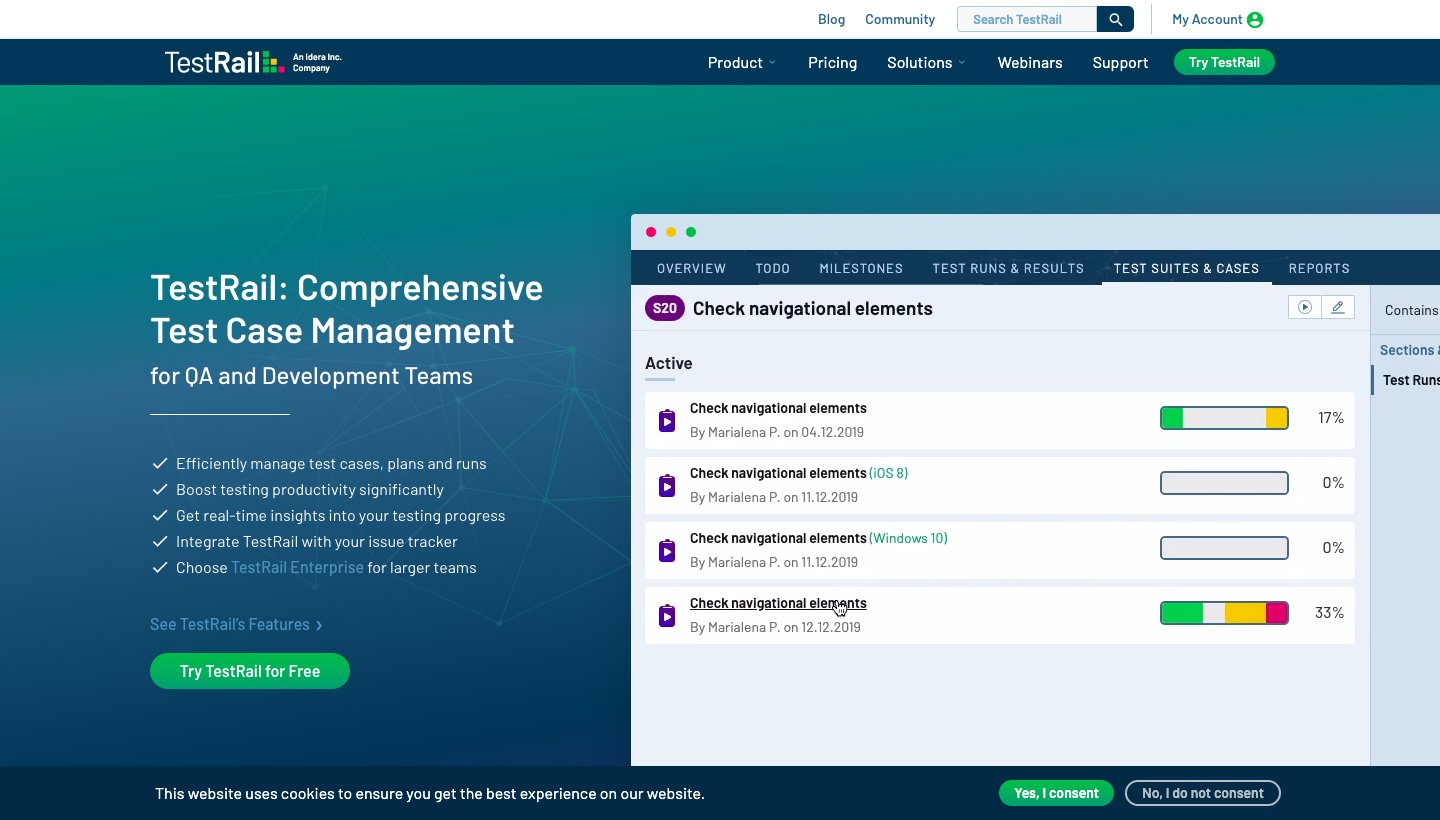
3. TestRail
What it does
TestRail is one of the leading test case and test management software tools. It enables you to easily manage and track your testing ideas and hypotheses. Its web-based user interface enables you to easily create test cases, manage different test suites, and even coordinate throughout the entire testing process with various stakeholders. The tool also provides real-time insights into your testing progress and even boosts productivity by personalizing your to-do lists, filters, and email notifications.
Key features
Stakeholder coordination throughout the testing process
Personalized to-do lists, filters, and email notifications for productivity
Web-based interface accessible without local installation
Flexible hosting options, including cloud and server management
Pricing
Pricing depends on the number of users and the hosting model. Contact TestRail for a quote.
Pre-testing stage
Now that the treatment is ready, it is time to run your planned CRO experiments. But before you jump in, ensure you get your sample size and test duration right, as they are two crucial factors to running a meaningful CRO experiment.
Here are some free CRO tools to help you at this stage:
Calculates how long an A/B test should run for statistically significant results. It uses a Bayesian test approach
Free
2
A/B test significance calculator
Determines whether an A/B or multivariate test result is statistically significant
Free
3
Sample size calculator
Calculates the sample size required to ensure statistical significance in A/B testing
Free
4
Split test duration calculator
Estimates how long a split test should run based on conversion rate, uplift, traffic, variations, and confidence level
Free
Detailed overview
1. A/B test duration calculator
What it does:
This handy A/B test duration calculator enables you to easily and quickly calculate how long a test should run to get a statistically significant result. It provides comprehensive insights about the test, optimizations, UI/UX, and more. Additionally, the A/B testing calculator uses the Bayesian test approach to eliminate the chances of implementing non-significant test variations, which may show negative results.
Key features
Calculates the required duration for statistically significant A/B test results
Uses a Bayesian test approach for more reliable outcomes
Provides insights on test optimizations and UI/UX considerations
Pricing
Free
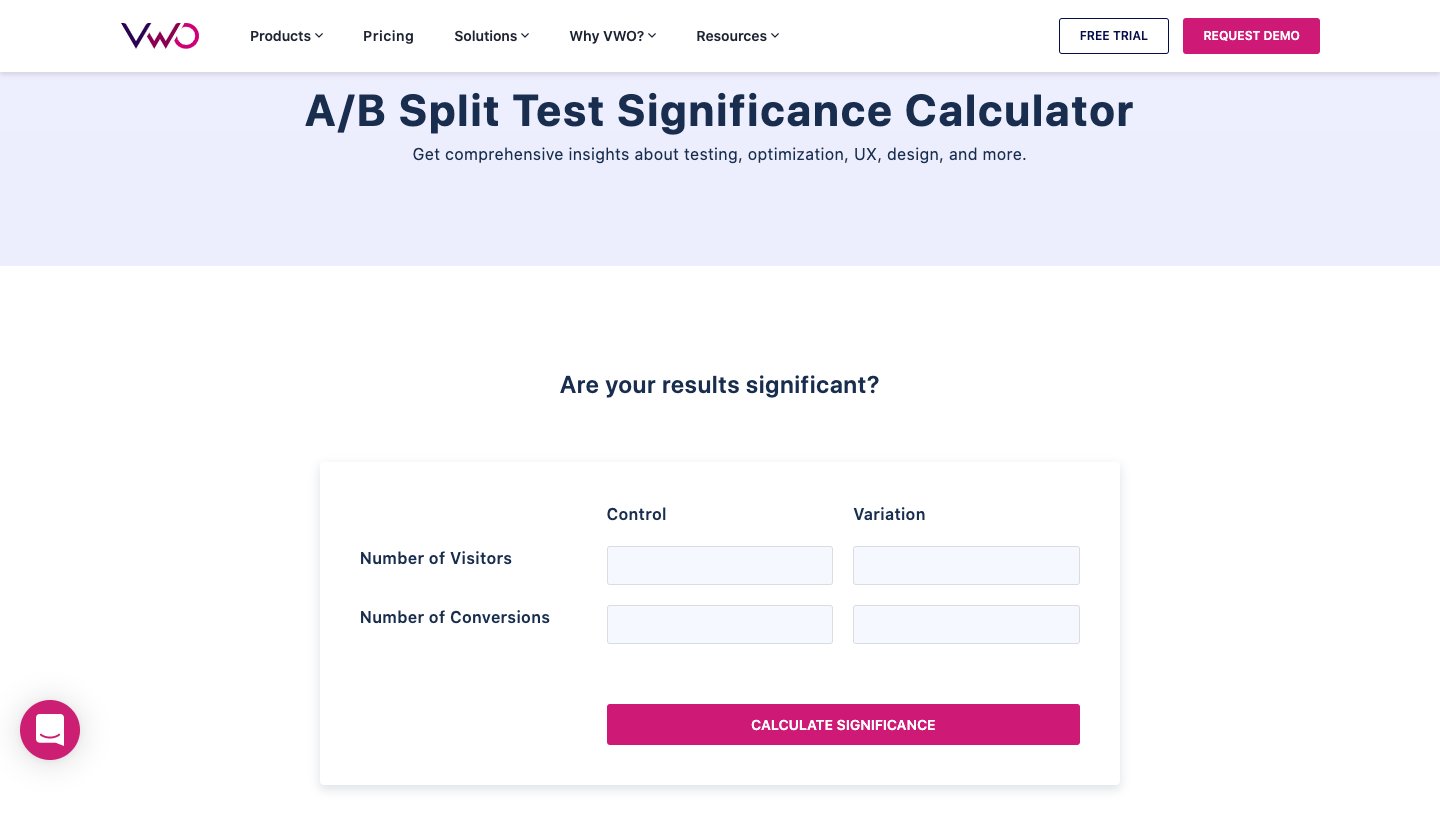
2. A/B test significance calculator
What it does
The A/B test significance calculator is a straightforward tool that determines whether an A/B or multivariate test result is statistically significant. It gives teams a clear answer on whether the results they are seeing are real or likely due to random variation, before any decisions are made based on test outcomes.
Key features
Determines statistical significance for A/B and multivariate test results
Provides a clear pass or fail signal on test result validity
Pricing
Free
3. Sample size calculator
What it does:
A sample size calculator helps teams calculate the minimum number of visitors each variation needs before an A/B test can produce statistically significant results. Running a test without a sufficient sample size is one of the most common causes of unreliable results, and this tool removes that risk by setting a clear traffic threshold before the test begins.
Key features
Calculates the required sample size for statistically significant A/B testing
Sets a clear visitor threshold for each variation before testing begins
Pricing
Free
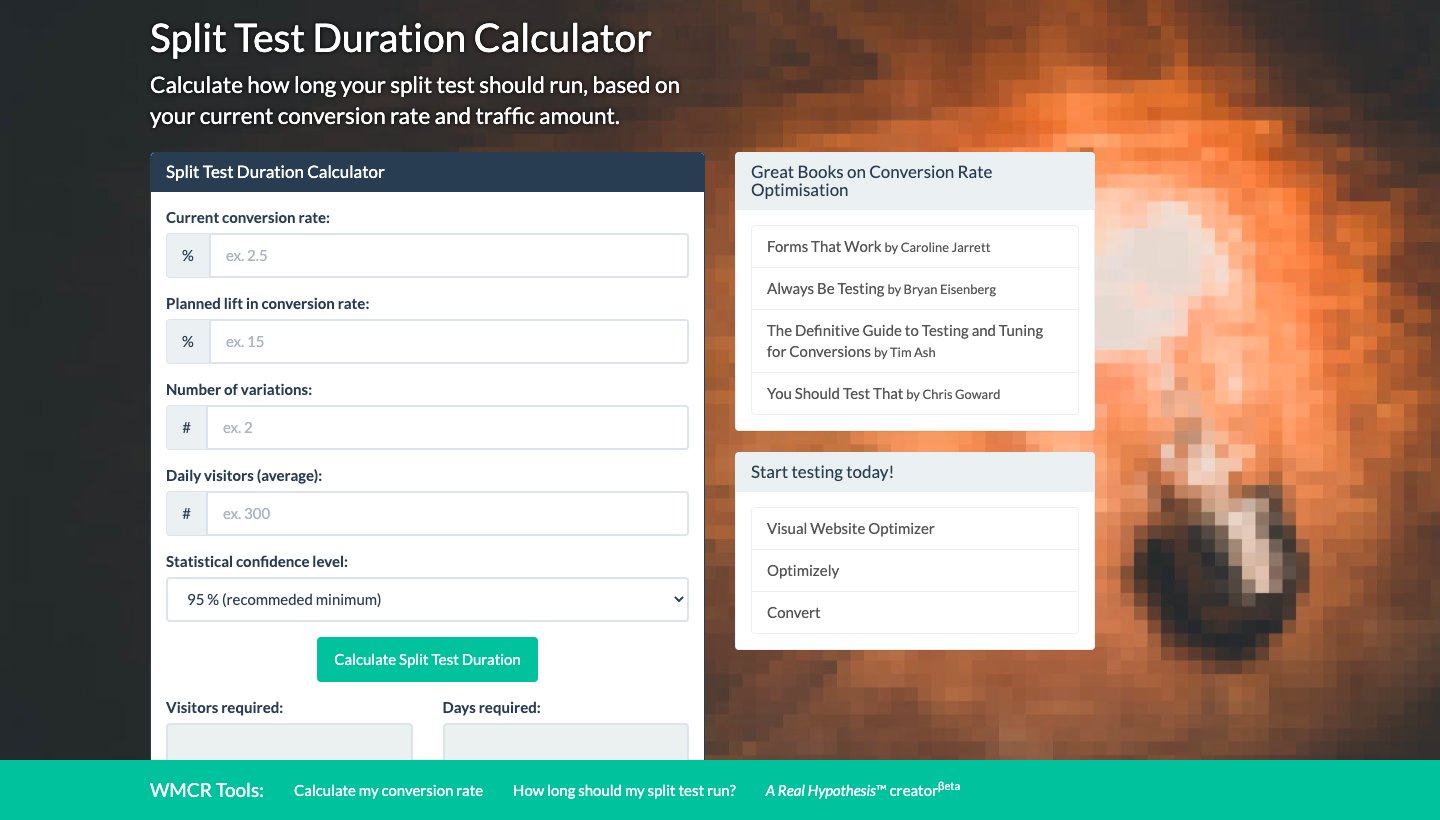
4. Split test duration calculator
What it does:
The Split Test Duration Calculator, designed and offered by Michael Kjeldsen, estimates how long a split test should run before results can be trusted. It takes into account the current conversion rate, planned uplift, number of variations being tested, average daily traffic, and the required statistical confidence level, giving teams a precise duration estimate rather than a rough guess.
Key features
Estimates split test duration based on conversion rate and planned uplift
Accounts for the number of variations, daily traffic, and confidence level
Designed specifically for split tests with multiple variations
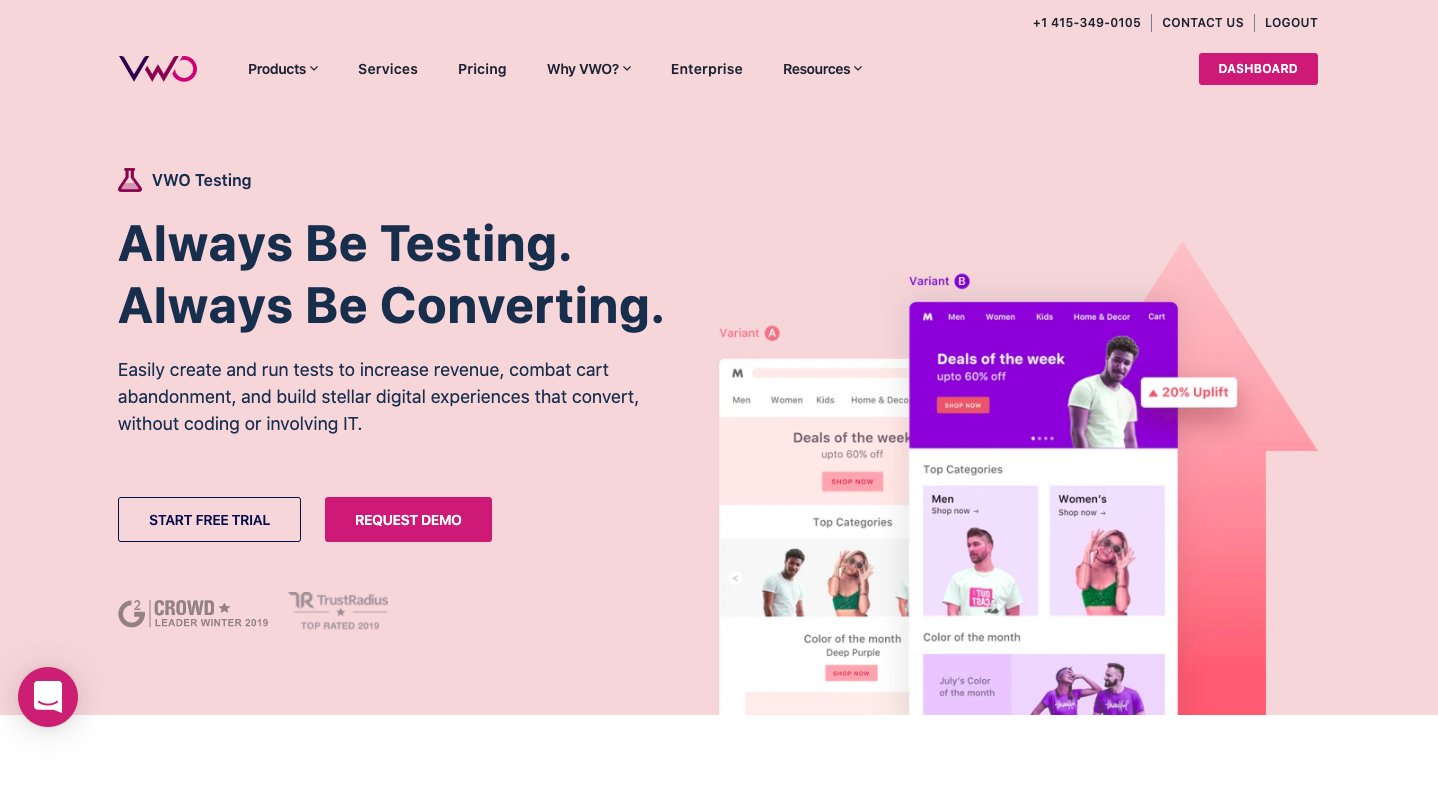
VWO enables teams to run A/B tests, split URL tests, and multivariate tests on websites through VWO Testing. For mobile apps and server-side experimentation, VWO Feature Experimentation allows teams to test features, roll out changes gradually, and run experiments without relying on client-side modifications.
Its Bayesian-powered SmartStats engine accounts for common statistical biases like sequential testing errors and Bonferroni errors, delivering reliable and real-time reports that teams can act on with confidence.
Key features
A/B testing, split URL testing, and multivariate testing across web, mobile apps, and server-side environments
Bayesian-powered SmartStats engine for reliable, real-time statistical reporting
A generative AI engine that produces tailored optimization ideas
Audience and behavior targeting with mutually exclusive campaigns
Multi-armed bandit testing for dynamic traffic allocation to winning variations
In-app comment feature for cross-team communication within experiments
SDK-based server-side tests with no latency for omnichannel experimentation
Pros
Client-side tests are flicker-free so that users can see a consistent experience throughout the experiment
SDK-based server-side testing means no latency and supports omnichannel experimentation
The Bayesian SmartStats engine produces reliable results without requiring manual statistical interpretation
Cons:
Lack of pull integrations from behavior analysis platforms like Hotjar, CS, Fullstory, Adobe Analytics, etc.
Pricing
VWO offers a 30-day free trial
Visit VWO pricing and plans for detailed information.
Here’s what one of our customers had to say:
We’ve explored various A/B testing tools over the past two years, but consistently encountered flickering issues that hindered our experimentation efforts. VWO’s user-friendly interface and intuitive design have been a breath of fresh air. The platform’s stability and reliability have significantly improved our ability to conduct meaningful A/B tests.
Richard Rodricks Innovation Analyst at AutoFlip
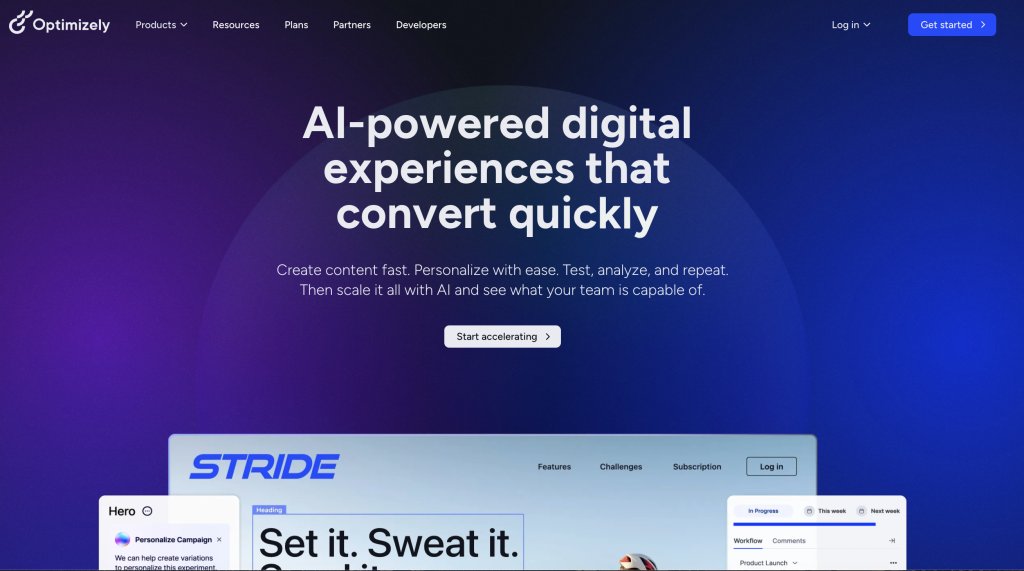
2. Optimizely
What it does:
Optimizely is a comprehensive digital experience platform that provides web and feature experimentation capabilities, content management, and advanced personalization engines. Its project management capabilities are available on both client and server-side testing, and it integrates a Customer Data Platform to centralize and harmonize customer data across the experimentation workflow.
Key features
Bayesian and Frequentist statistics engine for flexible statistical modeling
CDN A/B testing and multi-armed bandit testing
Advanced omnichannel personalization solutions
Advanced native integration for server-side testing
Pros:
Sequential Hypothesis testing improves the accuracy of test performance
Strong segmentation capabilities for precise audience targeting
Cons:
Switching between snippets and mini-snippets causes performance issues and delays website loading time
Pricing:
Pricing is available on request. Contact Optimizely directly for plan and pricing details.
3. Kameleoon
What it does:
Kameleoon is a platform offering personalization, feature management, and website optimization for both product and marketing teams. It accelerates experimentation efforts while integrating seamlessly with existing tech stacks, supporting teams that need flexibility across both client-side and server-side testing environments.
Key features
Frequentist statistical model by default with the option to switch to Bayesian analysis
Multi-armed bandit testing for dynamic traffic allocation
45+ native targeting criteria for precise audience segmentation
AI-driven capabilities for audience targeting, tailored variation creation, and test result analysis
Pros :
Strong custom-based targeting capabilities available on Kameleoon Full Stack
Flexibility to switch between Frequentist and Bayesian statistical models depending on team preference
Cons:
Behavioral insights capabilities are missing, requiring a separate tool for heatmaps and session recordings
Project management capabilities are not included in the platform
Pricing
Pricing is available on request. Contact Kameleoon directly for plan and pricing details.
Personalization stage
After running a successful A/B test, you now know what works for your audience in aggregate. Personalization takes that insight further by delivering tailored experiences to specific segments of your audience rather than applying a single winning variation to everyone equally.
The insights gathered from your experiments become the inputs for your personalization strategy. Rather than starting from scratch, you are taking validated learnings and applying them with greater precision across audience segments defined by behavior, demographics, device type, purchase history, and more. Here are some tools to help you:
First and third-party data targeting, visual editor, trigger events, comprehensive reporting, and analytics dashboard
No
Custom pricing
Detailed overview
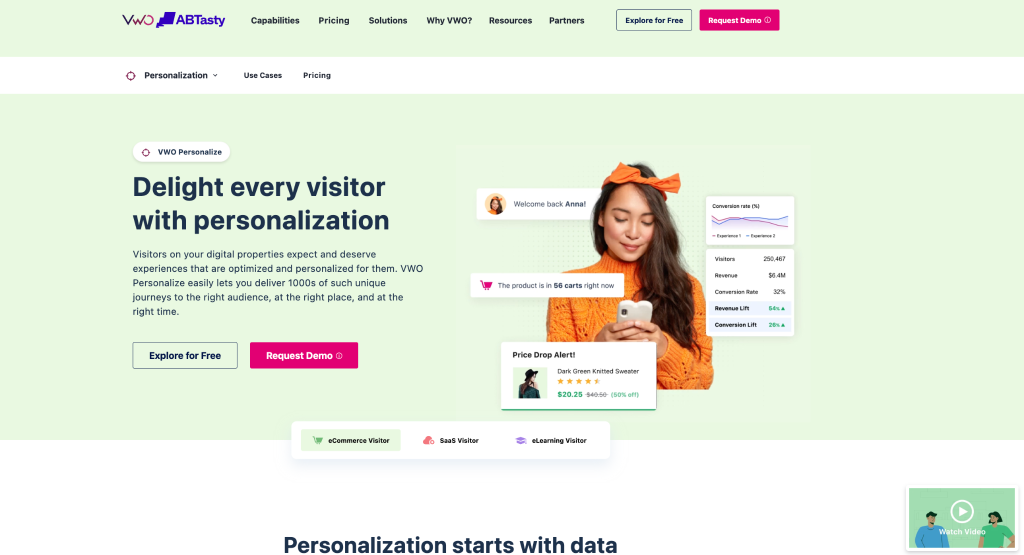
1. VWO Personalize
What it does:
VWO Personalize enables teams of all sizes, including enterprises, to create, optimize, and deliver highly personalized experiences to website visitors by gathering key insights into how visitors engage with the site and using that data to craft and release tailored experiences for the right audience at the right time.
It pulls together browser-based properties, website engagement data, uploaded attribute lists, and third-party data into one platform, allowing teams to build a unified view of every visitor and personalize based on who they are, where they are in the buyer journey, and how they behave.
Unlike AI-driven personalization, VWO Personalize gives teams precise control over targeting through rule-based personalization, making it particularly valuable in compliance-sensitive industries like finance and healthcare.
Key features
Rule-based audience segments built on advanced conditions for targeted experience delivery
Hyper-personalization with layered experiences for overlapping segments, assignable by priority or random selection
WYSIWYG Visual Editor with ready-to-use widgets for no-code experience creation
Pros:
Create and launch personalized experiences without extensive developer involvement with a no-code editor
Combine A/B testing and personalization within the same platform, allowing teams to validate personalized experiences before scaling them
Real-time reporting and performance tracking to measure the impact of personalization campaigns.
Cons:
Pricing can be high, especially for companies with limited budgets or smaller teams.
Initial setup may require some technical knowledge
Pricing:
VWO offers a 30-day free trial.
Visit VWO pricing and plans for detailed information
2. Dynamic Yield
What it does:
Dynamic Yield is a personalization platform that algorithmically predicts visitor interests to deliver personalized content, offers, and product recommendations across digital channels. It uses Experience OS with AI-powered personalization to identify personalization opportunities and machine learning to drive recommendations, giving teams a data-driven approach to delivering relevant experiences at scale.
Key features
AI-powered targeting to predict customer needs and deliver relevant experiences
Machine learning-driven product and content recommendations
Unified view of customer data across digital channels
Personalization across all digital channels, including web, mobile, and more
Pros:
Robust targeting and segmentation capabilities for precise audience personalization
A wide range of templates and trigger options gives teams flexibility in how experiences are delivered
Real-time analytics simplifies the decision-making process by surfacing performance data instantly
AI and machine learning handle prediction and recommendation at scale
Cons:
Requires web development knowledge for advanced customization, creating dependency on technical teams
Lack of options to download campaign reports limits offline analysis and stakeholder reporting
Pricing:
Dynamic Yield offers custom pricing based on business requirements.
3. Optimizely
What it does:
Optimizely enables teams to build, scale, and deliver hyper-personalized experiences that match the needs and interests of website visitors. It combines first-party data with third-party data to precisely target specific user segments, giving teams a comprehensive data foundation for personalization campaigns across digital channels.
Key features
Visual editor for no-code experience creation and deployment
Trigger events to prompt experiences based on specific visitor actions
Comprehensive reporting and robust analytics dashboard
First-party and third-party data combination for precise audience targeting and segmentation
Pros:
Targeting and segmentation options make it easier to deliver relevant personalized experiences to specific audience groups
An in-depth analytics and reporting dashboard offers useful insights about visitor behavior and campaign performance
Cons:
Pricing plans are expensive compared to other competitors in the personalization space
Some metrics in the reports are difficult to understand, which can slow down performance analysis
Pricing:
Optimizely offers custom pricing plans based on business needs and goals.
The learning stage
This is the stage where you conclude your tests, close the conversion rate optimization loop, and document everything your experiments revealed. Win or lose, every test produces an insight that makes the next hypothesis sharper and the next experiment more likely to succeed.
VWO supports this process through its built-in reporting and experimentation capabilities, giving teams visibility into test performance, visitor behavior, and experiment outcomes. By helping teams analyze results, validate assumptions, and document learnings, VWO ensures that every experiment contributes to a more informed and data-driven optimization program.
Listen to our conversation with CRO expert Manuel Da Costa to learn how you can build an experimentation ecosystem.
When do you need CRO tools?
Experienced managers typically evaluate these actions through two lenses:
Macro (site-wide): To understand overall website performance
Micro (visitor-level): To analyze individual user behavior
A CRO tool helps analyze these actions to identify what is holding visitors back and increase conversions by delivering better experiences to every visitor. But there’s a problem.
Even experienced managers who carefully study customer behavior can miss opportunities if they don’t use the right CRO tools, leaving room for flaws and glitches.
To prevent this, we recommend using CRO tools aligned with each stage of optimization to enhance both your website and business performance effectively.
Since you’re engaging with visitor data at each stage, it’s essential to ensure that your data collection tools are GDPR compliant.
Integrations
A feature of a good conversion rate optimization tool is integrations with other tools or the ability to build custom integrations. It negates data silos when using multiple data analytics tools. This, in turn, prevents data duplication, confusion, and related uncertainties.
Security
If you plan to install supporting CRO software on your website, ensure the tool doesn’t get breached, especially when running experiments. Your CRO tools must be safe and secure to use. Single sign-ons, multi-step logins, etc., help ensure security. Check your CRO tool under consideration for these critical features.
You don’t need a large budget to get started with CRO. Many of the best free conversion rate optimization tools can help you lay a strong foundation. As your experimentation program matures and testing needs grow, you can scale to more comprehensive platforms that bring research, testing, and reporting under one roof.
Wrapping it up
This guide covers the most recommended CRO tools across every stage of the optimization journey, from research and hypothesis building through to testing, personalization, and learning. Choose the tools that match where your program is today and build from there.
If you prefer a single integrated platform that covers every stage without stitching together multiple tools, VWO is your go-to solution.
Whether you are analyzing user behavior, gathering feedback, validating ideas through testing, or delivering personalized experiences, VWO provides a comprehensive end-to-end solution. Sign up for a free trial or request a demo today.
Here’s a quick glimpse into VWO’s capabilities:
Frequently asked questions (FAQs)
Q1. What factors should you consider before selecting a CRO tool?
In today’s time, we have shared four main factors for selecting a CRO tool. – GDPR Compliance – Friendly User Interface – Integrations with other complementary tools – Security
Q2. What are the best free conversion rate optimization tools?
Several effective CRO tools are available: – Google Analytics covers quantitative research for free. – VWO Plan is free for hypothesis building and prioritization. It also provides free calculators to cover pre-testing needs. – For a single platform spanning multiple stages, VWO offers a 30-day free trial.
Q3. Do you need separate tools for qualitative and quantitative research, or can one platform handle both?
You need both types of data. Quantitative data tells you what users are doing, while qualitative insights help explain why. Platforms like VWO combine several research capabilities, including heatmaps, session recordings, surveys, and funnel analysis, into a single workflow. Many teams still pair VWO with analytics platforms such as GA4, but having these research tools together can make it easier to investigate and validate optimization opportunities.
Q4. Can you use CRO tools if your website has low traffic?
Low traffic means A/B tests take much longer to reach statistical significance. For low-traffic sites, qualitative tools like heatmaps and user testing platforms like Lyssna can surface meaningful insights with fewer visitors. You can use the free pre-testing calculators in this guide to determine exactly when your traffic volume is sufficient to run reliable experiments.
Q5. Do CRO tools require developer involvement, or can you run tests independently?
It depends on the complexity of the test. Simple A/B tests on page elements like headlines, images, and CTAs can typically be set up by non-technical users through a visual editor without any code. VWO Testing’s Visual Editor is a good example of this. Developer involvement becomes necessary for server-side tests.
Q6. What is the AI tool for conversion rate optimization?
Several CRO platforms now include AI capabilities. VWO AI automates behavior analysis, generates experiment ideas from webpage data, creates audience segments, and analyzes reports. The most useful AI CRO tools are those that reduce the time between data collection and confident decision-making.
Q7. How do you know if a CRO tool will slow down your website?
The main issue to watch for is flickering. You can check whether the tool uses asynchronous loading, which does not block page rendering. VWO Asynchronous Code prevents page flicker by hiding page elements before they load, then revealing them only after campaign variation changes are properly applied.
Q8. How do I justify CRO tool spend to leadership?
You can justify CRO tool spend by focusing on revenue impact rather than features. CRO tools improve conversion rates from existing traffic, generating more value without increasing acquisition spend. Estimating the potential revenue impact based on your current conversion rate and average order value places the cost of the tool in a clear business context that leadership can evaluate.
I'm a branding enthusiast, marketer, and B2B content professional with over 20 years of experience. I'm also a certified native advertising expert and trained in strategic thinking. Author of 'Managing Modern Brands: Cult Theory and Psychology', and three other books in diverse genres. I generally write on marketing trends, optimization, brand strategy, consumer psychology, CRO, cult theory, data, personalization, and content strategy. With a strong expertise in building and leading teams and cross-functional collaboration, I have driven demand through content creation, data, digital media, content marketing, and technology.
Uncover hidden visitor insights to improve their website journey
Share
Get new content on mail
Thank you.
You are now subscribed to our blog.
Deliver great experiences. Grow faster, starting today.
One of our representatives will get in touch with you shortly.
Awesome! Your meeting is confirmed for at
Thank you, for sharing your details.
-
, you're all set to experience the VWO demo.
I can't wait to meet you on at
Account Executive
, thank you for sharing the details. Your dedicated VWO representative, will be in touch shortly to set up a time for this demo.
We're satisfied and glad we picked VWO. We're getting the ROI from our experiments.
Christoffer Kjellberg
CRO Manager
VWO has been so helpful in our optimization efforts. Testing opportunities are endless and it has allowed us to easily identify, set up, and run multiple tests at a time.
Elizabeth Levitan
Digital Optimization Specialist
As the project manager for our experimentation process, I love how the functionality of VWO allows us to get up and going quickly but also gives us the flexibility to be more complex with our testing.
Tara Rowe
Marketing Technology Manager
You don't need a website development background to make VWO work for you. The VWO support team is amazing
Elizabeth Romanski
Consumer Marketing & Analytics Manager
Trusted by thousands of leading brands
Awesome! Your meeting is confirmed for at
Thank you, for sharing your details.
Your Roadmap to Better Results
1:1 Demo customized to your industry and optimization goals.
Feature deep-dive into the user behaviour tools you need most.
No-pressure advice on the best path forward for your team.