
Follow us and stay on top of everything CRO
Read summarized version with
Some businesses dive into conversion rate optimization with gusto only to give up after a few months, hoping for immediate returns on their time and money spent.
They claim to have tweaked and tested everything under the sun, yet see no uplift in conversions or revenue.
Remember that conversion optimization requires strategic effort and considerable patience to yield a substantial ROI in the long run.
Every brand, big or small, can unlock the power of CRO, but it’s not as simple as just tweaking the color of your CTA button. It’s about knowing why you test, how you plan to execute, what makes you confident it will work, and what your plan is if it doesn’t. A robust CRO process will require you to find answers to these questions, among many others.
In this blog, we tell you the key steps you need to follow to extract valuable results and learnings from your CRO program.

Step 1: Do your research right
The first stage in the conversion rate optimization process involves research. To kick off your research stage, first dive into the numbers. Leverage quantitative analytics tools like Google Analytics 4 to assess how your website metrics are performing. Some metrics to look at are:
- Conversion rate
- Bounce rate
- Pageviews
- Average session duration
- Average page load time
- Ratio of new to returning visitors
Are you seeing a spike in bounce rates? Is the conversion rate taking a dip? What’s the average time users spend on your site? These quantitative insights serve as your research starting point. For instance, spotting a drop in the conversion rate on product pages may prompt you to further investigate the problem.
But to unravel the ‘why’ behind these numbers, you must delve into qualitative data for user research. Heatmaps visually showcase user interactions—clicks, scrolls, and pauses—while session recordings help you track individual visitor journeys.
These visual cues highlight pain points and elements that grab visitors’ attention. Additionally, you can gather customer feedback through surveys to get insights straight from the source.

For example, if a heatmap reveals site visitors are not clicking the add-to-cart button, and recordings show them returning to the homepage without exploring any further, it indicates a hurdle in their buying journey. In this case, behavior analysis goes beyond the numbers, allowing you to get to the root of the problem.
Hence, quantitative and qualitative data give you a complete grasp of how visitors interact with your website, shaping your optimization strategy.
VWO just made things easier! Check out the new Insights Dashboard where you can see the overall engagement score of your website along with page-level analysis, heatmaps, and session recordings. With actionable insights at your fingertips, you don’t have to sift through hundreds of heatmaps or recordings anymore. This way, you save time and focus on strategizing other important activities.
Read what CRO expert Rich Page suggests to do to get more A/B testing ideas from conversion research.
Step 2: Form a clear hypothesis
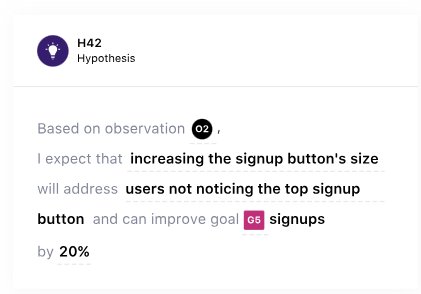
Once you’ve pinpointed the areas where your website needs improvement, the next step is to form a hypothesis. Using a simple template can bring clarity. Ask yourself: What specific change will I make, and how will it result in a particular outcome for a specific reason?
For instance, adding customer testimonials can increase conversions, as social proof provides site visitors with reassurance that others like them have made successful purchases. This approach ensures the actionable, goal, and rationale are crystal clear.
Based on your hypotheses, you now collaborate with the design and development team to decide the best execution strategy.
Typically, there are two main ways to run a CRO test – test a completely different page or change one or a few page elements on the same page. Choose the one that’s most appropriate and take a leap.
Test a completely different web page
If you’ve identified several areas that could be improved, consider creating a new page that incorporates all the desired changes. It allows you to explore innovative ideas and design elements that may not have been considered in the existing version due to limited scope. Remember, you may see similar or drastically different results because you’re designing a new page here. So, be prepared for a range of outcomes. Moreover, creating an entirely new webpage may require significant resources in terms of effort and time. This can be a drawback in situations with limited resources.
Change one or a few page elements
This is where A/B testing and Multivariate testing serves handy. Identify one or a few problems on your page, which (based on research, of course) may be the main areas of pain. Find their best possible variations, and run a test.
And if you ever hit a creativity block and can’t figure out what testing idea to come up with, you can get AI-generated testing ideas based on your goals in VWO. A simple URL scan is all it takes to show relevant testing ideas backed by scientific principles, along with hypotheses and actionable.
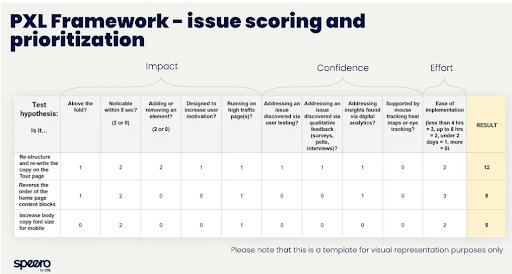
Step 3: Prioritize hypotheses for testing
Let’s say a CRO audit has shown several areas of improvement in your website. As such, you have several hypotheses to test. How do you prioritize what to test first? Here are some factors that will help guide your decision.
Ease of implementation
Think about how easy or difficult it is to implement the change. Some hypotheses may promise a massive impact but pulling off such tests are up for debate and discussion because they involve risks and resource allocation. Starting with simple changes can bring quick success and build momentum. For example, changing the color or copy of the button is easier than redesigning the entire website which involves a lot of risks too.
If redesigning your website is the only choice you’ve got, watch this webinar before you proceed in this journey.

Resource availability
See if your team has the skills and bandwidth for the proposed changes. Do they have to wait on the dev team to implement the first test set? Prioritize ideas that match your team’s capability and keep aside tests that need the active involvement of the tech people. This way you can start with small tests and keep moving visitors down the conversion funnel.
Align with business goals
Sometimes, small tests may only enhance micro-conversion metrics without significantly impacting overall business goals. But they tell you about visitor behavior and provide an idea of how likely they are to take actions that can contribute to overarching business goals, such as an increase in purchases.
For example, changing the colors might not make a big difference unless you’re doing a major rebranding. To optimize your efforts, consider dividing your tests into two sets: one focusing on micro conversions and another on macro business goals.
Address visitors’ feedback
Consider what users are saying and where they might be struggling on your site. Prioritize changes that address common pain points. For example, if users often complain about a confusing checkout process, shooting down conversion rates, focus on hypotheses that simplify and clarify those steps before anything else.
If you’re still undecided, you can follow the P.I.E. framework to take your testing plan in the right direction.
Watch Ana Catarina from Dell Technologies take you through the comprehensive process of hypothesis prioritization in the webinar below:

No matter how many hypotheses you’ve formulated, keep track of them all using VWO Plan, the built-in project management tool that simplifies prioritization and makes team collaboration super convenient for you.
Step 4: Decide what test to conduct
Not all tests are created equal, and in the world of CRO, it’s not just about A/B testing. There are two more conversion rate optimization methods in the game.
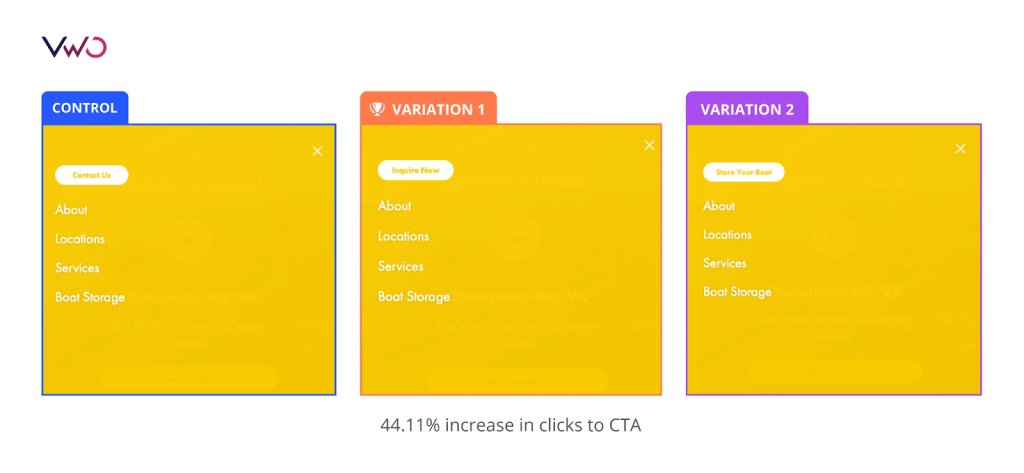
A/B tests: Great for comparing two variations of the same element on the same page, like tweaking a CTA, headline, image, and so on.
Morningstar, a real estate company, sought to enhance the number of inquiries generated through the form on its mobile website. The hypothesis was that modifying the CTA copy would positively influence clicks and subsequently lead to an increase in form submissions. They executed an A/B test with two different variations of the copy. This minor adjustment resulted in a 44.11% increase in clicks on the CTA.
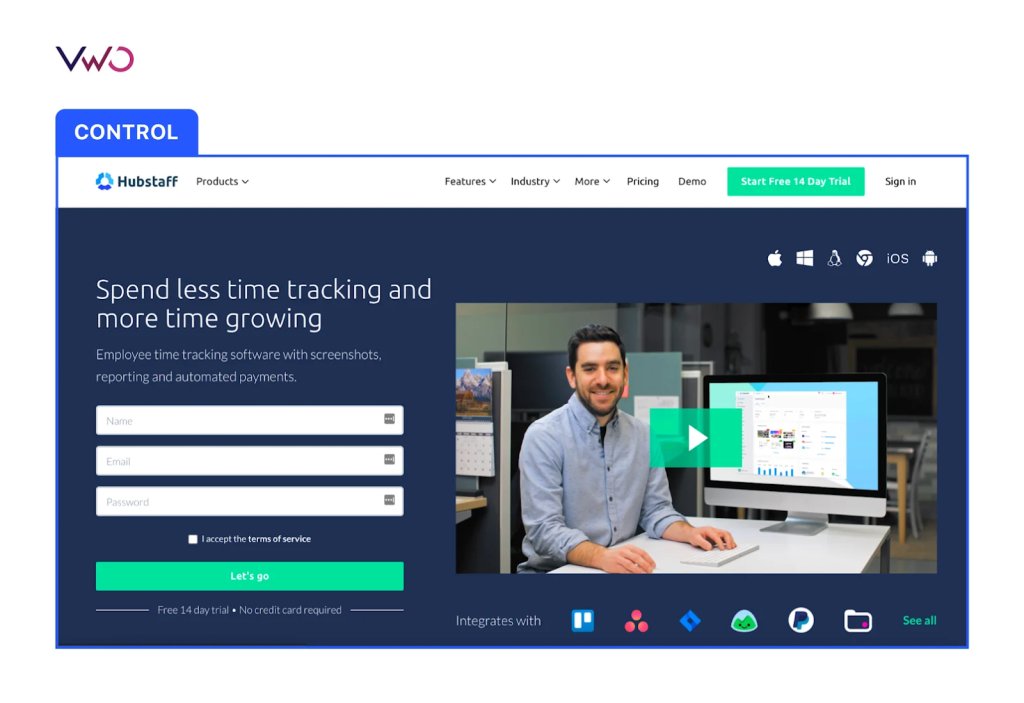
Split URL tests: Handy when you want to test two different pages with different URLs.
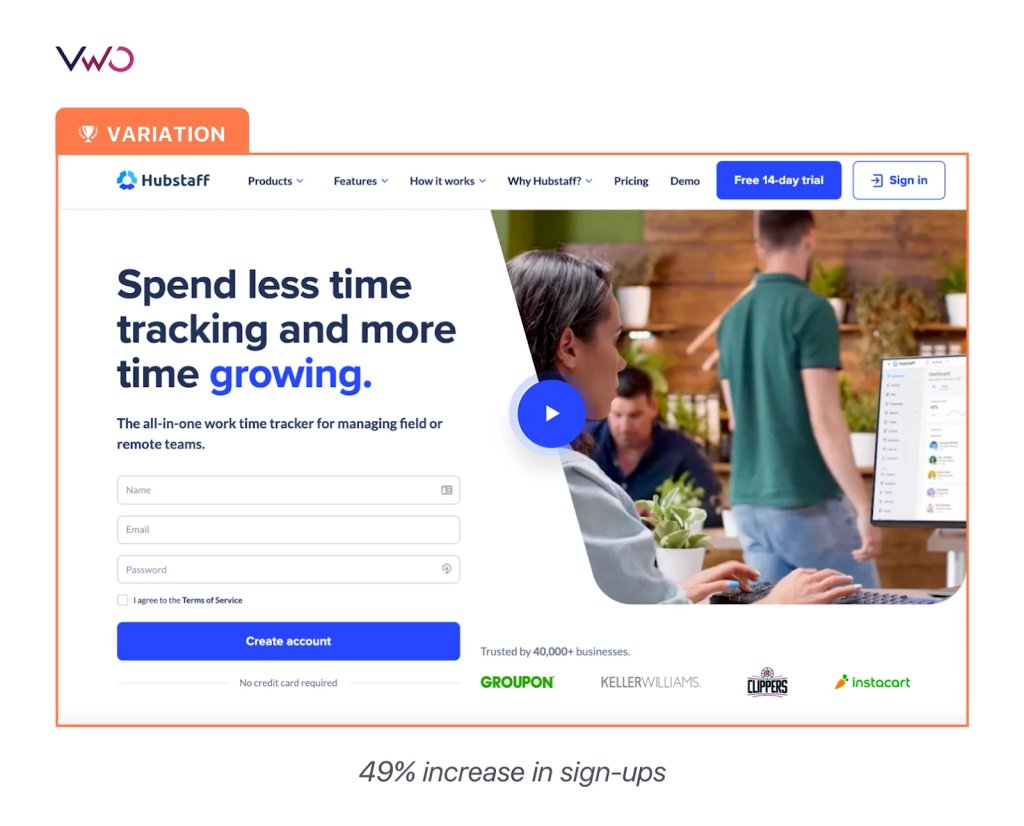
Take Hubstaff for example. The team would make small changes on their homepage. But this time around, they wanted to revamp their homepage design, showcasing the latest features and offerings. So, they went for a split test URL to pit the redesigned page against the control. Read how they strategized, leading them to a 49% increase in visitor-to-trial conversion.
Multivariate tests: The right choice when you’re mixing and matching various elements on a single page.
A case on point is Hyundai (Netherlands). The company wanted to increase brochure requests, test drive inquiries, click-throughs from the landing pages of car models, and measure engagement levels.
Traffic4U, a digital marketing agency, conducted multivariate tests on Hyundai.nl‘s car-specific landing pages, analyzing various components like headlines, visuals, descriptions, and testimonials. The goal was to understand how changes in different elements influenced website visitors’ choices to request a test drive or download a brochure. Read the full case study to know how they increased the click-through rate by 208%.


How long do you need to run an A/B test for dependable results?
As you approach the final conversion rate optimization steps, it’s time to decide for how long you want to run a test. Website visitors are constantly included in the test, and the numbers keep changing. This further means that your conversion rate would constantly rise, dip, and even stagnate at different times throughout the testing phase.
As statistical significance is displayed throughout the test, it can further showcase higher significance even before the test completes its intended duration. So, depending on when you decide to check the results of your test, its statistical significance could be high or low. This further paves the way to the problem of “peeking.”
Peeking error
The peeking error involves examining test results before they complete their course. You might discover unexpected statistical significance and decide to prematurely stop the test, potentially deploying a version that negatively impacts conversion rates. In fact, peeking can lead to a type 1 error in your A/B test.
In a type 1 error, your A/B test may appear successful, showing a temporary impact of the variation on the goals. But this effect is fleeting and won’t persist when you deploy the winning variation and observe its impact over time.
It occurs when you prematurely conclude your test before reaching statistical significance by abruptly rejecting the null hypothesis and embracing the winning variation.
To make sure we don’t make mistakes in our data analysis, it’s a good idea to have a plan before we start and stick to it. This helps us avoid the temptation of looking at the data in a way that might give us the result we want. Following a plan keeps our analysis accurate and reduces the chance of making errors like Type 1 errors. Read more about common types of errors in testing in our blog.
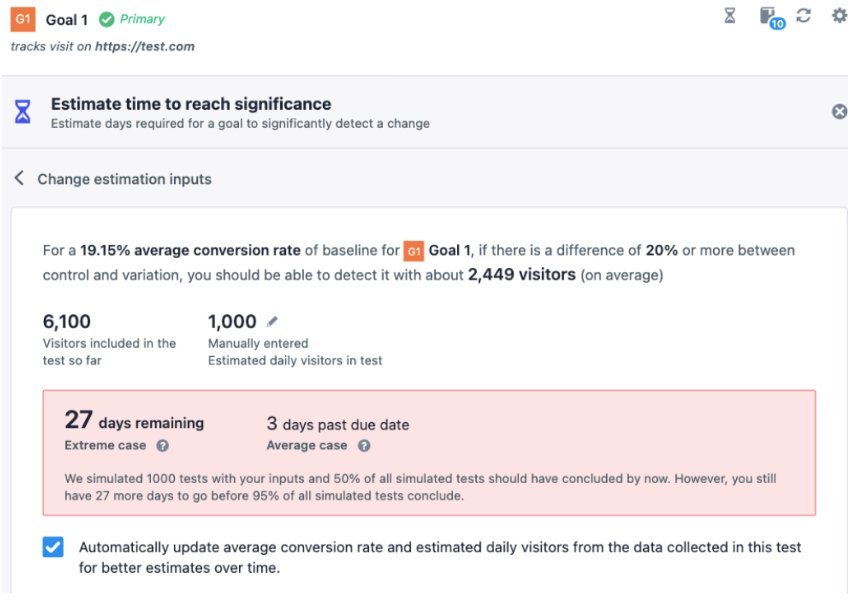
Therefore, defining test duration is essential before declaring a winner/loser post-completion. You can use VWO’s free test duration calculator to find an ideal period for which you must run a test.
Here’s a neat tip: If your reporting system uses a Bayesian statistical engine, much like VWO SmartStats, you don’t have to stress about maintaining a minimum sample size. Learn what makes Bayesian a more powerful reasoning model than its traditional counterpart.
What is statistical significance and why is it critical?
One of the primary reasons to run a test is to understand if a particular change on our site can help yield better conversion rates. For instance, you’ve decided to run a test on the first 100 visitors visiting your site. You see that 40 of the 100 visitors converted on the variation you’ve run against 20 on the original page. That’s a 20% conversion rate as compared to a paltry 10% on the original page.
But does this mean you’ll get a guaranteed 20% conversion rate, consistently? Probably not, because these 100 visitors may not be a good representation of the 10,000 visitors that pay a visit to your site every day. Here, statistical significance comes into play!
Considering another example, you’ve run a test whose results showcase that your implemented variation has outperformed the control (original version) with 93% statistical significance. This means that there are 7% chance that your variation outperformed purely by accident.
The statistical significance of 93% states that it’s the right time to stop the test, provided you’ve run the experiment long enough to derive conclusions.
Step 5: Leverage learnings from the results
The main concept behind conversion optimization involves drawing final conclusions from your tests, closing the loop of experimentation, and taking note of all the new information gathered for future testing. Unfortunately, most optimizers only look at the test results to see whether a variation was a winning one or if it has failed. If it fails, they often go back to creating more new hypotheses. However, as an optimizer, it is important to dig deeper.
Considering a testing scenario, there are two possible outcomes of a test you’ve recently run.
When your variation has won the test
Your efforts have paid off well. But, what next? It’s time to seek answers to the following questions.
- What is the cost of deploying the change(s) in terms of engineering hours, design hours, and so forth?
- Is the expected increase in the revenue doing justice to the actual cost involved?
- Are there any particular segments that performed better than the rest and show the way for personalizing experiences?
When your variation has lost the test
Remember, in testing, there are no losers – only opportunities to learn! Channel your inner scientist, focusing on the insights gained from each test. Implement the learnings in subsequent iterations and continually refine hypotheses to discover what works and what can work better to accomplish your goals. Make sure you:
- Analyze your research, check your hypothesis, and look for loopholes.
- Study your test data and segregate it further to examine the insights.
- Validate your research data with all the conversion rate optimization tools used.
- Go through all the relevant case studies. They could help you come across new perspectives that you’d missed before.
- Reconstruct your hypothesis by accommodating new insights that you’d missed in your initial research.
- Go back and test again.
Watch this webinar to learn how to navigate failed A/B tests and use the learnings to your advantage.
Way forward
Keep in mind that all the steps of conversion rate optimization are like crucial puzzle pieces; leave one out, and the picture isn’t complete. And if you’re convinced that VWO can elevate your CRO program, take a free trial and discover all it has in store for you.


