

A/B testing involves randomly splitting incoming traffic on your website between multiple variations of a particular webpage to gauge which one positively impacts your critical metrics. Pretty straightforward, right? Well, not so much. While A/B testing might sound simple, the science and math behind its operation and the computation of the results can get quite tricky.
Statistics is the cornerstone of A/B testing, and calculating probabilities is the basis of statistics. Therefore, you can never be 100% sure of the accuracy of the results you receive or reduce risk to 0%. Instead, you can only increase the possibility of the test result being true. But as test owners, you should not need to bother about this as your tool should take care of this.
Download Free: A/B Testing Guide
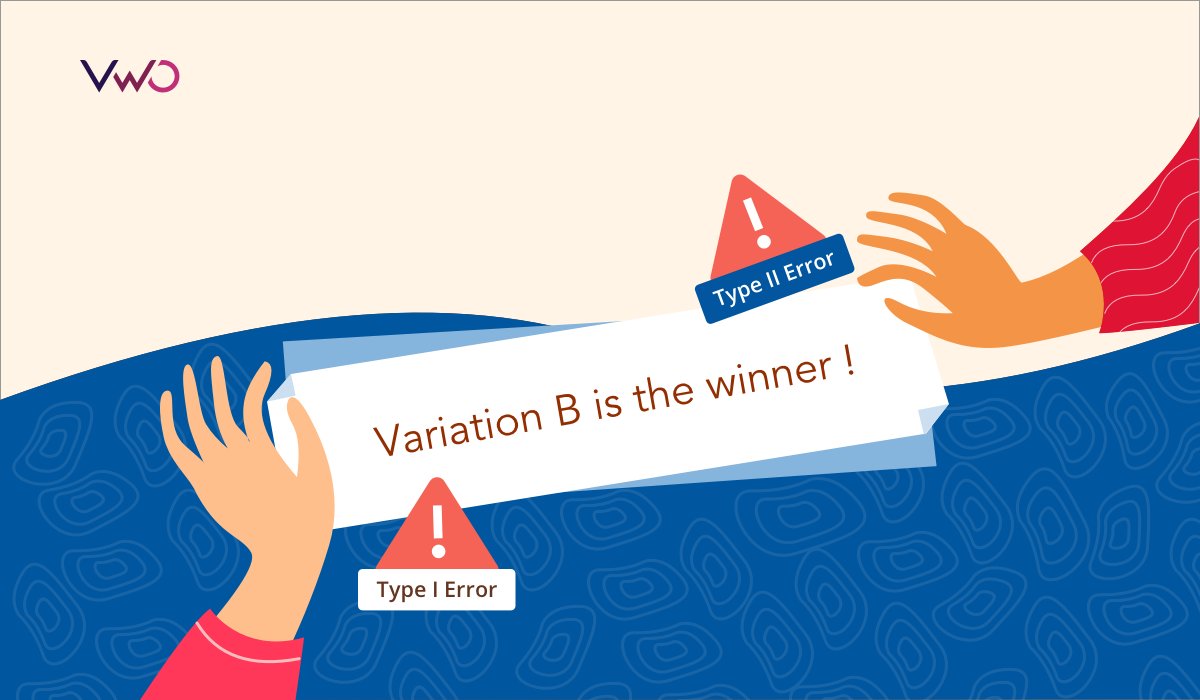
Even after following all the essential steps, your test result reports might get skewed by errors that unknowingly creep into the process. Popularly known as Type 1 and Type 2 errors, these essentially lead to an incorrect conclusion of tests and/or erroneous declaration of winner and loser. This causes misinterpretation of test result reports, which ultimately misleads your entire optimization program and could cost you conversions and even revenue.
Let’s take a closer look at what exactly do we mean by Type 1 and Type 2 errors, their consequences, and how you can avoid them.
What are some of the errors that creep into your A/B test results?
What is a type 1 error?
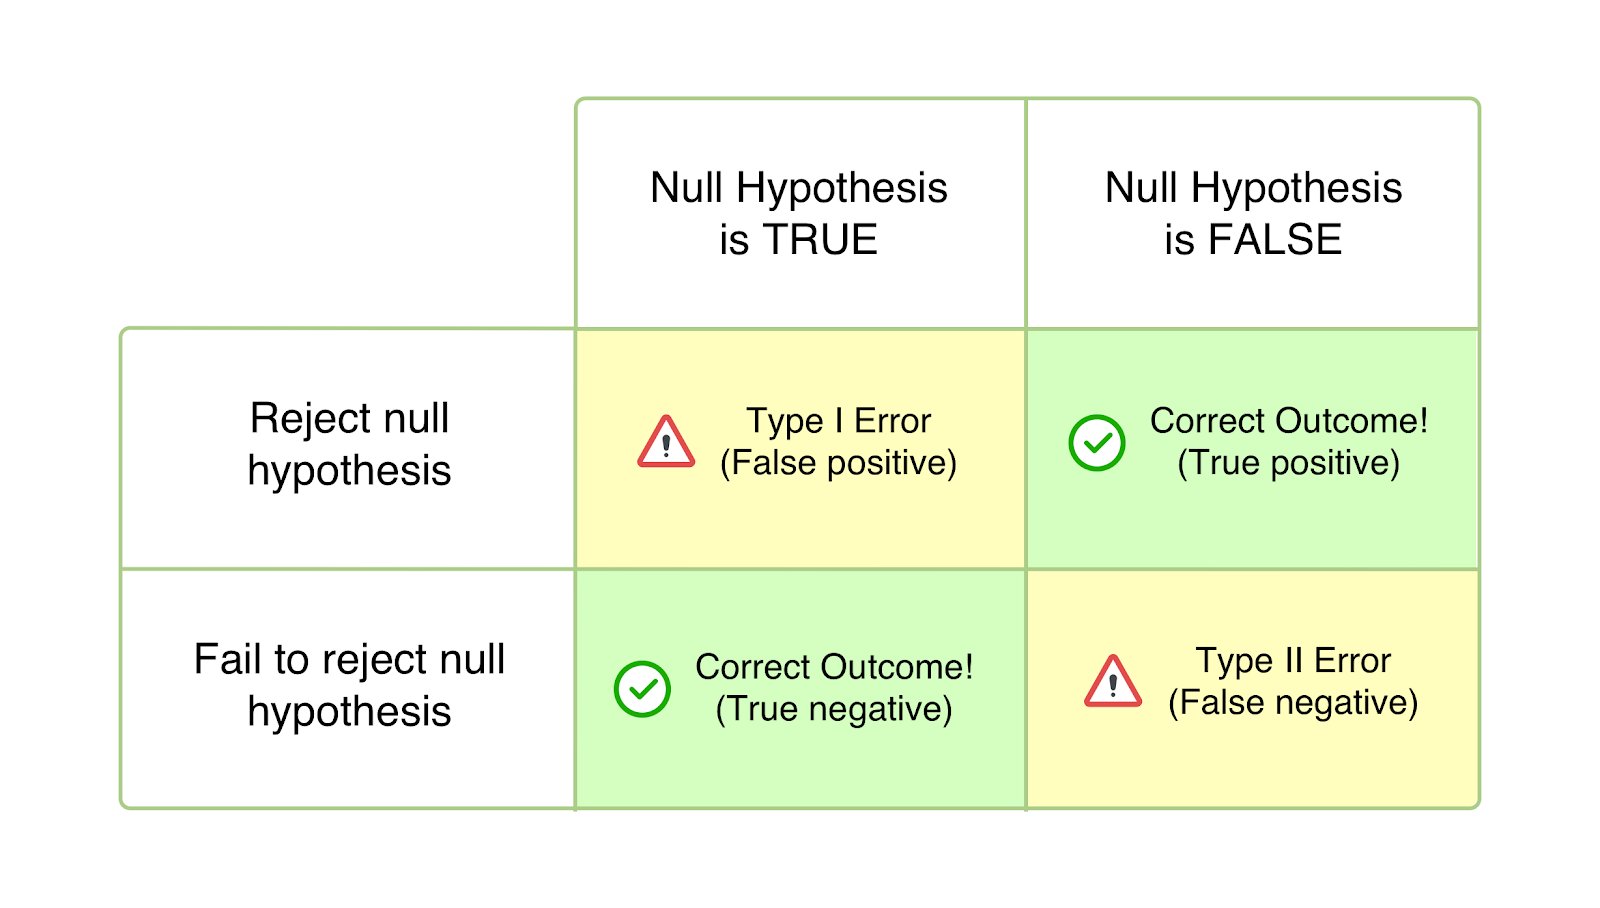
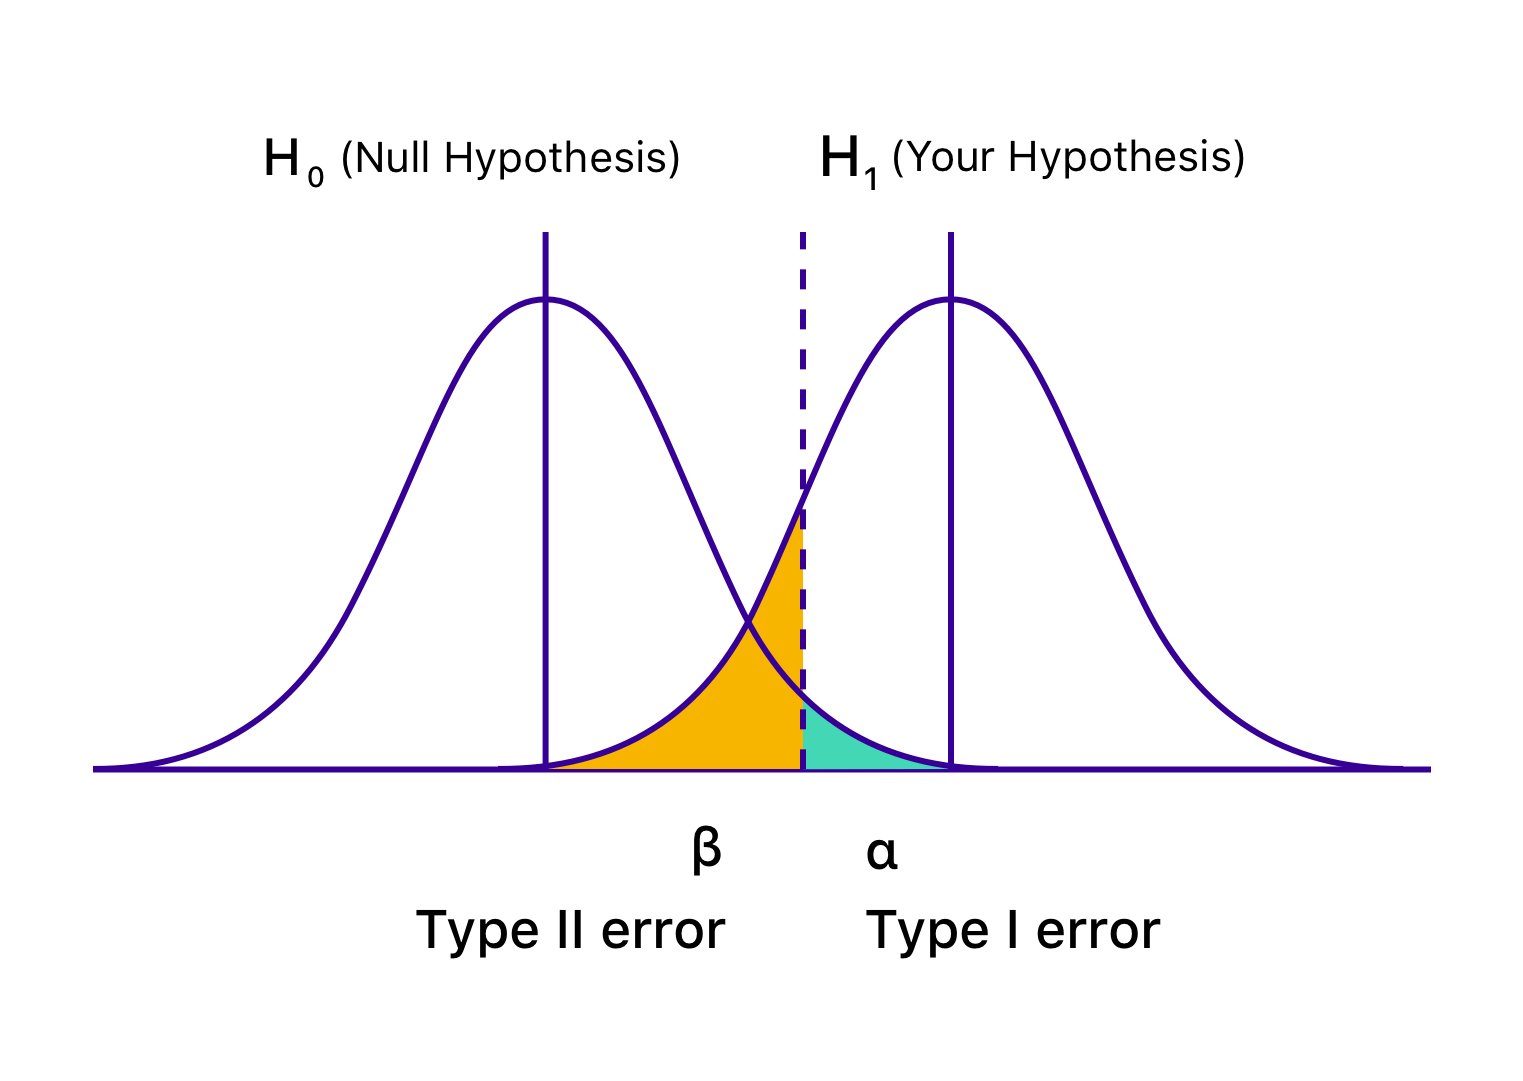
Also known as Alpha (α) errors or false positive, in the case of Type 1 error, your test seems to be succeeding, and your variation seems to cause an impact (better or worse) on the goals defined for the test. However, the uplift or drop in this hypothesis testing is only temporary and is not going to last once you deploy the winning version universally and measure its impact over a significant period. It happens when you conclude your test before reaching statistical significance or the pre-decided criteria and rush into rejecting your null hypothesis and accepting the winning variation.
The null hypothesis states that the said change will have no impact on the given metric/goal. And in the case of Type 1 errors, the null hypothesis is true but rejected because of the untimely conclusion of tests or miscalculation of the criteria for the conclusion.
What is the probability of type 1 error?
The probability of making a Type 1 error is denoted by ‘α’ and correlated to the confidence level, where you decide to conclude your test. This means that if you conclude your test at a 95% confidence level, you accept that there is a 5% probability of getting the wrong result. In the same way, if that confidence level is 99%, the probability of the test result being wrong is 1%. You could call it sheer bad luck, but if you run into an α error even after concluding your test at a 95% confidence level, it means that an event with merely 5% probability has occurred.
Type 1 error example
Let’s assume, you devise a hypothesis that shifting your landing page CTA to above the fold will lead to an increase in the number of sign-ups. The null hypothesis here is that there would be no impact of changing the placement of the CTA on the number of sign-ups received.
Once the test commences, you get tempted to peek into the results and notice a whopping 45% uplift in sign-ups generated by the variation within a week. You are convinced that the contrast is considerably better and end up concluding the test, rejecting the null hypothesis, and deploying the variation universally—only to notice that it no longer has a similar impact but instead has no impact at all. The only explanation is that your test result report has been skewed by the Type 1 error.
The impact of type 1 errors
Type 1 error happens because you didn’t take into account the duration or the sample size for a hypothesis testing. The type 1 error brings in a false positive and you think your test has yielded results even though it hasn’t. The impact of this percolates into your business bottom line and dampens it. Implementing the wrong experience could result in decreased conversions, loss of potential customers, and of courses wasted resources on implementing ineffective changes.
How to avoid type 1 errors
While you cannot completely do away with the possibility of running into a Type 1 error, you can certainly reduce it. For that, make sure you conclude your tests only once they’ve reached a high enough confidence level. A 95% confidence level is considered ideal, and that is what you must aim to achieve. Even after reaching a 95% confidence level, your test results might get altered by the Type 1 error (as discussed above).
Therefore, you also need to ensure that you run your tests for long enough to guarantee that a good sample size has been tested upon, thereby increasing the credibility of your test results.
You can use VWO’s A/B testing duration calculator to determine the ideal period for which you must run a particular test. Similarly, you can also calculate your A/B testing sample size to ensure you conclude tests only when you have the lowest chance of ending up with adulterated results.
VWO’s Bayesian model-powered statistics engine, SmartStats, helps you reduce the probability of encountering a Type 1 error.
What is a type 2 error?
Also known as Beta (β) errors or false negatives, in the case of Type 2 errors, a particular statistical test seems to be inconclusive or unsuccessful, with the null hypothesis appearing to be true. In reality, the variation impacts the desired goal, but the results fail to show, and the evidence favors the null hypothesis. This is how type 2 errors occur, as you end up (incorrectly) accepting the null hypothesis and rejecting your hypothesis and variation.
Type 2 errors usually lead to the abandonment and discouragement of statistical tests but, in worst cases, lack of motivation to pursue the CRO roadmap as one tends to disregard the efforts, assuming it to have made no impact.
What is the probability of type 2 error?
‘β’ denotes the probability of making a Type 2 error. The probability of not running into a Type 2 error is denoted by 1 – β, dependent on the power of the statistical test. The higher the statistical power of your test, the lower the likelihood of encountering Type 2 error (false negative). If you are running a test at 90% statistical power, there is merely a 10% chance that you might end up with a false negative.
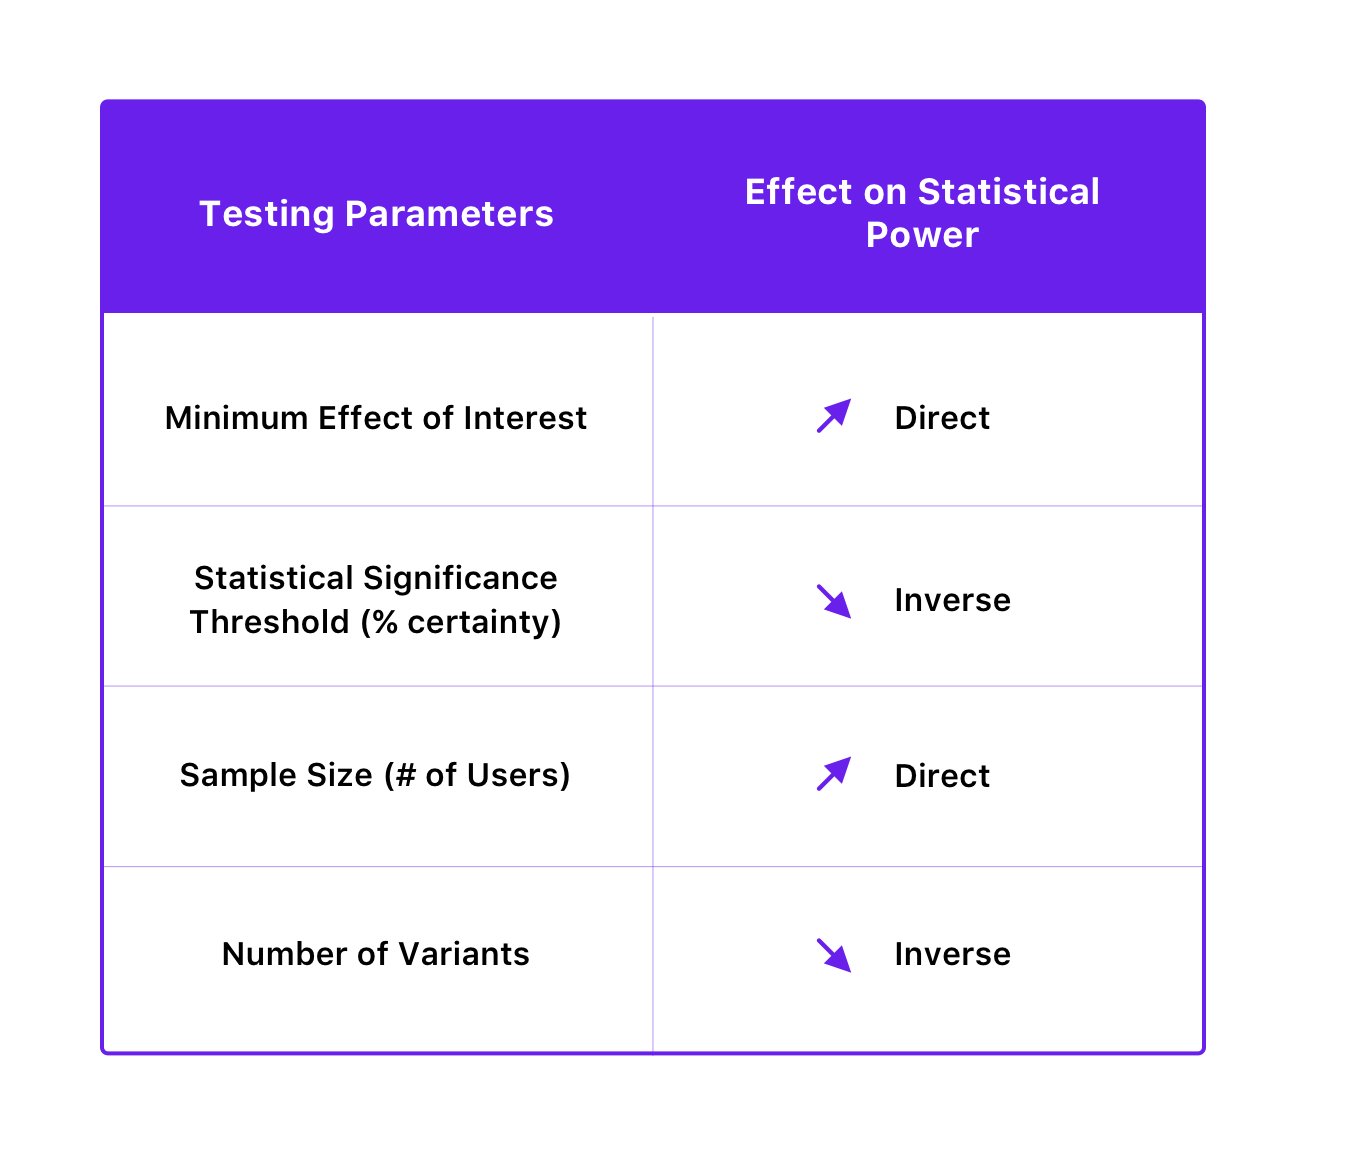
The statistical power of a test is dependent on the statistical significance threshold, sample size, the minimum effect size of interest, and even the number of variations of the test.
Here’s how they are related:
Type 2 error example
Let’s assume that you hypothesize that adding security badges on your payment page would help you decrease the percentage of drop-offs at that stage. You create a variation of the payment page with the security badges and run your test, only to peek at the results 10 days after its commencement. Upon noticing no change in the number of conversions or drop-offs, you decide to conclude the test and declare the null hypothesis to be true.
Not convinced by the test results, you decide to rerun the test—only this time you let it run for longer. Consequently, you notice a significant improvement in your conversion goal this time around. What happened the first time was that you had encountered the Type 2 error by concluding the test before the required time.
The impact of type 2 errors
Similar to Type 1 errors, Type 2 errors can lead to reduced conversions and lost sales opportunities. But the impact of Type 2 errors or false negative goes beyond just lost revenue. It directly affects the efficacy of your conversion program. Having confidence in your hypotheses (provided they are based on user behavior analyses) is crucial to run a test that shows the right impact by reaching statistical significance. By prematurely stopping tests and declaring false negatives, you miss the opportunity to prove your hypothesis and your credibility in running a dedicated CRO program.
How to avoid type 2 errors
By improving the statistical power of your tests, you can avoid Type 2 errors. You can do this by increasing your sample size and decreasing the number of variants. Interestingly, improving the statistical power to reduce the probability of false negative can also be achieved by decreasing the statistical significance threshold, but, in turn, it increases the probability of Type 1 errors. However, since reducing the probability of Type 1 errors usually takes precedence over avoiding Type 2 errors (as its consequences can be more severe), it is advisable to not interfere with the statistical significance level for the sake of improving power.
Type 1 error vs Type 2 error – Which is worse?
Frankly, both type 1 and type 2 errors can be considered worse depending on a specific context. But while type 2 errors lead to missed opportunities to follow your hypothesis and innovate, Type 1 is worse in terms of its negative impact on user experience and the resources you spent to pull off this test. In type 1 errors, you overlook other variants that could be better and implement the one that shows a positive impact on conversion for the time being.
Can you guess why type 2 errors are still less dangerous? This is because you continue using the version that has shown at least some level of success in impacting user experience over time. While missed opportunities may occur, the potential negative impact is generally lower compared to the risks associated with implementing changes based on false positive conclusions.
Download Free: A/B Testing Guide
How to calculate type 1 or type 2 error?
In the case of hypothesis testing, type 1 and type 2 errors can be seen as more like hyper-parameters that influence the testing methodology but they are not calculated individually in a standalone manner.
The significance level (α) is set to control the probability of Type 1 error. This value is determined based on the desired level of confidence and tolerance for false positives. Similarly, the power (β) is set to control the probability of Type 2 error. This value is determined based on the desired level of confidence and tolerance for False Negatives(declaring true effects as no effects). Type 1 error and Type 2 error together are primarily used for sample size calculations.
Therefore, these errors act as facilitators in calculations of statistical significance of test results rather than outputs to be directly calculated.
VWO SmartStats – the smarter, Bayesian way to business decision-making
Ideally, as a test owner, statistics is not something you should focus on since your quest is not to find the truth with your experiments—your motive is to make a better business decision that generates higher revenue for you. So, the important thing is to work with a tool that helps you make a better, smarter choice—without you having to get into the details of statistics.
As per the Frequentist model of inferential statistics, the conclusion of a test is entirely dependent on reaching statistical significance. If you end a test before it reaches statistical significance, you are likely to end up with a false positive (Type 1 error).
VWO’s Bayesian model-powered statistics engine, SmartStats, calculates the probability that this variation will beat the control as well as the potential loss that you might incur upon deploying it. VWO shows you the possible loss associated with deploying the variation so you can make an informed choice.
This potential loss also helps to decide when to conclude a particular test. After the conclusion of the test, the variation is declared the winner only if the potential loss of the variation is below a certain threshold. This threshold is determined by taking into account the conversion rate of the control version, the number of visitors that were a part of the test, and a constant value.
Not only does VWO SmartStats reduce your testing time by 50%—as you do not rely on reaching a set time and sample size to conclude your test—but, also gives you more control over your experiments. It gives you a clear probability which helps you make decisions based on the type of test you are running. For instance, if you are testing a low impact change such as changing button color, maybe a 90% probability is good enough to call a variation a winner.
Or, if you are testing something at the last step of the funnel, you may want to wait until 99% probability. You’re, then, in a position to increase your testing velocity by concluding low impact tests quicker and prioritizing high impact ones in your roadmap.
A Frequentist-based statistics model will only give you the probability of seeing a difference in variations by assuming that it is an A/A test. This approach, however, assumes that you are doing the test computation only after you have obtained sufficient sample size. VWO SmartStats doesn’t make any assumptions, instead empowers you to make smarter business decisions by reducing the probability of running into Type 1 and Type 2 errors. This is because it estimates the probability of the variation beating the control, by how much, along with the associated potential loss associated, allowing you to continuously monitor these metrics while the test is running.
Also, check out our insightful discussion with Stuart Scott, President of EMEA at Mammoth Growth, where he shares how you can stop wasting time and money on bad A/B tests.
Rely on VWO’s sophisticated reporting and accurate results
Since aiming for absolute certainty is extremely difficult with statistics, you cannot eliminate the possibility of your test results not being skewed due to an error. However, by choosing a robust tool like VWO, you can lower your chances of making errors or reduce the risk associated with these errors to an acceptable level. To understand more about how exactly VWO can keep you from falling prey to such errors, try out VWO’s free trial or request a demo by one of our optimization experts.

Frequently Asked Questions
Type 1 error is the probability of rejecting the null hypothesis when it is true, usually determined by the chosen significance level. Type 2 error is the probability of failing to reject the null hypothesis when it is false and is influenced by factors like statistical power and effect size. These errors facilitate the overall calculations of test results but are not individually calculated in hypothesis testing.
To reduce Type 1 errors, which mean falsely rejecting the null hypothesis, it is crucial to choose an appropriate significance level and stick to it. Being cautious when interpreting results and considering the practical significance of findings can also help mitigate Type 1 errors. To decrease Type 2 error risk, which means you have failed to reject the null hypothesis when it is false, increasing the sample size can enhance the statistical significance. Further, designing a test (backed by a strong hypothesis) that can actually identify meaningful differences can decrease Type 2 errors.
Type 1 error occurs when you reject the null hypothesis by mistake when it is actually true. In this case of hypothesis testing, you might conclude a significance between the control and variation when there is not one. Type 2 error occurs when you fail to reject the null hypothesis when it is false. This means you overlook a considerable difference that exists. By examining the statistical significance, confidence intervals, and sample size, you can identify if these errors have occurred in your test result.
Categories:


