
What is a dynamic heatmap?
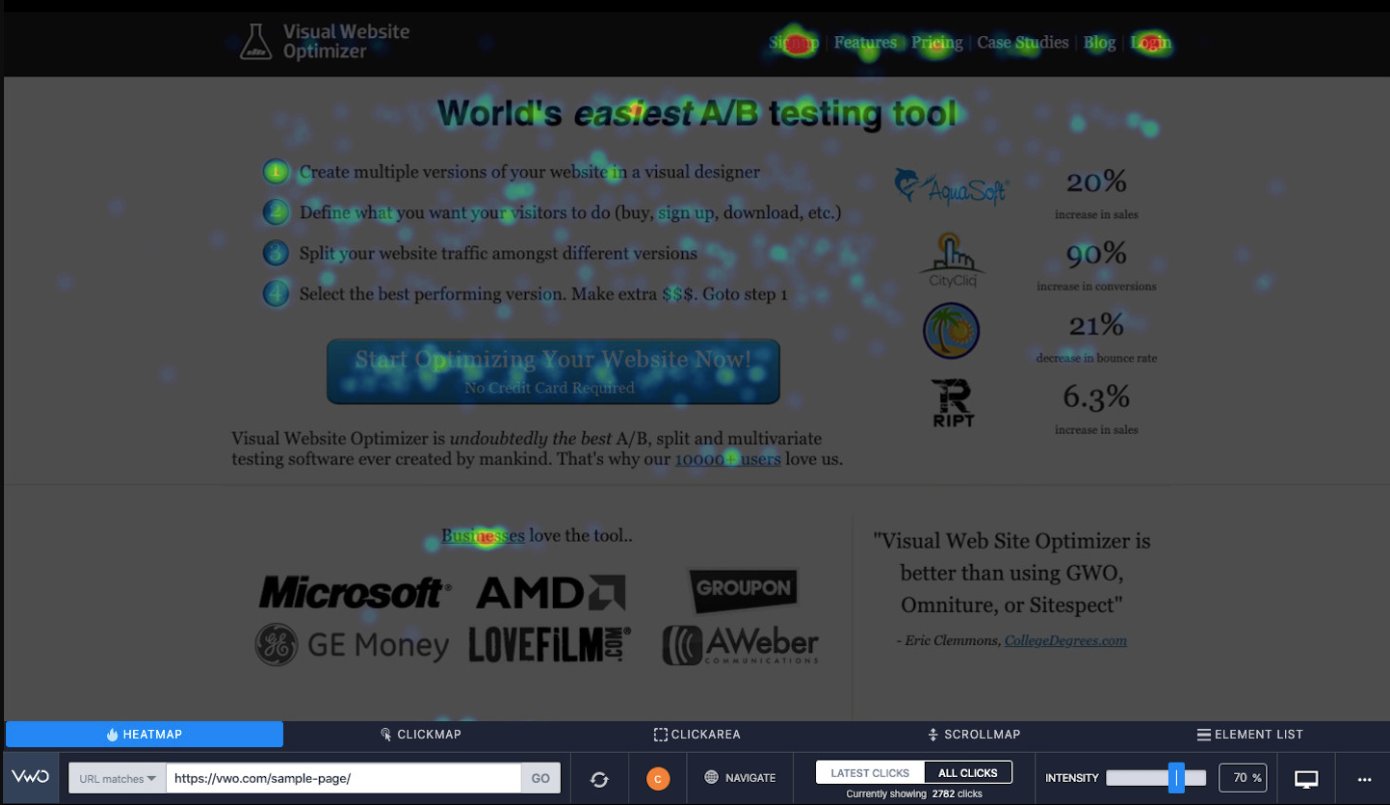
The dynamic heatmap is a behavior analytics tool to collect relevant customer interaction data on digital properties. The dynamic heatmap works on the live website and maps user behavior on intuitive elements like menu bars. The data is collected in the form of URL, HTML, CSS, JS, element positions (X-Y Coordinates, relative distance from nearby elements), devices, locations, timestamps, etc.
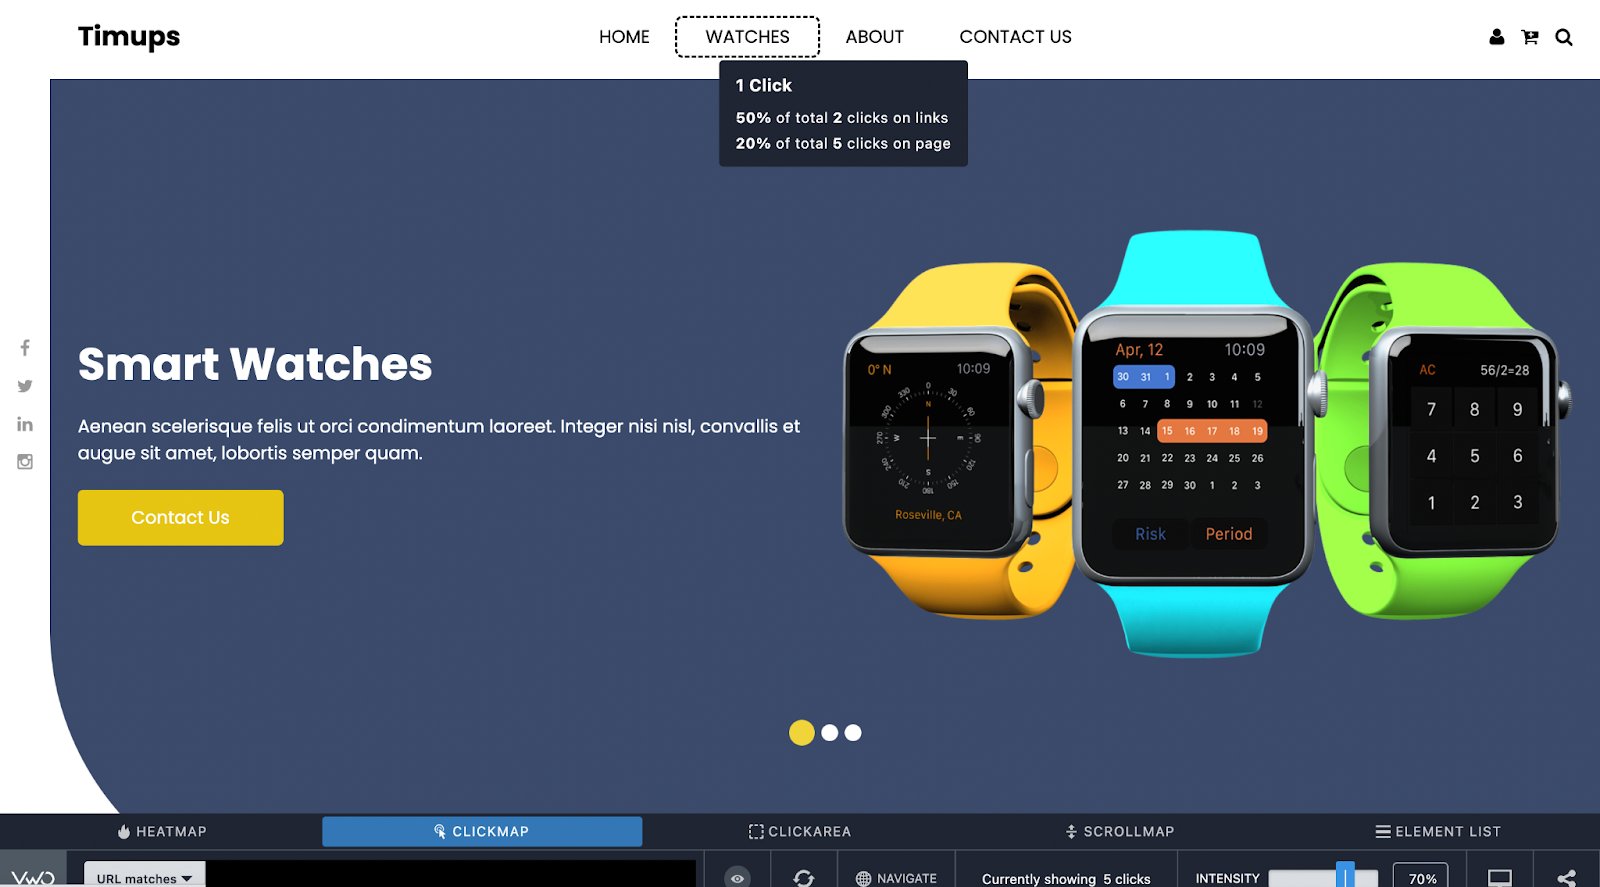
Here is how a dynamic heatmap looks:
Difference between static and dynamic heatmaps
Dynamic heatmaps widen the scope of customer behavior analysis compared to static heatmaps. Here is how the static and dynamic heatmaps differ from each other:
| Evaluation parameter | Static heatmap | Dynamic heatmap |
| Type of webpage | Static heatmap works best for analysis of static pages like the about us page, blog post, contact page, and home page that don’t have any dynamic and intuitive elements. | Dynamic heatmap allows analysis of all kinds of pages, including static pages. Pages with dropdown menus and intuitive elements that change as per user command are analyzed. |
| Best for website types | A simple website like a blog or landing page with no intuitive elements. | A complex website like eCommerce, SaaS platform, or ed-tech platform with behind login pages like a profile page, and order page. |
| Way of working | Overlays heatmap over webpage screenshot. | Heatmap is overlaid on an interactive website. The heatmap updates dynamically as per the interaction like clicking the menu bar. |
Scope for dynamic heatmaps
Dynamic heatmap gives you valuable information about customer behavior, which becomes the foundation of the optimization campaign. Here are some ways dynamic heatmaps are utilized for optimization.
Studying dynamic pages like order and cart pages
It’s frustrating to see customers abandoning carts, as they are highly qualified leads. Studying the cart page heatmaps can give crucial information about customer behavior.
The insights from the dynamic heatmap give an idea about the performance of the intuitive elements and how customers perceived them. Similarly, the analysis of the order page gives an insight into the correct information transfer to the end user.
Understand user interaction with pop-up elements
Website owners resort to top-of-the-content elements like popup forms or social share pop-ups to achieve marketing objectives like lead generation and earning social shares or mentions. The top-of-the-content features are triggered based on user behavior or time delay.
A dynamic heatmap track the user behavior for such top-of-the-content elements. The heatmap analysis helps in knowing the user interaction, which in turn assists in creating a hypothesis for trigger condition experimentation.
Observing clicks on the dropdown menu and carousals
The drop-down menu and carousals are dynamic elements that are the core components of the modern website. Drop-down menus are there in almost all mobile versions of the website, and carousal is popular among eCommerce stores. As these elements change with user interaction, a static heatmap analysis can’t be done.
Dynamic heatmap allows analysis of carousal and drop-down menus. It helps in finding what is catching the eye of visitors and what is distracting them while clicking on these dynamic elements. Also, the creation and validation of hypotheses, like the number of carousel images and links on the drop-down menu, are possible with dynamic heatmap analysis.
Dynamic heatmap analysis with VWO
Dynamic heatmap is becoming a go-to tool for CRO managers to analyze their intuitive and complex websites.
A dynamic heatmap must be easy to deploy cross-channel, and its post-analysis should allow the slicing and dicing of data as per preferred segments and filters. That’s why software giants like Micro Focus rely on VWO Insights for heatmap analysis to optimize the user experience.
VWO’s heatmaps are easier to deploy, analyze, and share with colleagues. Along with a dynamic heatmap, VWO heatmap analysis consists of four other heatmaps, which is what makes it a cut above the rest. These heatmaps are element lists, click maps, scroll maps, and click areas. Here is each one in brief:
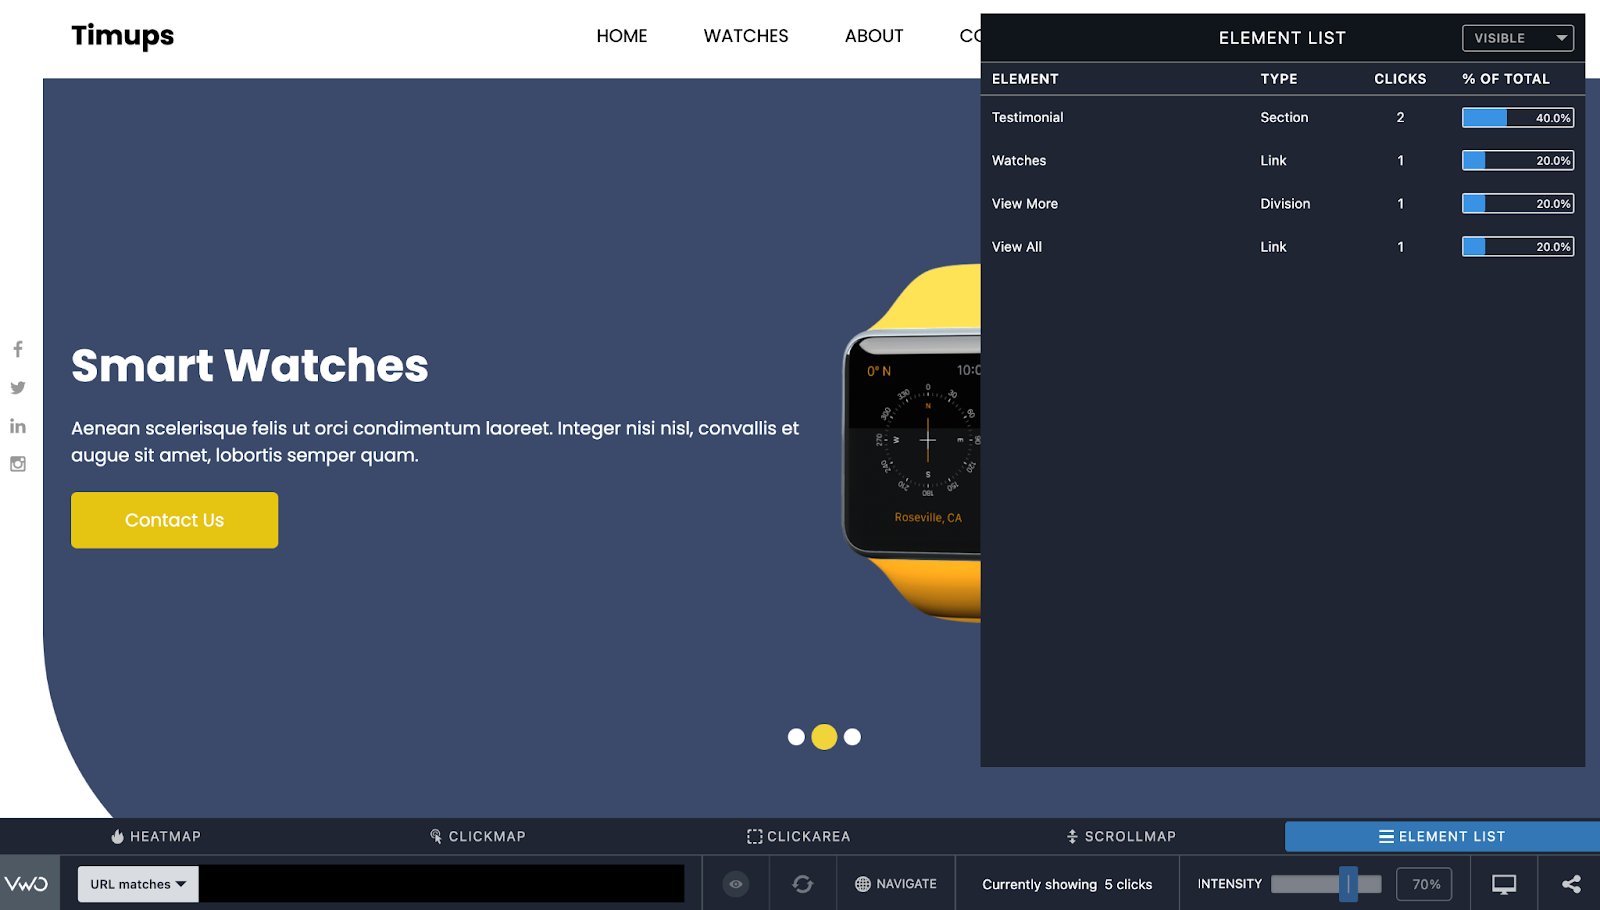
Element list:
It lets you see the lists containing the number of clicks on elements like CTAs, divs, and headers.
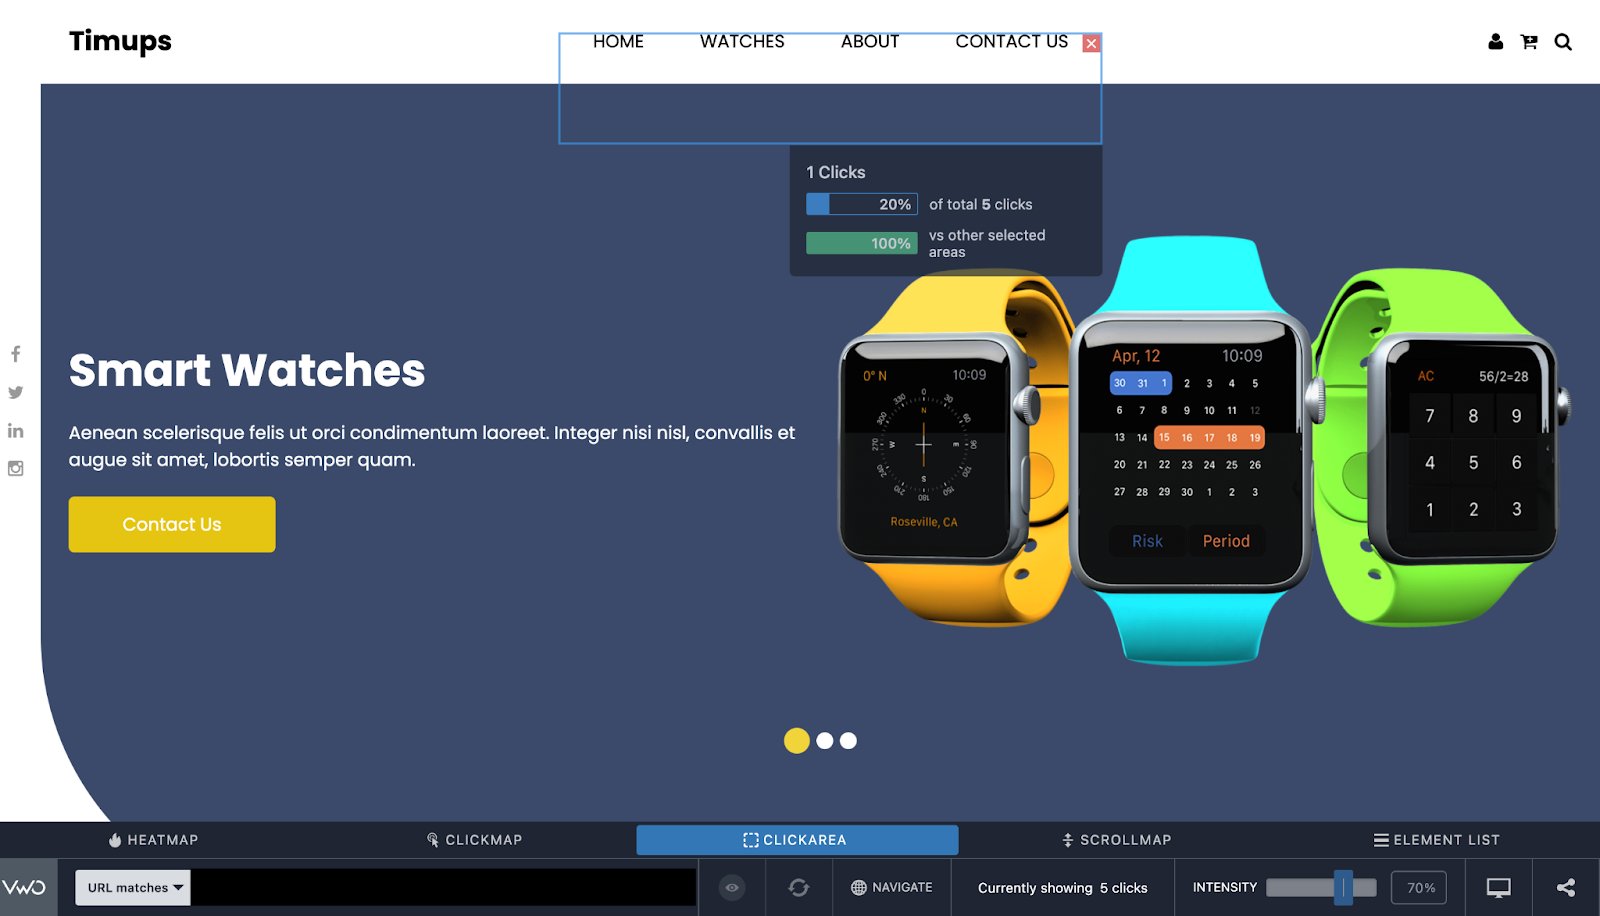
Click area:
It shows the number of clicks on a webpage section. It helps in knowing the ignored sections on a webpage.
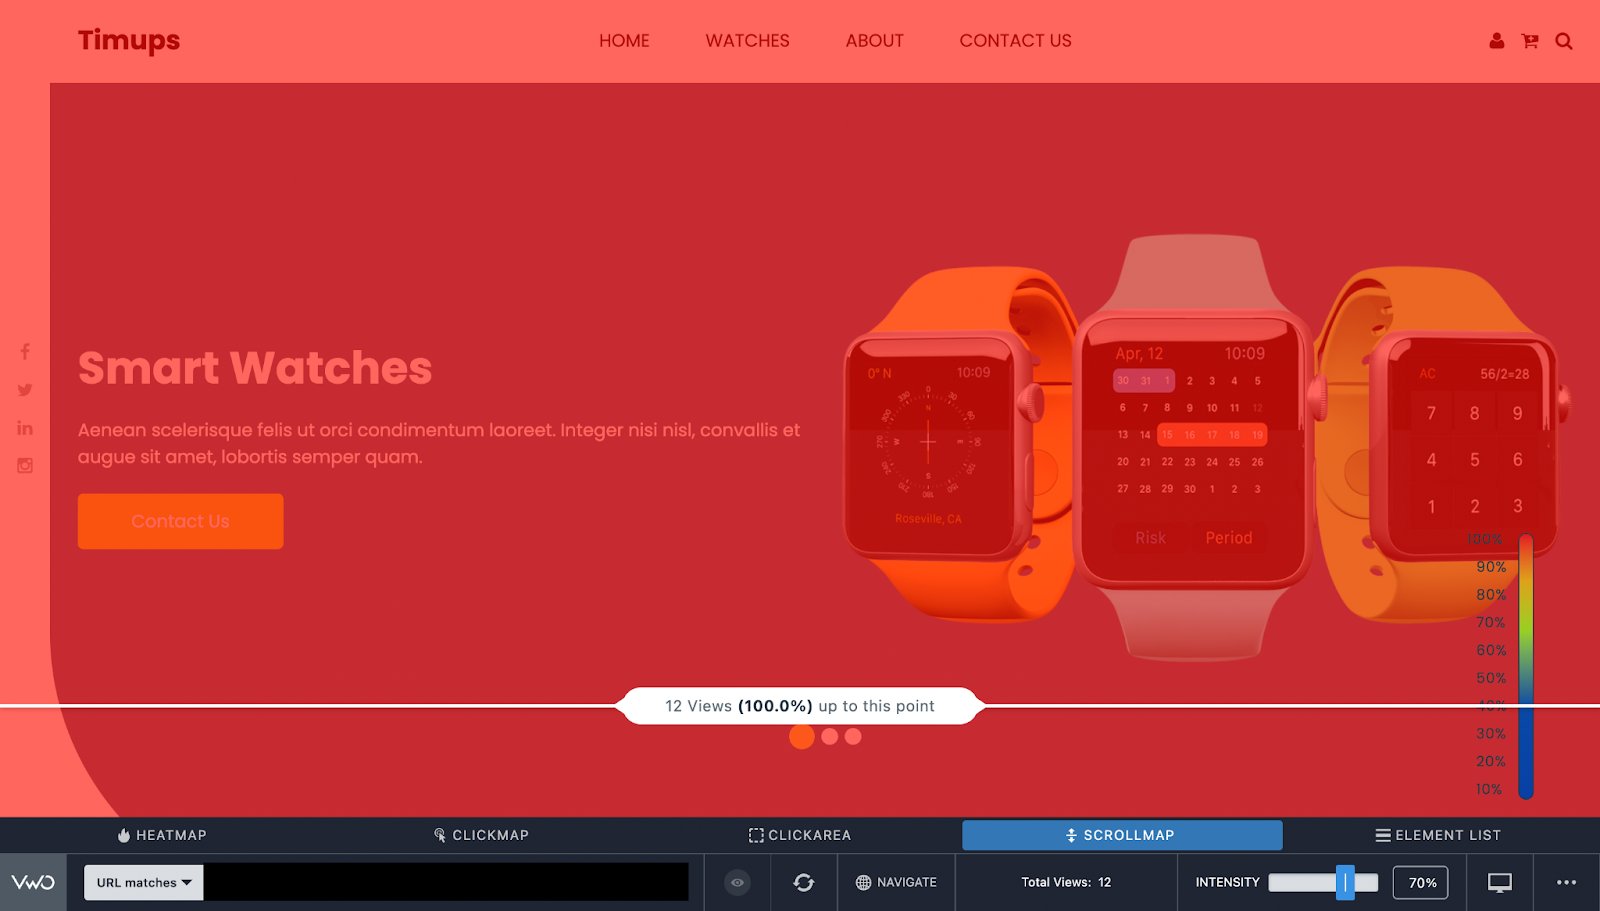
Scrollmap:
Showcases the depth to which users are getting engaged. It represents the scroll level after which the users leave the webpage.
Clickmap:
This helps you know the exact number of clicks on images, elements, white spaces, and text by hovering over them.
Try heatmap analysis with VWO Insights to understand the depth of visitor engagement on your website. Get an all-inclusive free trial to find out more.


