
What is a heatmap?
A heatmap is a visual depiction of data that shows how users interact with a website, showing where they click or don’t, for example.
Heatmaps are crucial in determining what functions well or incorrectly on a website or product page. They make it simple to view and quickly comprehend complicated data.
Heatmaps can help you assess the performance of your product and prioritize the jobs to be done that increase customer value as you experiment with the position of buttons and elements.
Therefore, heatmaps offer a simple and fast method for interpreting overall user trends.
What does a heatmap show?
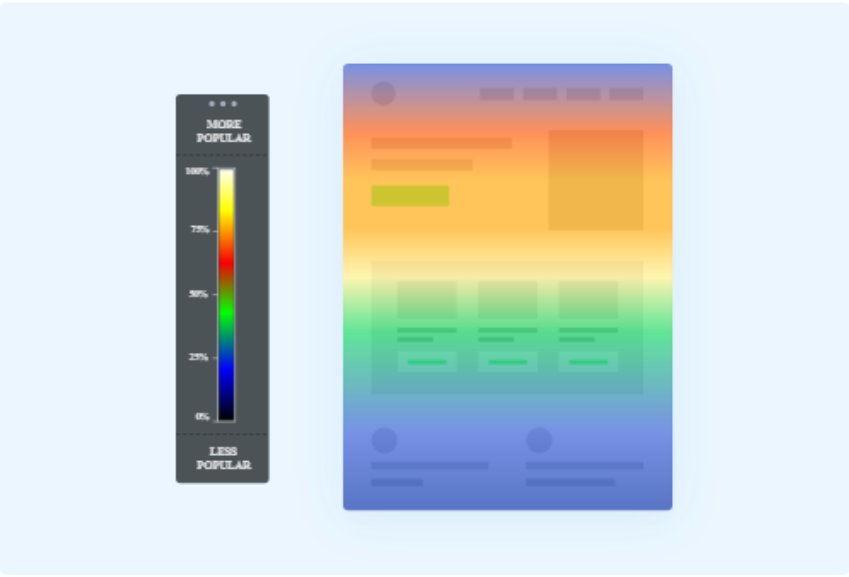
Heatmaps are colourful depictions of user responses to various website pages, offering a visual context for quick analysis.
By using colours on a red-to-blue scale, website and product heatmaps demonstrate which elements of your webpage are most popular (hot) and least popular (cold).
Benefits of heatmaps
Through the use of website heatmaps, you can visually observe and analyze visitor activity to better optimize your site to meet your objectives. They show which parts of the site are popular, which parts are effective and which parts are not, as well as which parts of the site visitors are avoiding. By acting on the data, rather than merely speculating, you can create data-driven improvements. Heatmaps can help:
- Determine whether a page’s vital content is being missed by visitors.
- Look for CTAs that might be difficult for users to locate.
- Understanding user difficulties specific to various devices and browsers.
- Recognizing the distractions produced by non-clickable components that may cause low conversion rates.
- Gather data on visitor behaviour that you may use to customize your website to better match visitor needs, such as enhancing conversion funnels, raising conversion rates, and lowering bounce rates, among other objectives.
Types of heatmaps
Some frequently used types of heatmaps are mentioned below:
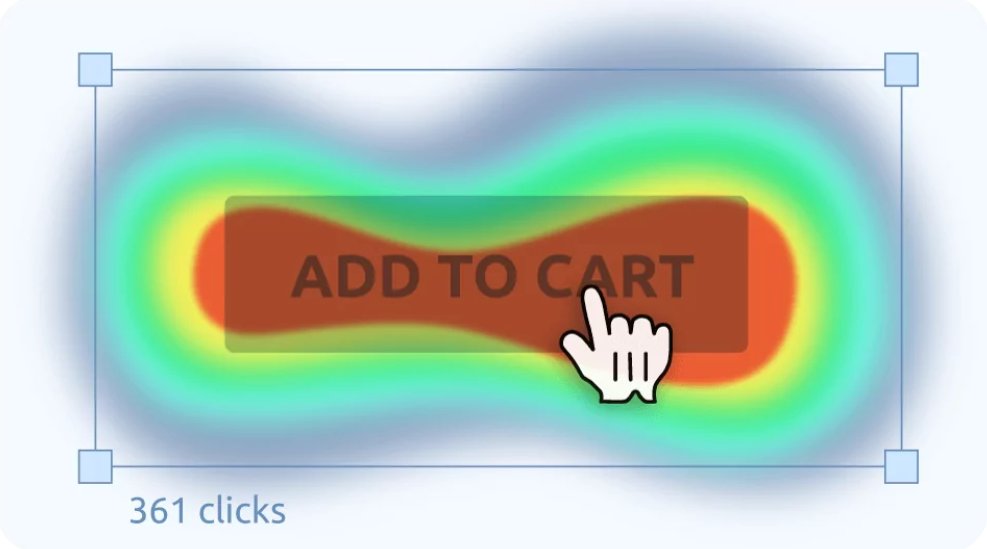
Clickmaps
A click map is the most popular type of heatmap that indicates where users tap or click on a website. Use them to determine whether important clickable elements, like CTAs, are being clicked on. Clickmaps allow you to identify whether parts of your website are frequently or infrequently clicked, revealing any navigational problems.
Click maps can help track clicks on:
- CTAs
- Links
- Images
- Navigation
Scroll maps
A scroll map indicates how far down a page a person has scrolled, or their scrolling behaviour. You can choose the appropriate length of web pages by knowing how far the typical visitor scrolls before leaving. Additionally, it can aid in the placement of content on a page.
Overall, utilizing scroll maps and analyzing them may reveal whether important content is being overlooked and how a page might be restructured to optimize its impact. Scroll maps tell you:
- The number of users that scrolled down a page
- How many people scrolled down a page but stopped before the bottom?
- The number of users that abandoned a page
- How many people scrolled down a web page to a particular depth
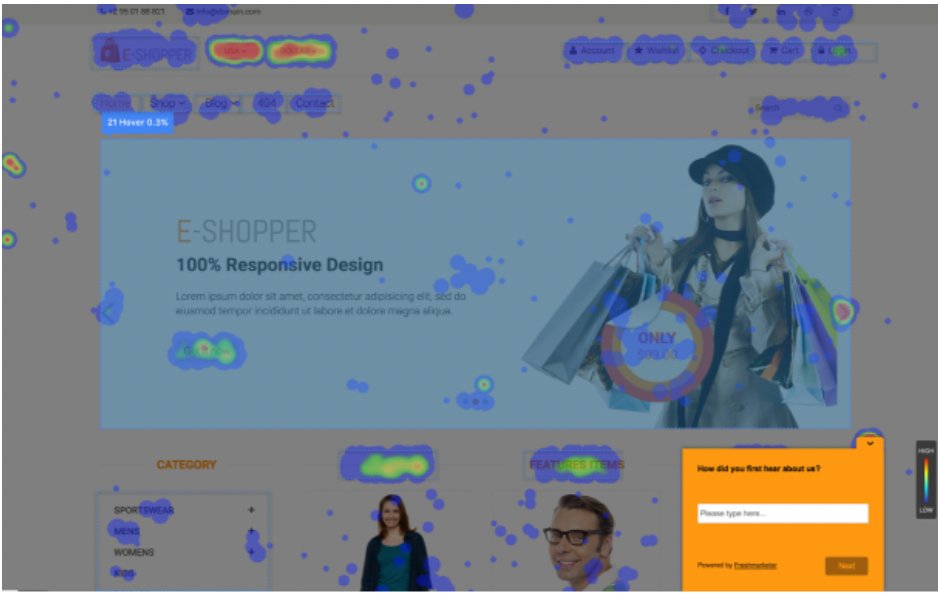
Mouse-tracking/hover heatmaps
Move maps keep track of mouse movements made by desktop users while they browse the website. Additionally, mouse-tracking enables you to optimize complicated websites with dynamic features and determine the relevancy of search results by counting clicks. Hover patterns that reveal visitor friction or annoyance are revealed by these techniques.
Eye-tracking heatmaps
Eye-tracking heatmaps employ sensor technologies to monitor users’ eye movements as they navigate around a website. Technology of this kind may track eye movement, blinking, and pupil dilation to determine where a person is paying attention on a page.
To aid in the development of a better user-friendly layout, this kind of data provides you with insights into how well a web page’s design is doing. The most vital components of a web page may be placed in the areas of the page that are most frequently glanced at by users thanks to eye-tracking heat maps, which can show information about a visitor’s gaze pattern.
Error click heatmaps
When a user clicks on a web page element that causes an error, such as a console error or a client-side JavaScript problem, this is known as an error click. Users may become quite frustrated when they run into bugs or mistakes on the website. You can easily find and solve defects using error-click maps, dramatically improving user experience.
Rage click heatmaps
Rage Clicks take place when users perceive a static element as a button and expect anything to happen, or when a button isn’t working as intended and results in an error.
Rage clickmaps display every spot where people have shown their annoyance while clicking. The maps highlight places on your website where customers often click (or tap) an element, they are used to spot points of friction or annoyance.
Who can benefit from heatmaps?
Heatmaps can be used by various marketing professionals to optimize the conversion journey as below:
- UX designers – Can use heatmaps to analyze the behaviour of active site visitors to optimize the placement of buttons and other on-page components to provide a fantastic user experience and reduce the need for user testing.
- Digital marketers – Can identify the weakest areas of a website using heatmaps and A/B testing, then test strategies to make those areas stronger to boost conversions.
- Product managers – Can make an app or website more enticing to consumers by analyzing and visualizing each device activity, hence developing and delivering a product that customers will simply adore and appreciate.
When are heatmaps effective?
Heatmaps can provide you with a lot of useful information, but they are not a magic solution. Heatmaps are often most effective when something has changed, either in your clientele or your website, and you want to see how it impacts usability. They perform well in the particular use-cases that are listed below:
- A/B testing – Does moving a website piece above the fold or changing its colour improve clicks and conversions, for instance? When using a click map, the distinction is readily noticeable.
- Overhauls or modifications to websites – Despite its sleek new look, is your website drawing in new visitors? To determine what is grabbing their attention, use hover maps or eye tracking.
- Conversion rate optimization (CRO) – Web designers should make sure that the aesthetics and functionality of a website work together effortlessly so that visitors click through. Scroll maps and click maps are useful tools for assessing a design’s efficacy.
- Content marketing – Users need to be drawn into your blogs and white papers, at least until they locate the CTA. Place your CTA buttons by the amount of content that your users are reading by using scroll maps.
- Testing usability- Above all, users should be able to navigate and utilize your site easily. Heatmaps may point out places on your website where visitors can become lost or confused.
The good and bad of heatmaps:
Pros:
- Examine and interpret enormous amounts of data quickly and in a highly visual style.
- Determine any points where users may be skipping or disregarding the action you want them to perform, and put a fix in place.
- Understand user behaviour more clearly over time and spot valuable trends
- To create more compelling pages in the future, take inspiration from existing pages on your website.
- Establish which regions of your website visitors are naturally drawn to, and place your most crucial content there.
Cons:
- Heatmap data can occasionally be erroneous due to variations in browsers and device dimensions.
- A heatmap program that ignores dynamic sites or components is not helpful.
- It may be challenging to transform them into useful business insights in the absence of related quantitative data.
- Some heatmaps such as eye trackers might be extremely expensive.
- Heatmaps require a significant amount of traffic to be analyzed to make precise predictions.
- Another drawback of heatmaps is that they should always be used in combination with other data since a single heatmap cannot give a complete sense of why people act in a certain way.
Heatmap is a crucial visitor behaviour analytics tool, but applying it in an unstructured manner or without understanding the nuances of the entire process may result in inaccurate results. You may adjust your website’s design and content depending on visitors’ real-time interactions with it when done correctly, bearing in mind all the little errors you can make, the types of insight you can utilize, and employing the right sort of website heatmap.
Get the complete heatmap guide here. To try out VWO heatmaps, take an all-inclusive free trial.


