

In 1991, Cormac Kinney, a software inventor, and entrepreneur designed an application that equipped securities traders to decipher market trade economics and beat the odds. His program mimicked a virtual chessboard where each square represented tradable security. If any security’s price spiked during a trading session, it’s respective square turned blue. Meanwhile, if it dipped, the square turned red. Besides enabling traders to analyze market conditions quickly, the application aided them to predict activities and encash on fruitful opportunities.
Download Free: Website Heatmap Guide
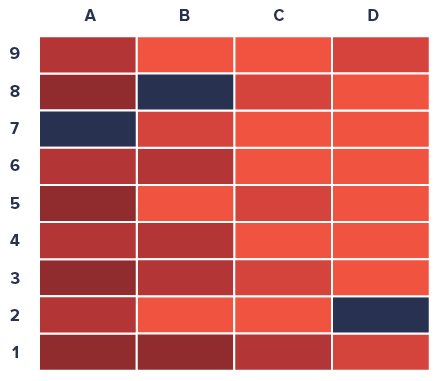
The cognitive theory behind his invention (which he named and later trademarked as ‘heatmaps’) was simple. He exploited the fact that the human eye can easily spot color differences than comparing numbers. Kenny also concluded that colors can help transform large quantities of data into simple and immediate visual representations, directly resulting in faster decision making, an essential trait for succeeding in financial markets.
Owing to the success of his invention, heatmap today has become the go-to tool for visual data representation and interpretation not only for statisticians but geographers, business owners, marketers, biologists, and the like. This blog aims to navigate your way through heatmap applications in the digital sphere of websites. Let’s dive in!
What do Heatmaps do?
By utility, a heatmap is a technique to visualize data that shows the magnitude of visitor activity or engagement on a website using colors in two dimensions. The variation in colors depicts the intensity of visitor activity/engagement, giving experience managers enough visual cues to read visitor reactions and draw learnings.
Many different color schemes are used to illustrate heatmaps considering the advantages and disadvantages of each. In general, rainbow colors are used as humans are more responsive to such colors than shades of gray. In the case of website heatmaps, hot-to-cold color codings are utilized for representation of data. Here, the color red typically represents the hottest areas (or regions with maximum activity/engagement), fading through orange and yellow to cooler areas in green and blue highlighting areas with least activity/engagement.
How to Create a Heatmap?
We recommend VWO Heatmaps to get started. A useful trait of VWO Heatmaps is its ability to constantly work under the hood and analyze millions of engagement data once you’ve added a small code snippet (VWO Smartcode) just once, to your websites.
If you wish to drill-down into specifics, such as track the activity log of a particular visitor segment, simply create custom views and deep-dive into data. You can also look at heatmaps for specific segments that are of interest to you. For instance, VWO Heatmaps offers the ability to compare heatmaps of visitors from San Francisco using iOS versus visitors from New York using Android.
Here’s how to view a heatmap in your VWO account:
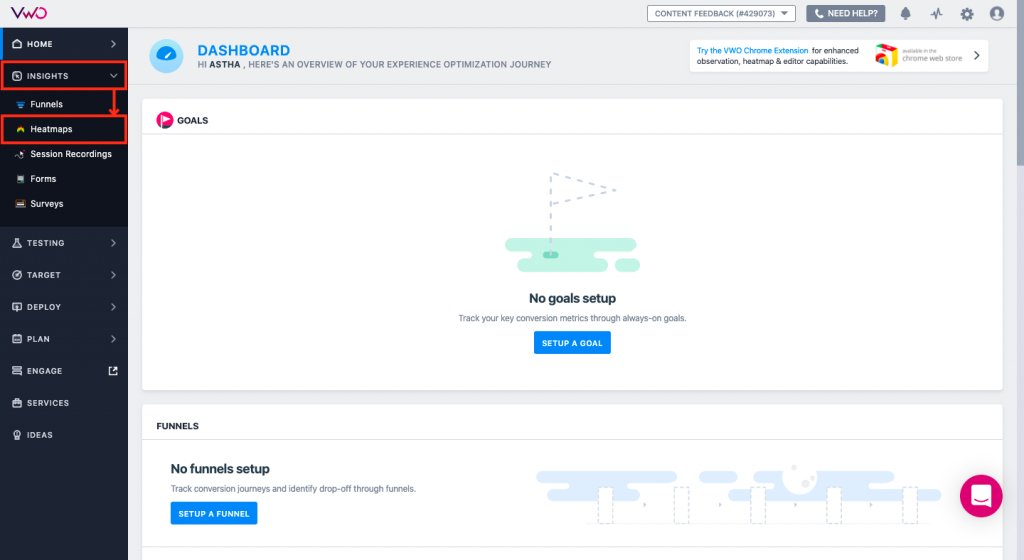
Step 1: Log in to your VWO dashboard.
Step 2: Click on INSIGHTS and then on HEATMAPS.
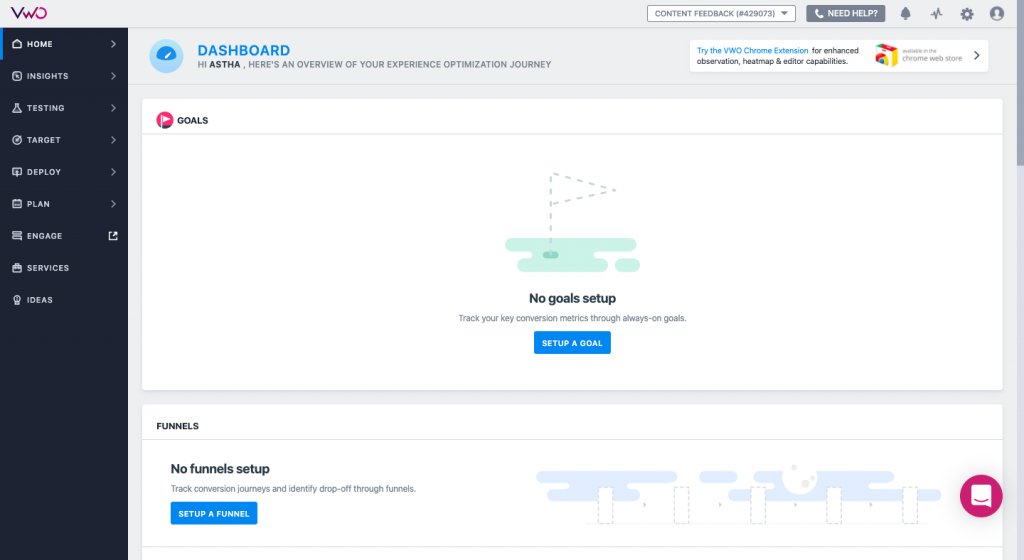
Here’s how the Heatmaps dashboard looks like:
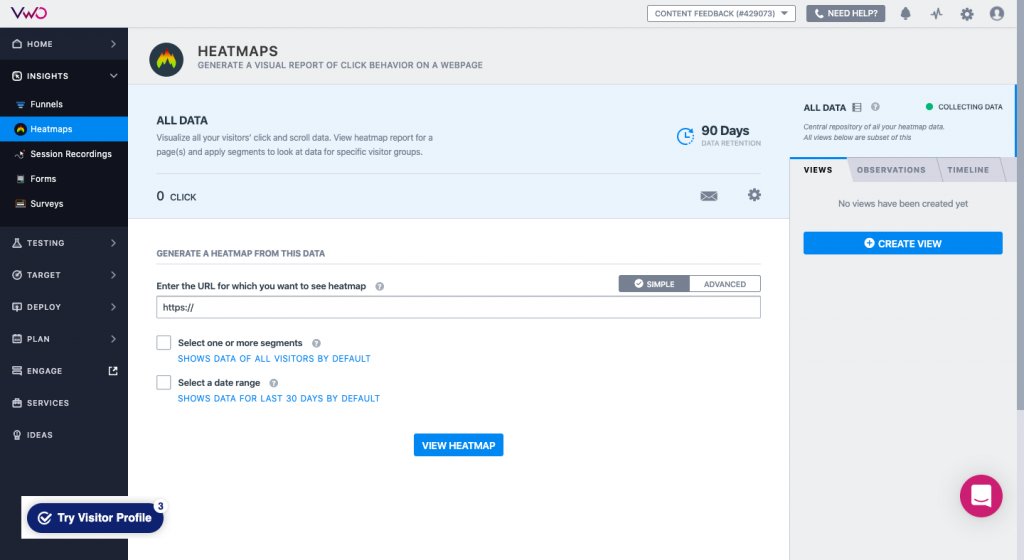
Step 3: To create a new view, click the CREATE VIEW button present on the right panel. A new VIEW page will open.
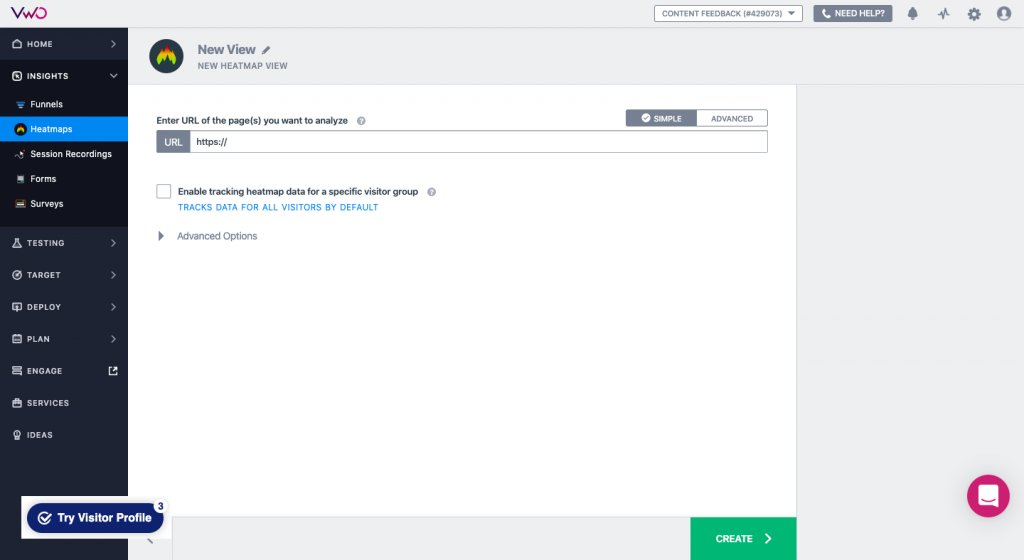
Step 4: Click on the pencil icon next to the NEW VIEW and give your heatmap a suitable name. Here, we’ve named our view as “CRO Pillar Page Heatmap” – in this case we want to see the heatmap of people who visit one of our long form pages on CRO.
Step 5: Next, enter the page URLs you wish to analyze. Here, you get two options: SIMPLE and ADVANCED View.
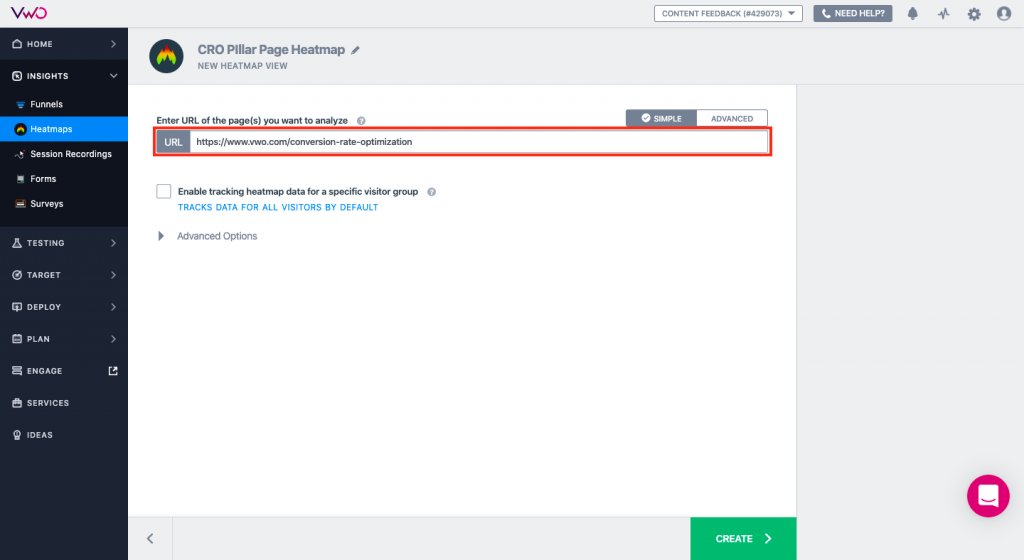
While the former helps generate a cognitive heatmap view of the entered URL, the latter gives you the leverage to include or exclude URLs from the view. This way you can generate heatmaps for specific pages and accordingly record goal conversions as well as map other essential metrics.
Additionally, you can also define advanced pattern-matching choices to either add a broad URL with wildcard entries or a particular URL. For instance, if you enter pattern URL as “http://www.example.com/products*” (with the asterisk symbol), you’ll be able to record goal conversion for all of your product pages. Meanwhile, if you use pattern URL such as “http://www.example.com*”, you’ll be able to track conversions on the entire website.
Step 6: To record the click pattern of a specific visitor segment and plot it on a heatmap report, click on the “Enable tracking heatmap data for a specific visitor group” checkbox.
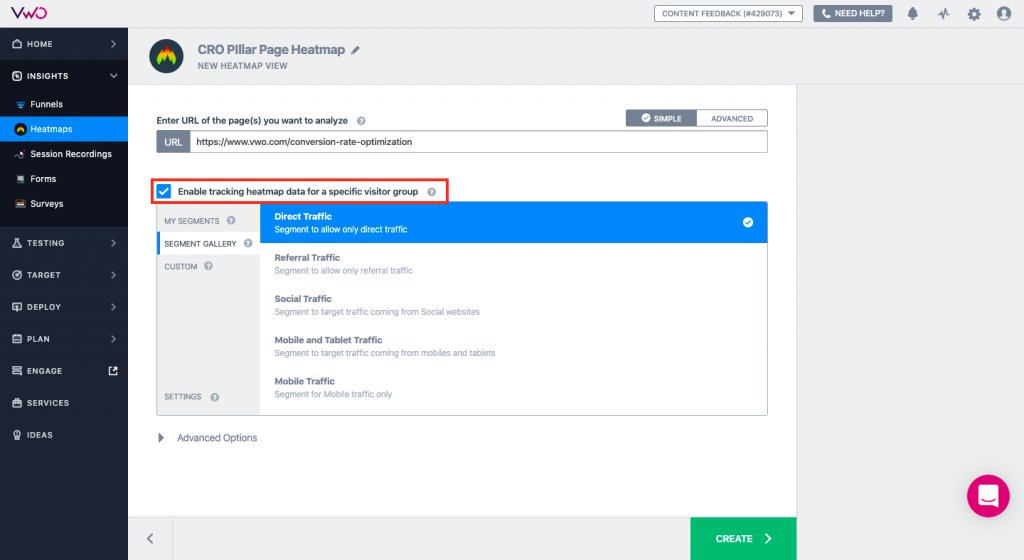
As the above image indicates, you can easily enter segment specifics, add custom conditions, and also even save the segment for future reference. The option is available in both Simple and Advanced View options.
Step 7: To run, pause, or stop a heatmap at specific intervals, expand the Advanced Options tab, and enable scheduling. To learn more about scheduling options, refer to How to Schedule Your VWO Test.
Step 8: Lastly, click on CREATE to proceed further and generate a heatmap view. You can either immediately run the view or select a specific start time.
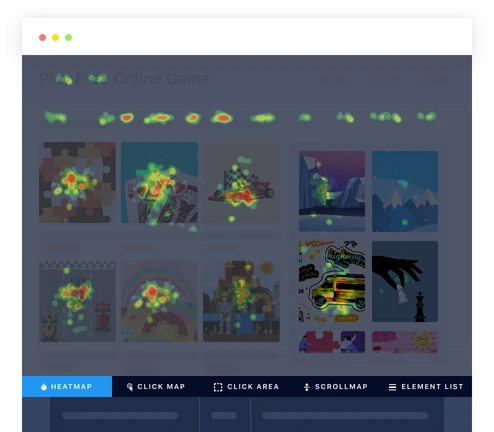
Here’s how the heatmap looks like:
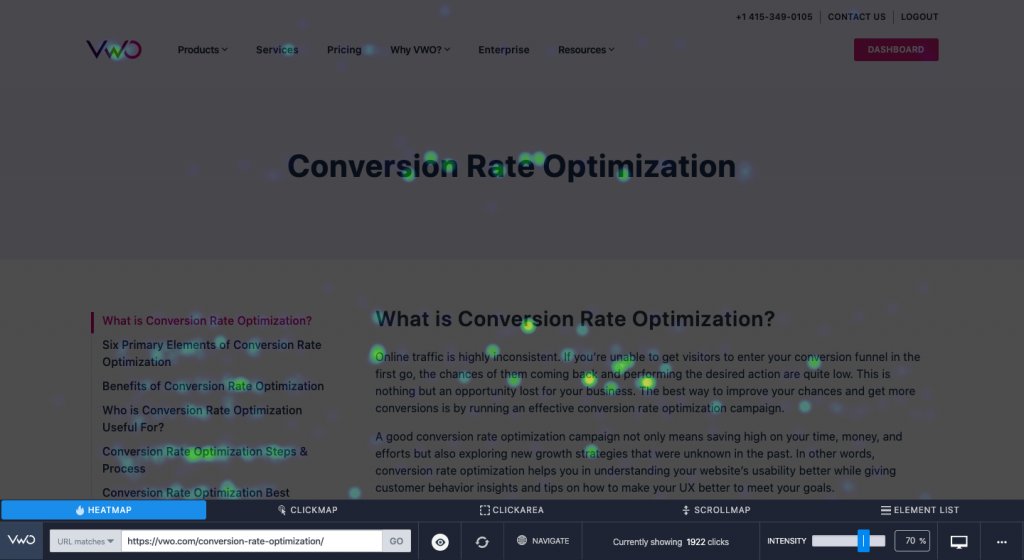
Note, as visible in the image above, the tool enables you to view page Heatmap, Clickmap, Scrollmap as well as look at the Element List to view total clicks + click percentage per page element.
Post-requisite
To verify the successful creation of your heatmap view, go to INSIGHTS and click on HEATMAPS. All newly created views appear in the VIEW tab present on the right panel. A preview of the heatmap link is also displayed below the view title for future reference.
Note, Safari browser blocks third-party cookies to load and capture data. To load heatmap data correctly, go to Safari and click on PREFERENCES. Next, click on PRIVACY and disable the “Prevent Cross-Site Tracking” option.
Although producing a heatmap is quite simple and easy, don’t rush it. Build your understanding of the analytical tool in layers. Move ahead only when you’ve mastered each level. If you try and analyze your entire website at once, for instance, you’ll surely be overwhelmed. Instead, start by analyzing a page that gets enough traffic to generate a meaningful heatmap. How about your blog post page?
Download Free: Website Heatmap Guide
What Does a Good Heatmap Tool Do For You?
Heatmaps provide richer performance insights than many traditional web analytics tools. Here are some ways in which you can use heatmaps
To see the elements being clicked on: In an ideal world, marketers would love to see a uniform spread of clicks across all key elements over their website. However the real world depicts an extremely disproportionate distribution with only a few elements getting a majority of clicks. Heatmaps make you aware of the set of elements that are gaining more traction than others so that you can
- Make the good stuff more prominent: “Request Pricing” & “Free Trial” getting more clicks than “About Us” & “Why Us”? Maybe you should think of removing the latter altogether so that you reduce the clutter in the visit and get their focus on the buttons that matter.
- Improve UX: Elements that don’t drive any clicks have no business to be on the site, except the ones bound by legal and compliance laws.
To increase page interaction depth: Want to move your visitors from “Above-the-fold-look-but-dont-touch” to “Mid-scroll-engage-with-content’? Say hello once again to your friendly heatmap. To figure out what can move your audience from the first fold to the second and so on, the only real ally is the heatmap. For instance, if the site starts cooling off right at the first fold, you instinctively know that adding an engagement element at the fold drop-off point might help you plug the problem. Keep on repeating this for all cool-off points and you have won the engagement battle.
Where content isn’t getting attention as expected: Visitors spend about 80% of their time scanning through content that’s placed above the fold than scrolling through the entire page. Having a bunch of marketers guess what about to hold above the fold without looking at engagement data is , in our humble opinions, missing a big opportunity here.
Enter, heatmaps. The analytical tool helps examine various parts of your web page(s) for maximum and minimum traction, maps visitor engagement, and provides insights on plausible loopholes or conversion leaks.
For instance, The Vineyard, a luxury hotel located in Berkshire, used VWO Heatmaps to analyze the performance of their Room Booking Page CTA button. They learned that the page’s CTA was unclear, practically invisible amid the rest of the content, and hence, it failed to engage visitors. They then prominently placed the CTA button above the fold and witnessed a 32.12% increase in conversions.
Whether or not your site is responsive to all types of browsers and devices: Besides the above-mentioned specs, heatmaps also allow you to study micro details. With custom field and segmentation options available in VWO heatmaps, you can even analyze if your webpages are effective and responsive to all types of devices and browsers. Such detailing helps track technical issues and even map the quirkiness of visitor behavior.
To conclude, a heatmap may appear as a colored canvas but it’s more than that. It’s the backbone of any CRO strategy. Besides statistically computing and graphically representing data, a heatmap allows experience managers to quickly analyze data and take necessary web optimization decisions. If you’re new to the world of heat mapping and want to learn more about the analytical tool, sign up for a free demo session or opt-in for a free trial.
Categories:


![Top 10 Shopify Heatmap Apps [With Features – 2026]](https://static.wingify.com/gcp/uploads/sites/3/2020/04/Feature-image_Shopify-Heatmaps-All-you-need-to-know.png?tr=w-300,h-150)


