

By definition, heatmap visualization or heatmap data visualization is a method of graphically representing numerical data where the value of each data point is indicated using colors. The most commonly used color scheme used in heatmap visualization is the warm-to-cool color scheme, with the warm colors representing high-value data points and the cool colors representing low-value data points.

The reason that visualization of data through methods like heatmap has become so popular is that humans, in essence, are visual beings. Many studies on human psychology and perception suggest that we view and process visuals way more efficiently than written text or written data. In fact, according to the Social Science Research Network, 65% of human beings are visual learners; and that is why visualizing data of any form makes so much more sense.
In the world of online businesses, website heatmaps are crucial to visualize visitor behavior data so that business owners, marketers, and UX designers can identify the best-performing sections of a webpage based on visitor interaction. More importantly, heatmaps help to classify the sections that are performing sub-par and need optimization.
In this blog, we will understand heatmap data visualization by taking website heatmaps as an example.
Types of website heatmap data visualization
Due to their dynamic and robust nature, website heatmaps enable the graphical representation of data in many forms based on the nature of the data sets. Businesses use website heatmaps with an online presence to visualize the visitors’ clicks, scrolls, mouse and eye movement, and so on, on their website, in real-time. Visitor interaction on webpages is visualized in heatmaps, scrollmaps, click maps, mouse-tracking heatmaps, and eye-tracking heatmaps.
Let’s explore the kind of data each of these methods of heatmap visualization methods chart and present:
Heatmap
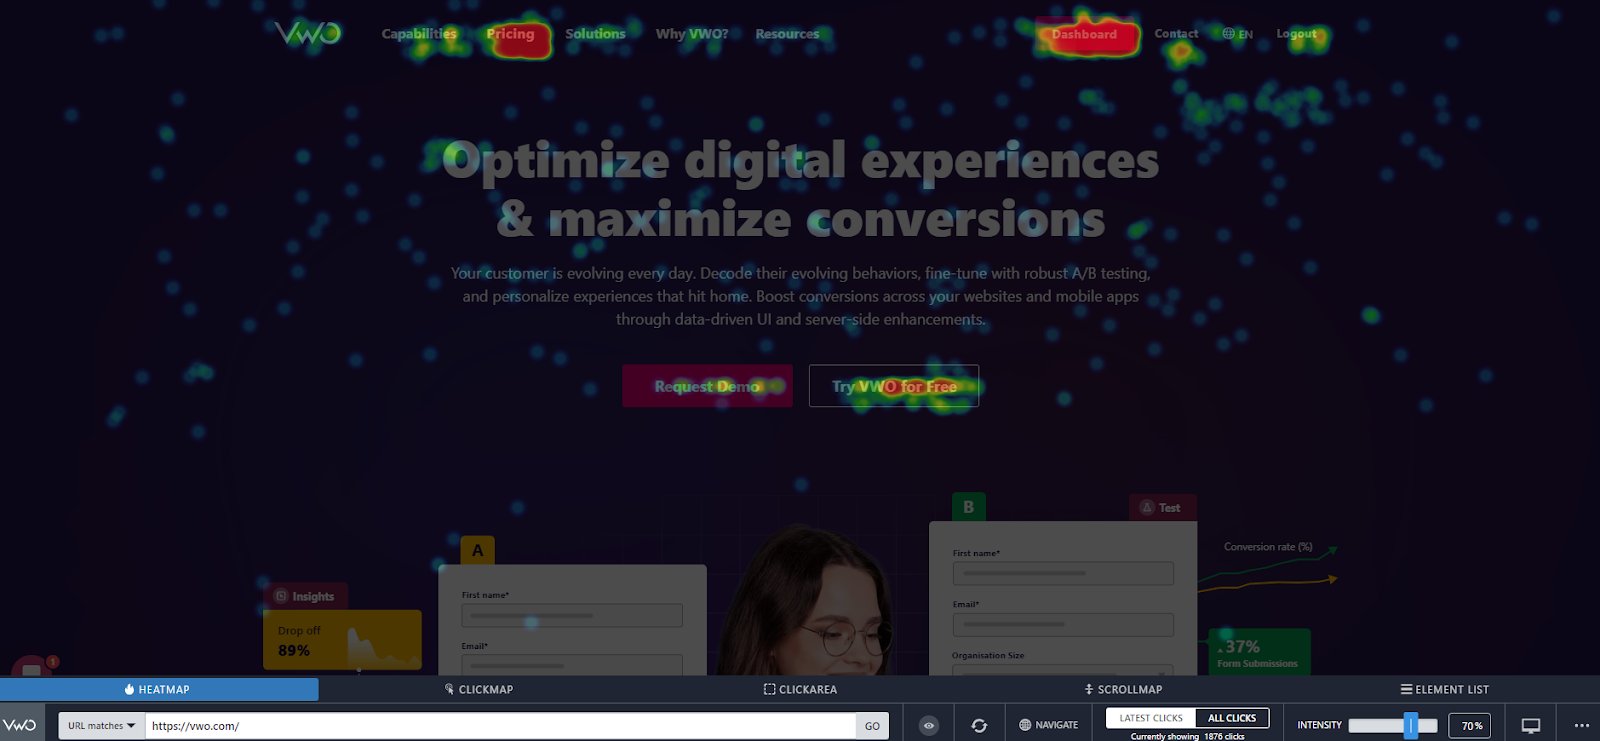
Heatmap is a graphical way to visualize visitor behavior data in the form of hot and cold spots employing a warm-to-cool color scheme. The warm colors indicate sections with the most visitor interaction, red being the area of highest interaction, and the cool colors point to the sections with the lowest interaction.
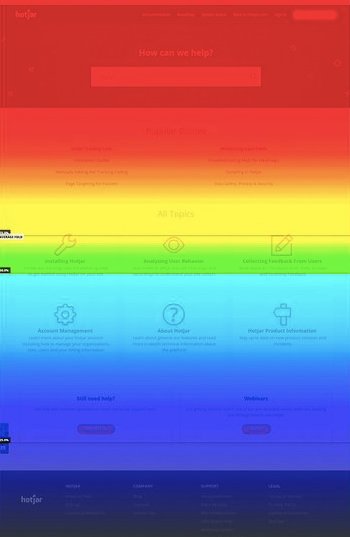
Scroll map
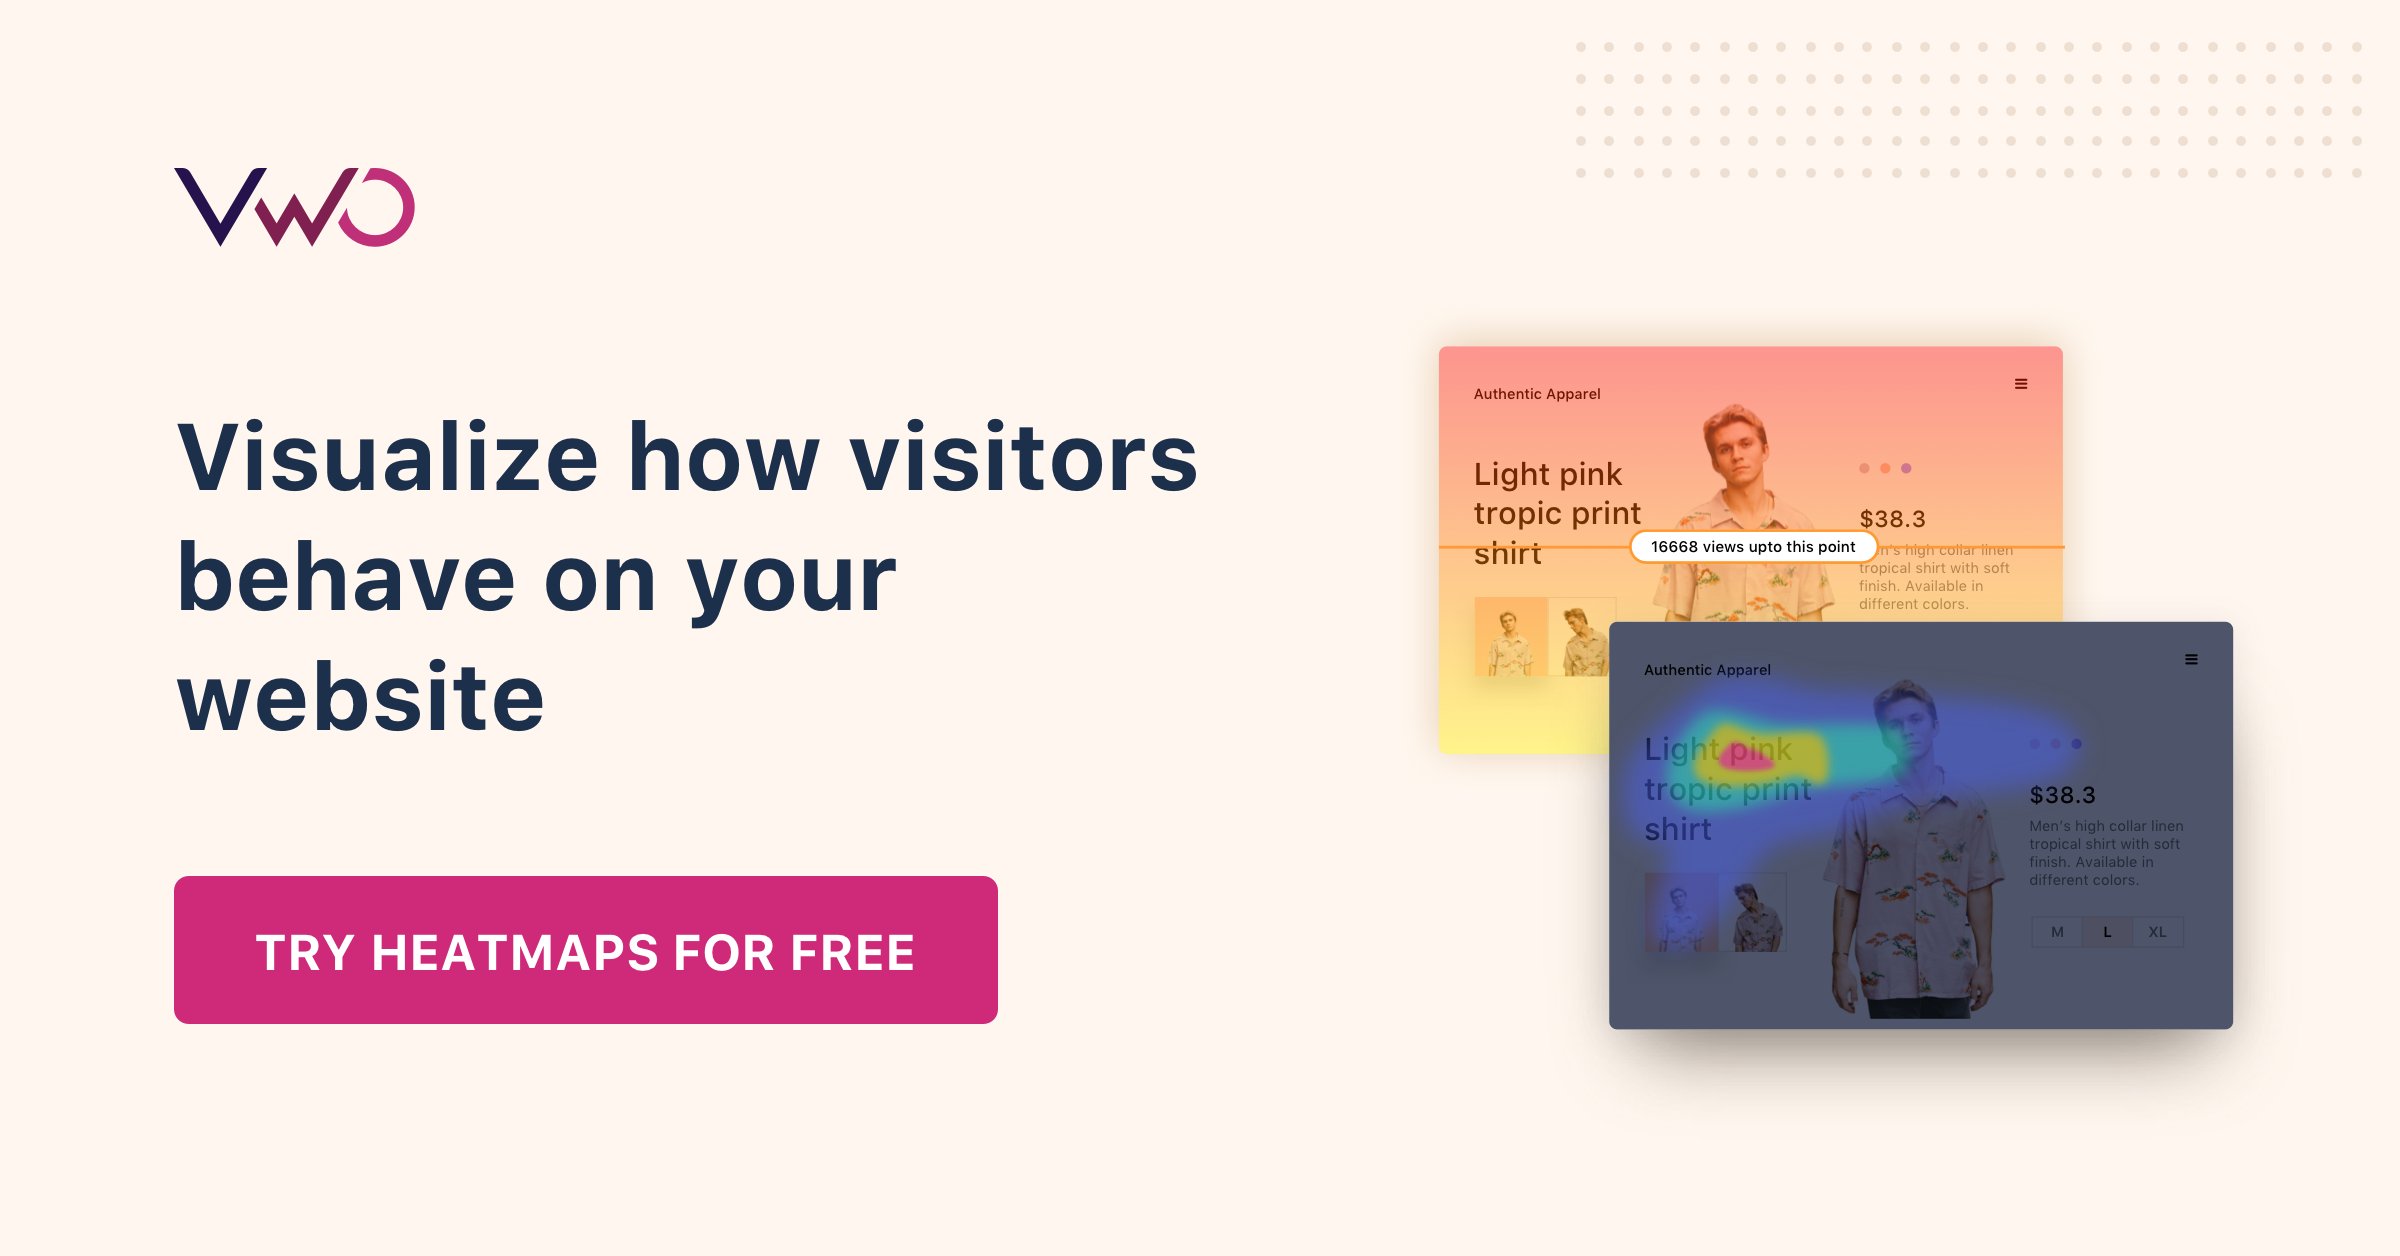
Scroll maps visually present the state of your webpages in the form of a heatmap where all the scroll data (scroll depth, scrolling pattern, etc.) are plotted. A scroll map indicates the number of visitors scrolled to each section of a webpage, the section after which the percentage of people scrolling drastically falls, the maximum depth till which people scrolled, and more. This data is visualized using colors in a single scroll map, with each color signifying varying intensity of interaction.
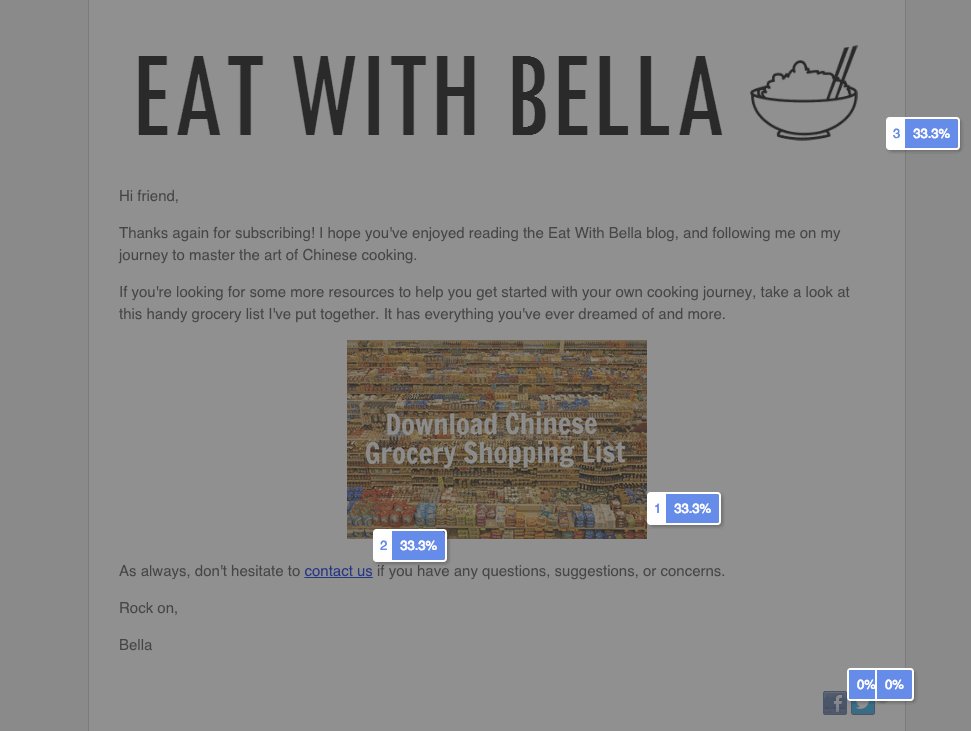
Click map
Website heatmaps also offer click maps that track and visualize click data on the webpages to help you understand visitor behavior at a granular level. Click maps visually presents clicks on each element of a page like clicks on links, missing/broken links, images, CTA, pop-ups, and so on. With each and every click registered on the webpage, click maps present multiple variables and data points in one single heatmap.
Download Free: Website Heatmap Guide
Mouse tracking heatmap
While the first three forms of website heatmap visualization present data on explicit visitor behavior, the underlying and implicit behavioral patterns are tracked in the form of mouse movement. A color-coded heatmap is generated that visualizes mouse movement data of each visitor as well as data where the individual reports are combined to trace patterns in the mouse movement of the visitors.
At the most general level, mouse tracking heatmaps visualize where visitors’ cursor hovers the most, which section/s of a webpage the cursor keeps coming back to, and more such mouse movement data.

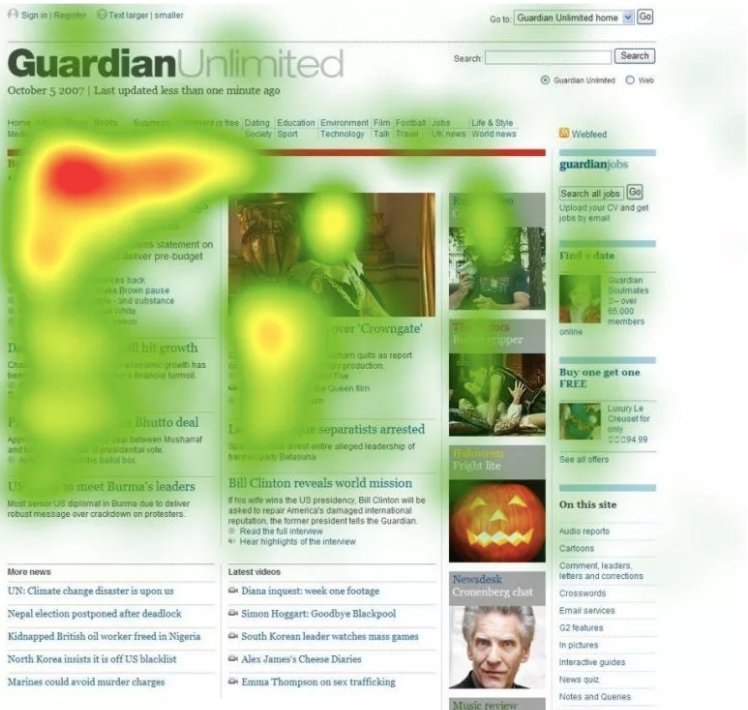
Eye-tracking heatmap
Like mouse tracking heatmap, eye-tracking heatmap also visualizes viewing patterns, but instead of cursor data, data on visitors’ gaze is visualized. Eye-tracking heatmap tracks visitors’ eye movement and visualizes gaze data. These data include fixation length based on the number of times an image is looked at, which elements attract the visitor’s gaze the most, which irrelevant elements are distracting the visitors’ eye away from the main CTA, and so on.

Now, you may wonder why such a color-coded visualization of data is important to you.

When to use heatmap visualization?
Website heatmaps help you uncover hidden behavioral insights through many visualization options discussed in the above sections. Here are some scenarios where you can leverage them:
- Identify the best performing and most popular elements/section, the average performing and least popular elements/sections
- Find solutions through specific data points highlighted in the generated heatmap
- Identify the optimal page length
- Discover segment-wise behavioral patterns, identify user experience breakages, and more
These observations then help you re-ideate, recreate and modify website elements, optimize the experience across all digital properties, and ultimately increase conversions.
VWO’s free AI-powered heatmap generator allows you to predict how visitors interact with your web page. It enables you to gauge bottlenecks based on user experience for you to take required optimization measures.
Overarching comparisons that would require days of data study and sorting can be readily made after one look at the generated heatmap. By offering a visual view of numerical data in a ready-to-consume manner, heatmaps make data analysis much faster and easier than it would be to analyze data stored in excel with endless rows and columns.
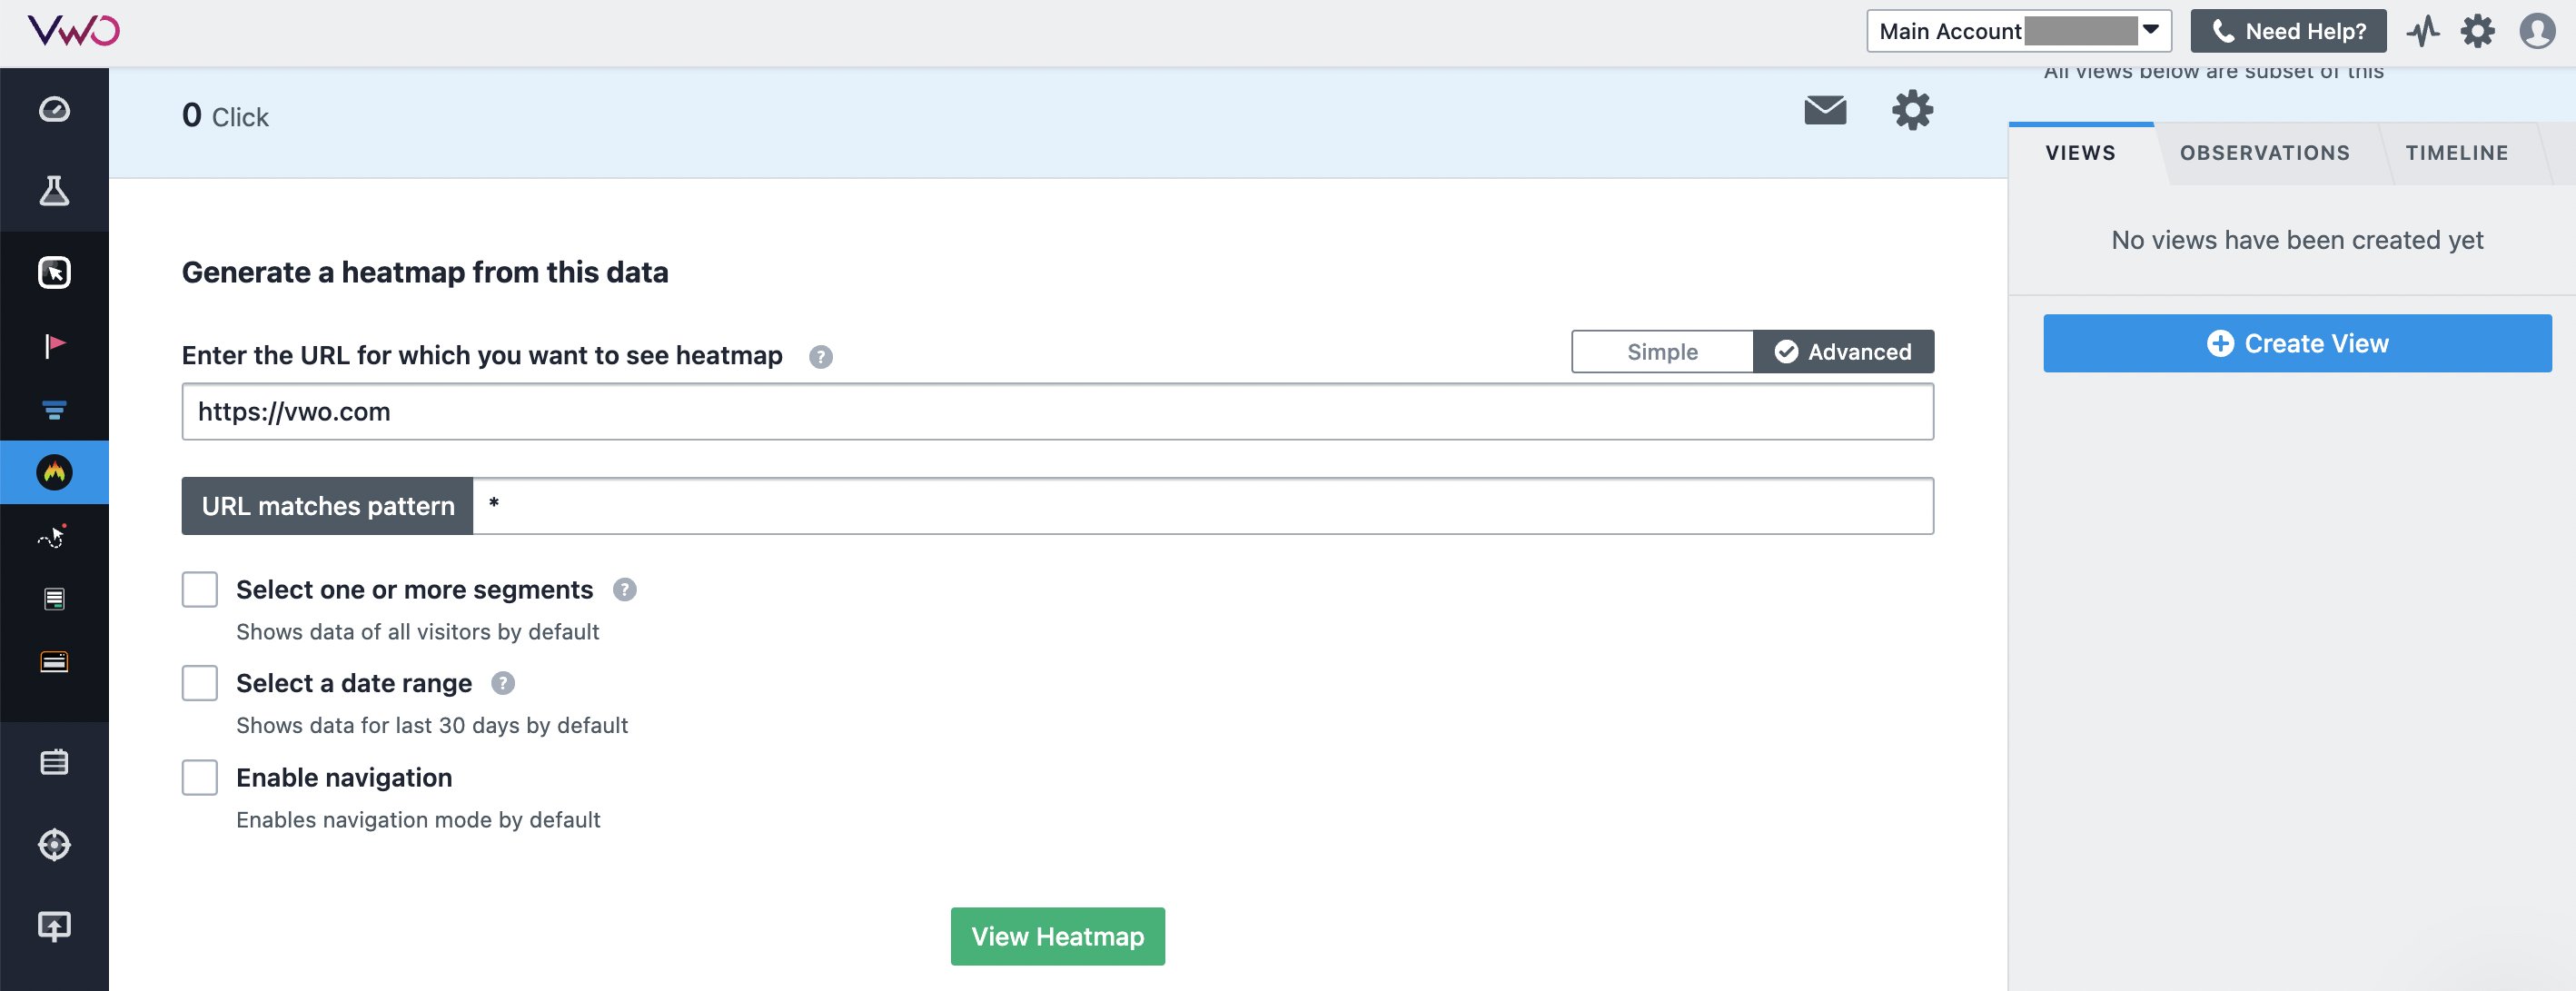
How to use heatmap visualization with VWO Insights – Web
To kick off using VWO Insights – Web, you need to install a smart code on your website’s backend. After that, head to the dashboard where you can specify the web page or type of pages (like various product pages on an e-commerce site) that share similar design and goals in the funnel stage. You can then refine the heatmap data by segmenting users according to different attributes, setting the date range, and clicking to generate the report. Check out this screenshot of the dashboard for reference.
The heatmap reports generated include dynamic heatmap, clickmap, scrollmap, element list, and click area. These provide a comprehensive overview of user behavior, highlighting interactions with important elements like CTAs, content, media, and widgets. Here is how a heatmap report looks:
It’s easy to operate and allows you to get a complete view of user behavior. You can explore more about this on our VWO Heatmap page or book a demo call to see how it can help you generate heatmap reports.
Download Free: Website Heatmap Guide
Conclusion
Website heatmap is only one kind of heatmap data visualization, and, as can be seen above, it can present behavioral data of as many visitors as you want in one single image or heatmap. Professionals from all industries alike can benefit from employing heatmap visualization, and with humans predominantly being visual beings, heatmap data visualization is bound to hold a prominent position in the realm of data visualization.
Watch Jon MacDonald, Founder and President, The Good, talk about using heatmap data to supercharge experiments.
FAQs on heatmap visualization
The major benefit of heatmap visualization is that it enables data to be presented visually which allows us to easily consume information and make more sense of it.
The different types of heatmap visualization for an online business include scroll map, click map, eye tracking heatmap, and mouse tracking heatmap.
Categories:


![Top 10 Shopify Heatmap Apps [With Features – 2026]](https://static.wingify.com/gcp/uploads/sites/3/2020/04/Feature-image_Shopify-Heatmaps-All-you-need-to-know.png?tr=w-300,h-150)


