

A heatmap dashboard is a report card-like central repository of all the data collection configurations and settings, options to create and manage views, heatmap reports, and so on. It essentially is the central place where you can generate heatmap reports, manage heatmap data collection settings, and create and manage views.
For instance, website heatmap dashboards allow users to access the report for a page and apply segments to look at data for specific visitor groups, and stock index heatmap dashboards allow you to configure the data you want to be plotted on the heatmap based on industry, time/duration, and so on.
Download Free: Website Heatmap Guide
Tools and examples of heatmap dashboard
If heatmaps lacked reporting dashboards, it wouldn’t be possible to leverage one of its most important benefits – the ability to deep dive into large data sets without having to go through each one of them. A look at some existing heatmap dashboards will give you an idea about their importance:
VWO Insights’ website heatmap tool
Online businesses get visitors and customers from across the world, falling in different age groups, belonging to different sexes, having different interest areas, different pain points, and so on. So, the data matrix involved is enormous, which, without heatmaps, would warrant the use of the bandwidth of multiple resources, sometimes, hours on end.VWO Insights’ website heatmap tool helps businesses gather and visualize visitor behavior data. Users can deep dive into the data with its segmentation and targeting capabilities. In addition, VWO’s free AI-powered heatmap generator allows you to predict how visitors interact with your web page. It enables you to gauge bottlenecks based on user experience for you to take required optimization measures.
Heatmap dashboard example for a website
Let’s look at VWO Insights’ heatmap dashboard to gauge the information and configurations website heatmap dashboards entail.
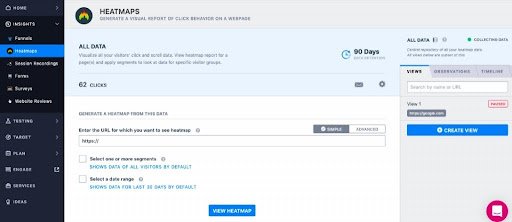
VWO’s heatmap dashboard allows you to configure your heatmap’s setting, enables data collection for heatmaps, view the heatmap of the URL you want, view segment-specific data, filter heatmap based on your requirements, and create multiple views.
That’s not all!
The dashboard also lets you stop the heatmap by pausing data collection, clear existing data from the heatmap using the ‘Flush All Data’ option, and share the report directly from your user account in a single click.
By providing room for so many actions in one single dashboard, heatmap tools like VWO Insights’ heatmap eliminate hours of manual effort that would have otherwise gone into doing all of the above.
Watch the video to get an overview of VWO Heatmaps:
iCharts stock index heatmap tool
The iCharts free heatmap tool helps stock analysts create heatmaps of current market trends and analyze them with ease.
Heatmap dashboard example for a stock index
iCharts has a unique variation of the dashboard. On the one hand, on the top of the page, it allows users to customize the heatmap based on the indices and industry you want to visualize in it. You can also choose what trend you want to visualize: whether you want to plot the ‘Gainers to Losers’ trend or ‘Major to Minor Moves’. And, on the other hand, on hovering over a data point, a report pops up reflecting the data point’s symbol, full name, sector, and previous close value, current price, and the difference between the two.
As can be seen above, iCharts allows users to view the data they want by allowing them to configure the heatmap, while, at the same time, giving a performance report of each data point. iCharts’ dashboard empowers users to know the performance of each data point in the matrix, draw comparisons, and narrow down on the relevant data points – all on the same page.
Download Free: Website Heatmap Guide
TheSmallman heatmap excel dashboards tool
Thesmallman.com is a lab for Excel ideas that contains information on dashboards, charting, financial modeling, VBA, and training. It also offers various courses on building dashboards for various industries and their use cases.
Heatmap dashboard example for an excel
Excel is a powerful tool for generating heatmaps. TheSmallman has some ready-to-use heatmap dashboard templates and also offers courses on how to build your own excel heatmap dashboard. Look at this dashboard template that can be used for creating Excel heatmaps:
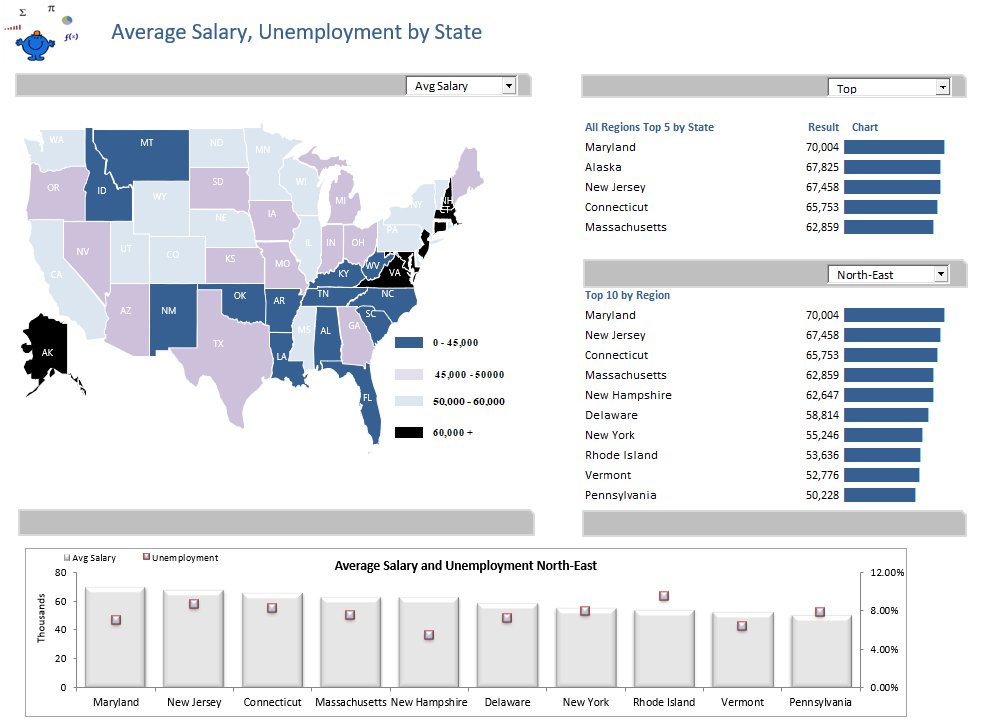
The above dashboard allows you to change the full heatmap view simply by changing the selection in the dropdown on the left that reads ‘Avg Salary’. On changing the selection on this dropdown from ‘Avg Salary’ to ‘Unemployment’, the map as well as the charts on the right changes accordingly. All you need is to feed in the correct data, and voila:
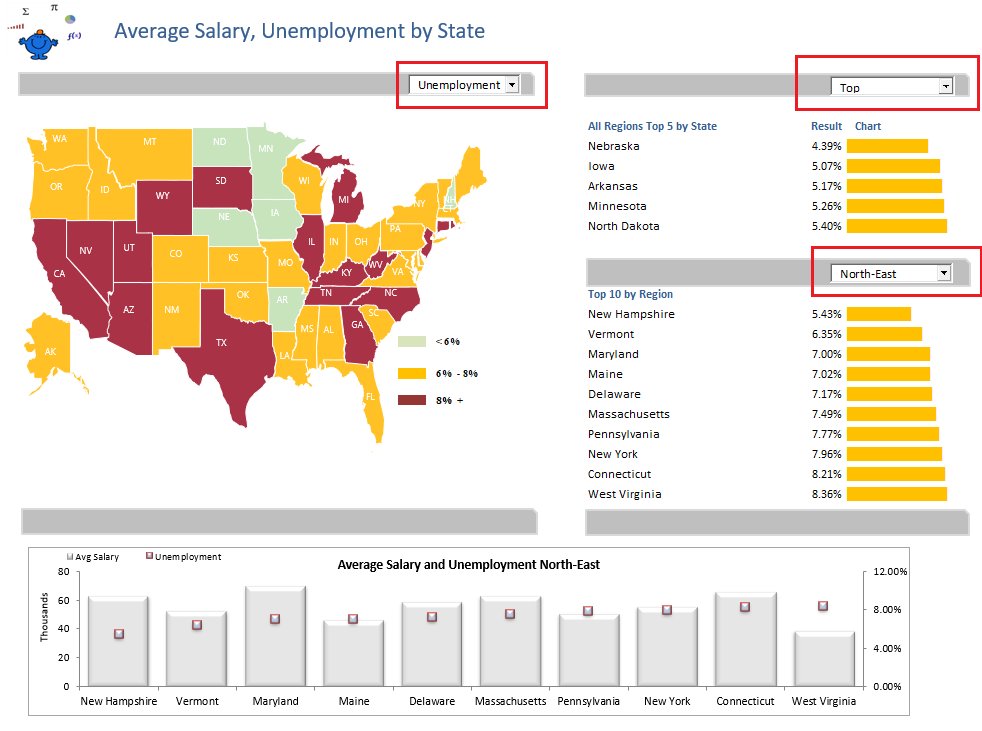
Such a dynamic and well-configured heatmap dashboard empowers businesses to visualize gigantic data matrices on one Excel and also filter and configure data as per requirement.
Conclusion
As can be seen from the above tools and examples of heatmap dashboards, a heatmap is incomplete without a dashboard. If heatmaps solve one pain point for its users, i.e., visualizing complex data sets in an easy to consume manner, heatmap dashboards solve the flipside of this coin—they make data interpretation and analysis of complex data sets simpler. Heatmap dashboard enables you to configure the data you want to visualize, narrow down and dive deep into data segments that are of high business priority, and draw data-backed conclusions from the same.

FAQs on heatmap dashboard
A heatmap dashboad is basically a central repository where you can manage the heatmap data collection settings, generate heatmap reports, and create and manage views for various heatmap datapoints.
A heatmap dashboard allows you to easily visualize and analyze all your heatmap data in a central location, thereby reducing the manual effort required to do it individually.
Categories:


![Top 10 Shopify Heatmap Apps [With Features – 2026]](https://static.wingify.com/gcp/uploads/sites/3/2020/04/Feature-image_Shopify-Heatmaps-All-you-need-to-know.png?tr=w-300,h-150)


