Dynamic Heatmaps: Meaning, Examples and Uses
eCommerce is a pure service business that demands the utmost precision, patience, and persistence to survive the industry’s ever-growing competition. The goal is to help shoppers find good products and provide an exceptional customer experience that converts them into repeat buyers.
Visitor behavior on your website serves as a valuable source of insights at every stage of an eCommerce funnel. What makes or breaks the deal for your business depends on insights that you must optimize to improve their shopping experience and conversion rate.
Download Free: Website Heatmap Guide
Most marketers suggest using multiple qualitative and quantitative analytical tools to do so. However, not all of them have the prowess to give you the kind of information you would need to study user experience.
This is where heatmaps come into play.
What are heatmaps?
Heatmaps serve as one of the best qualitative tools to collect relevant customer data, especially in terms of understanding their actual behavior across your web platform.
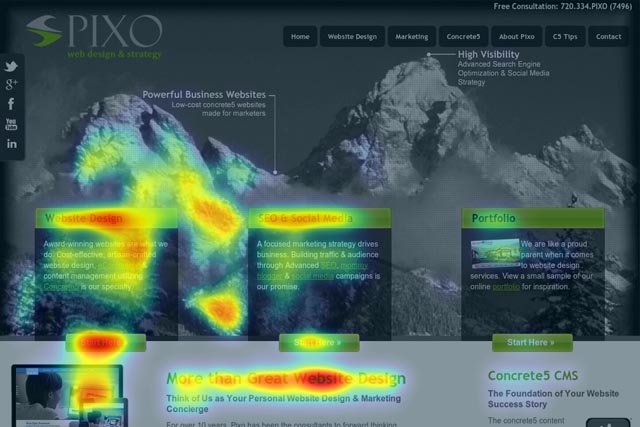
Think of heatmaps as X-ray films. They show a detailed picture (in the form of a graphical representation) of how users interact with your site or store. You can observe how far users scroll, where they click the most, and the products or pages they like or dislike.
Such data is precisely what you need to make your platform more user-friendly, drive more traffic, and improve your conversion optimization strategies.
But, if you think that any heatmap would work wonders for your e-commerce site, you’re absolutely wrong!
eCommerce websites are highly dynamic. They have more interactive elements and “behind login page” elements like orders, cart page, etc., than any other site. Such pages shed visitor interaction and information, which typically serve as the primary data for businesses to use to draw page performance conclusions, find elemental distractions, and improve overall customer experience.
This is where Dynamic Heatmaps save the day!
What are dynamic heatmaps?
Unlike static heatmaps, which can only be plotted on static web pages such as the Home Page, Product Pages, Landing Pages, Category Pages, etc., dynamic heatmaps give you the leverage of studying real-time customer behavior on pages that are beyond the scope of static heatmaps.
In other words, dynamic heatmaps can be easily plotted on live websites with dynamic URLs such as My Profile, Orders, Cart, Account Settings, etc., to gather in-depth customer activity data.
A typical dynamic heatmap offers four primary features: click maps, scroll maps, click areas, and element lists. Each of these allows you to look at a web page’s hot spot areas in a detailed manner.
What are the uses of dynamic heatmaps?
1. Accuracy
Dynamic heatmaps offer more up-to-date insights compared to static heatmaps. You get real-time data reflecting current user behavior. This keeps you informed about the changing user preferences before you make any website changes.
2. Real-time insights
You get immediate visibility into user behavior as it occurs to monitor and analyze user interactions in real time. This allows for prompt identification of trends, issues, and opportunities, facilitating timely adjustments to optimize user experience and website performance.
3. Personalization support
These heatmaps help personalize user experiences by analyzing real-time interactions. For instance, if users show interest in a product carousel, further content or recommendations can be personalized to match users’ interests.
Let’s now understand the scope of dynamic heatmaps for eCommerce using some examples!
Example of dynamic heatmaps on different eCommerce pages
Studying cart page insights using dynamic heatmaps
The image below gives us an insight into a dynamic heatmap plotted on an eCommerce site’s cart page. It shows that in general, most people, after adding products to their cart, click on the product image, cancel button, postcode section, ‘Go To Checkout’ icon, and discount codes.
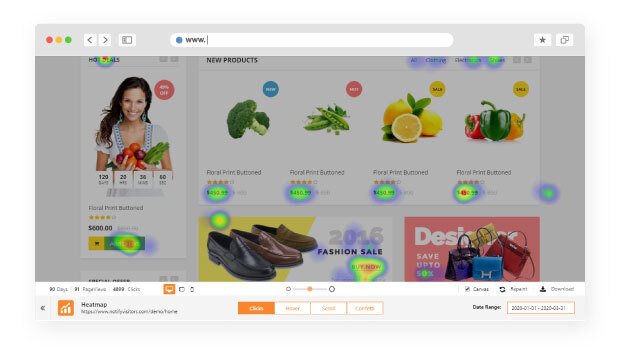
Such information helps you draw multiple conclusions. Some of these are as follows:
- Customers might want to see the product images once more before proceeding to the final payment gateway.
- They may not like their chosen product(s) and remove the item(s) from the cart. Or, since they cannot view the product image (in Zoom) on the cart page, they abandon their cart.
- They’re most interested in availing discounts. Therefore, the area is hotter than other page elements.
Furthermore, such information also serves as helpful in drawing hypotheses on how to improve the performance of various page elements with dynamic URLs, meanwhile finding the proper means and ways to enhance customer experience and increase your conversions.

Download Free: Website Heatmap Guide
Studying order page insights using dynamic heatmaps
The “My Orders” page of an eCommerce site is an important page that is less explored in terms of gathering customer behavior data.
The page allows users to look at their current and previous orders, check delivery status, seek assistance, and even browse through their history. As an eCommerce company, plotting heatmaps on such pages and mapping the number of clicks can significantly help you study which page elements are fetching you maximum customer attention.
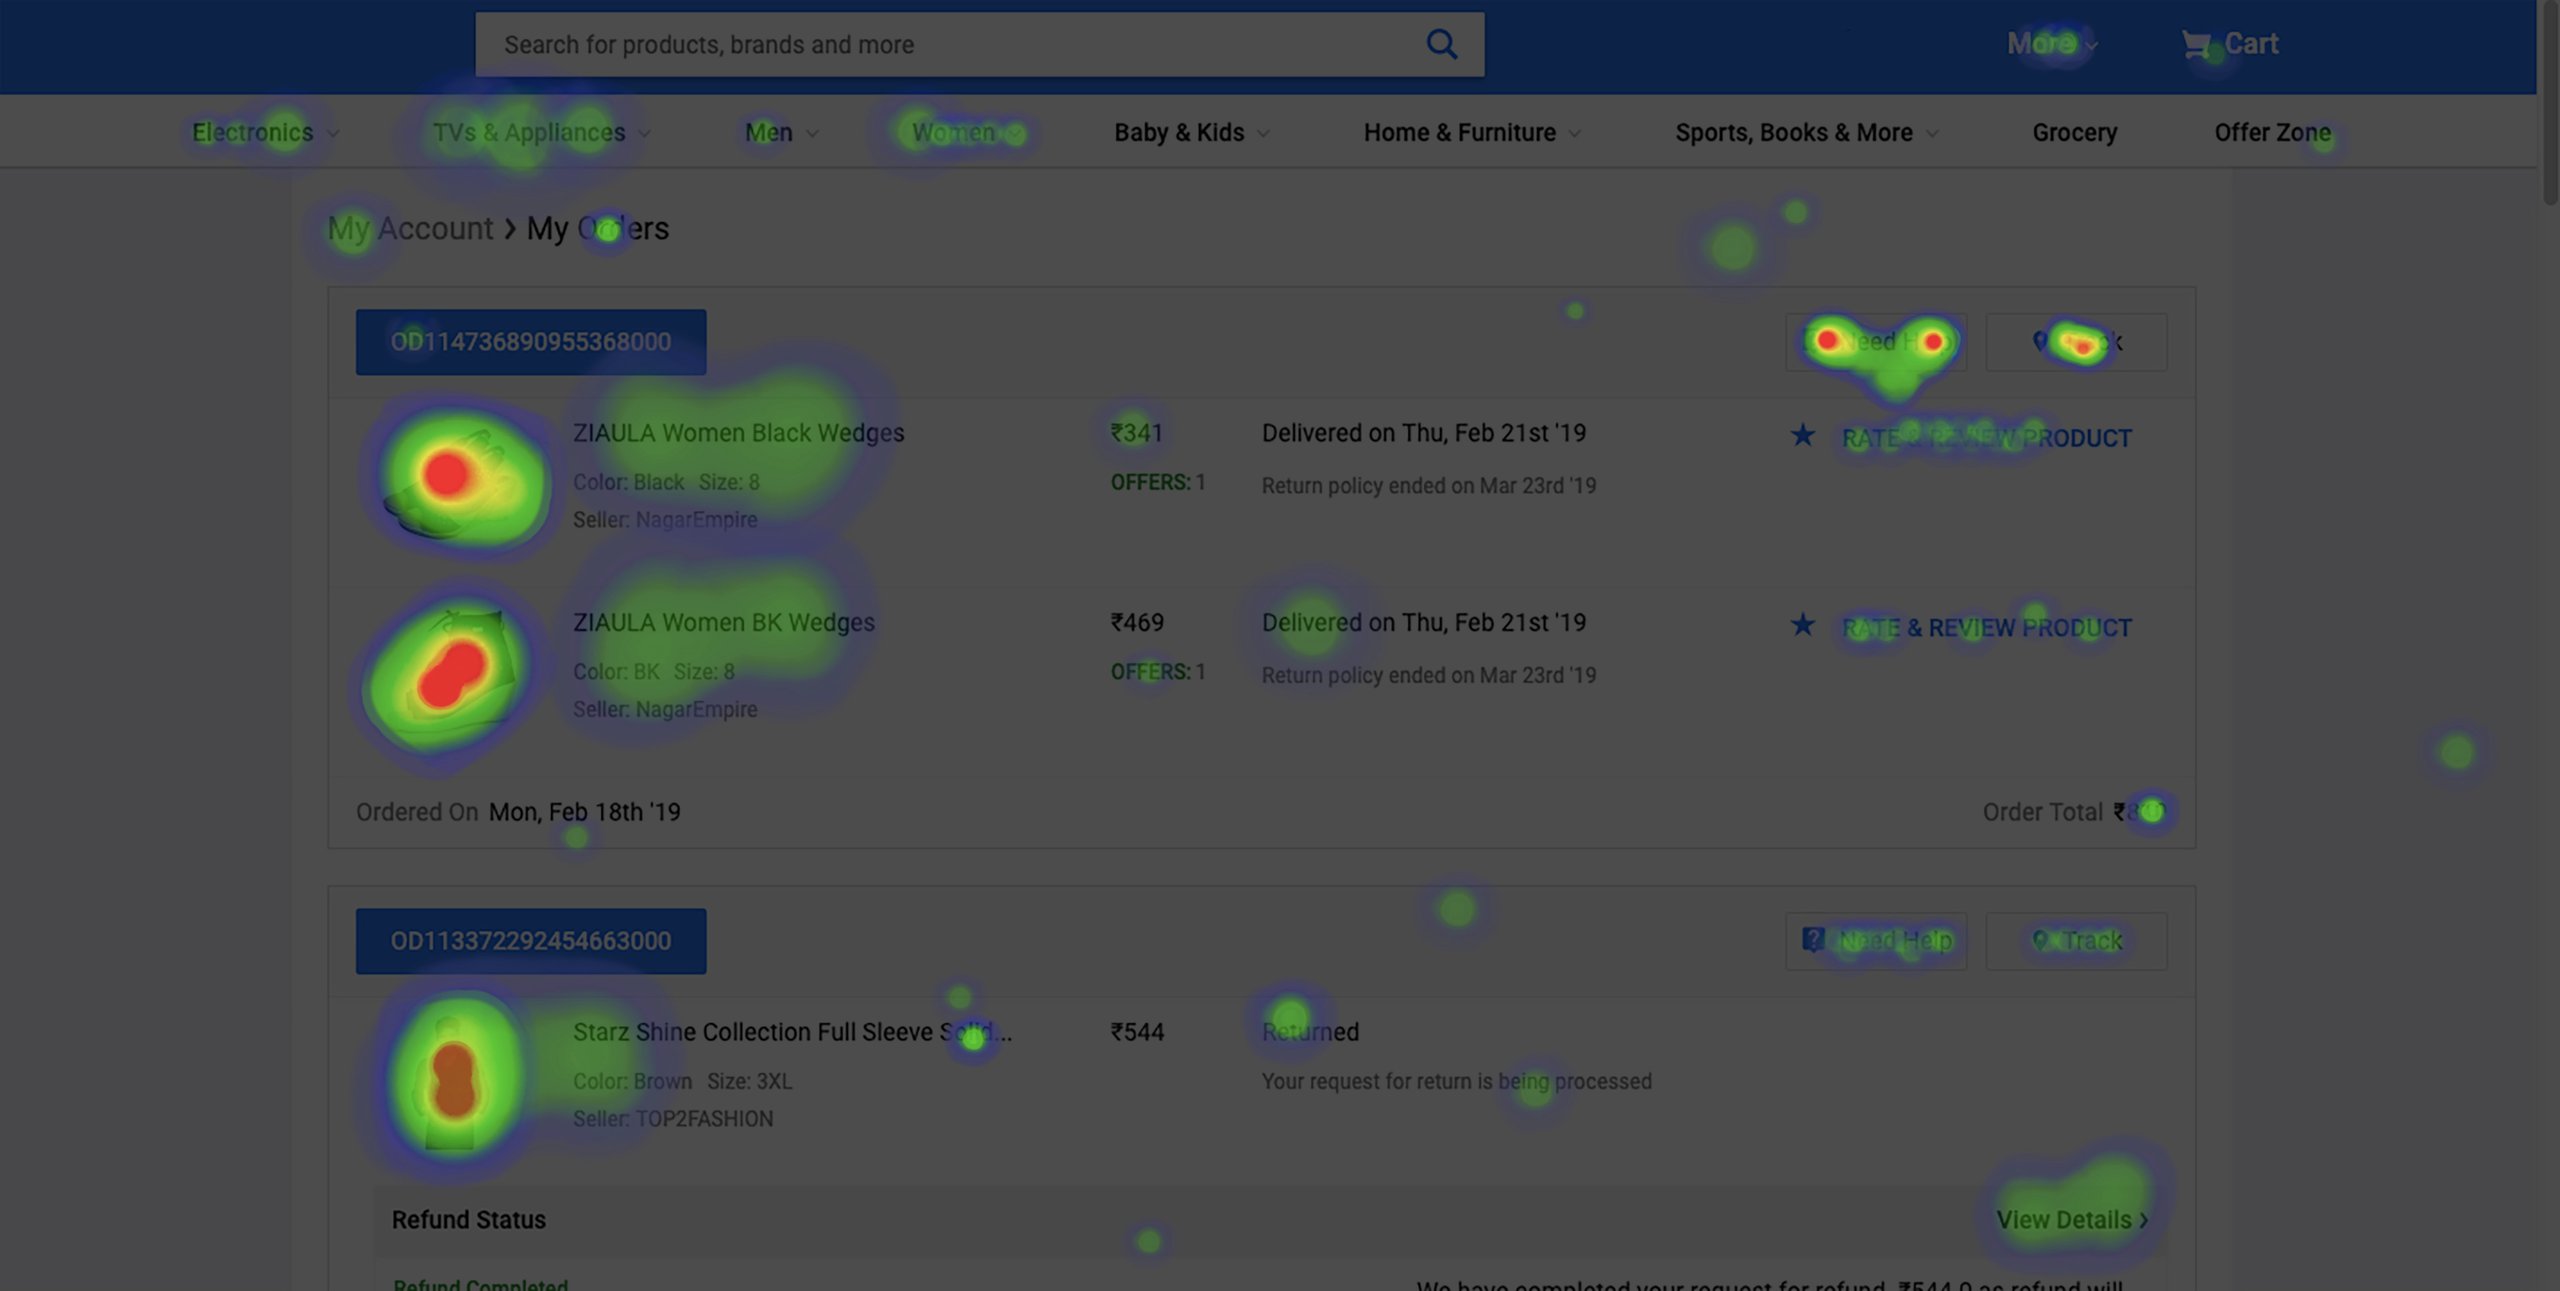
For example, the above-plotted heatmap shows that most clicks are observed on the “Track” icon followed by “Need Help” and product images. They’re hardly clicking on the “Rate & Review Product” icon, which, according to your platform, can be an important form page to seek product reviews and other essential information. You can further use such qualitative data to make necessary amendments and compel customers to fill the form, like adding product review pop-ups or call-to-action buttons on the Order page, making the section omnipresent, giving rewards for adding reviews, and so forth.
How to get started using dynamic heatmaps?
Identify the key pages on your website
Start by determining which pages on your website are most crucial to your business objectives. This is a good way to begin using dynamic heatmaps on your website.
These may include the homepage, product page, landing page, or checkout page. Focusing on these pages ensures that your initial efforts have the highest impact on user experience and conversion rates.
Sort website areas based on engagement rate
Once you have identified the key pages, find out the areas of these pages that receive the most and least visitor engagement. Look for hotspots where users are clicking the most and also identify areas that do not receive as much attention.
This can provide insights into what content or elements are drawing the most engagement and whether they align with your conversion goals.
Study visitor behavior at different stages of your conversion funnel
Analyze every stage of your conversion funnel and track visitor behavior from the initial visit to the final conversion step.
Identify where users are dropping off or getting stuck and investigate the potential reasons. Look at the performance of crucial CTAs, the way they navigate, and where they drop off.
By pinpointing friction points, you can make targeted improvements to guide visitors smoothly through the funnel.
Look for common trends or patterns in visitor interactions
Identify recurring patterns in how visitors interact with your website. Look for trends such as frequently clicked buttons, often ignored elements, or common navigation paths.
Understanding these patterns can help you identify what works well and what needs improvement. For example, if users consistently click on non-clickable elements, consider making them interactive or replacing them with other important elements.
Recognizing and leveraging these patterns allows you to improve visitor engagement and build a positive website experience.
Pinpoint elements or areas that cause distraction
Look for areas or elements that distract visitors from their main conversion goals. These could be unnecessary links, overly prominent ads, or any elements that do not contribute to the visitor’s journey.
By reducing these distractions, you can create a more focused and streamlined experience, helping users stay on track toward conversion.
Watch this video if you’d like to understand more about VWO heatmaps and heatmap reports.
Dynamic heatmaps can give you much more qualitative, in-page data, which typically other analytical tools fail to match. Every page, every click tells a story, and there’s something to learn from every story if you listen carefully!
So now that you know what your static heatmap tools are lacking, it’s time to upgrade your eCommerce platform with VWO’s dynamic heatmaps and make the most of them.

FAQs on Dynamic Heatmaps
Dynamic heatmaps are heatmaps that are plotted on live websites with dynamically generated URLs such as Profile, Orders, Cart, Account Settings, etc. to gather in-depth visitor activity data.
eCommerce stores use dynamic heatmaps to gather insights from the interaction of the visitors on their dynamic content web pages such as the order page or the checkout page, to identify common patterns.



![Top 10 Shopify Heatmap Apps [With Features – 2025]](https://static.wingify.com/gcp/uploads/sites/3/2020/04/Feature-image_Shopify-Heatmaps-All-you-need-to-know.png?tr=h-600)

