

Marketers can map the performance of their campaigns from various data sources. Most often this leads to them being overly obsessed with metrics. But, not all numbers penned on paper help derive accurate conclusions. This is where qualitative information about visitor behavior helps to connect the missing dots in user research.
Qualitative tools, such as website heatmaps, give you richer insight into the actions performed by visitors on your website. They inform you about the path visitors take on your platform, the way they interact with your site’s content, the elements they like the most, and where they bounce off. This information about your users can help you make informed decisions about UI/UX changes on your website.
Download Free: Website Heatmap Guide
This blog delves into how heatmaps, as a qualitative research tool, can help map the performance of your website’s five prominent pages, namely – home page, landing page, product page, blog page, and checkout page, to help you uplift conversions.
But before that, let’s first understand the basics of heatmaps.
What is a heatmap?
A heatmap is a smart, analytical tool that uses a system of color codes to graphically represent different values of a web page. It allows marketers to analyze different page elements in the form of colored visuals and see which areas are getting maximum traction. This heatmap, for instance, shows page areas where visitors are clicking the most.
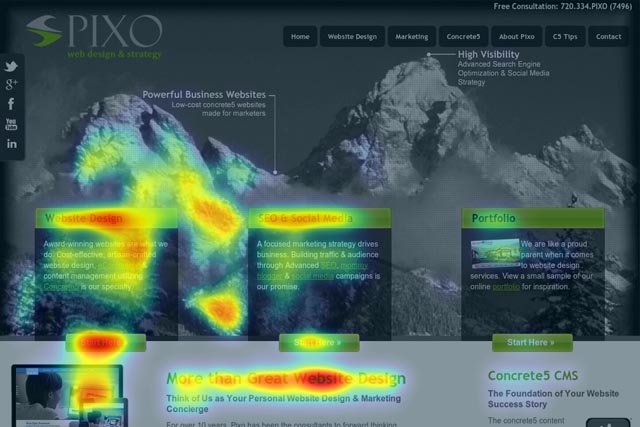
While the “hot” sections in red and orange color represent maximum user attraction, the “cold” sections, typically highlighted in shades of blue and green, show areas where they visit the least.
Think of heatmaps as a visual storytelling tool. They create a beautiful picture with the help of special tracking scripts. These scripts indigenously interact with different page elements and record every move made by a visitor on a web page, and represent this data in the form of visuals.
In a nutshell, heatmaps help find:
- Page elements that are getting maximum and minimum visitor attention.
- Whether important page elements, such as CTAs, banners, etc. are in their prime position.
- Elements on your website that distract the visitor.
VWO’s free AI-powered heatmap generator enables you to predict how visitors interact with your web page. It allows you to take effective optimization steps by gauging bottlenecks based on user experience.
Five critical web pages where the use of heatmaps is a must
One of the most effective ways to use heatmaps on your website is by incorporating them on the pages that get the maximum visits, highest average view/reading time and your conversion pages.
These pages are as follows:
1. Home page
Your home page typically defines your brand’s identity. Constantly monitoring the sections of your homepage using heatmaps can help you see if:
- Visitors can use your internal site search to reach their desired destination.
- Page categories are well organized for a new user to navigate to the page/product she is looking for
- Your brand USP is communicated immediately and is drawing users’ attention
- Homepage images (such as hero banners, featured products, etc.) are in their prime spot and unmissable by website visitors
Such in-depth information aids in understanding if your homepage elements are contributing to your main objective – reducing bounce rate and driving new users into your conversion funnel.
2. Landing pages
These are crucial pages where visitors enter your conversion funnel. Analyzing the performance of such pages using heatmaps can help you understand if your:
- Page content is effective enough to influence a visitor’s decision.
- Navigation menu is well-placed and omnipresent to ensure visitors do not drop off in the middle of their search.
- Demo images/videos are influencing visitors and propelling them to take the desired action.
- Call-to-action buttons are clear and concise, and visitors are clicking on them.
Knowing what draws the attention of your visitors can assist in making necessary amendments to fuel conversions.
Software company Bandwidth was looking to improve the visit to lead conversion rate of one of their product pages. Using heatmaps, they were able to figure out low-engagement areas on the page. They decided to improve the page’s hero image and supplement it with crisp content. These changes helped them achieve a 12% visit to lead conversion uplift.
3. Blog pages
Textual content and placement of CTAs on blog posts can heavily influence your conversion rate. Heatmaps enable you to analyze:
- Whether visitors like your blog posts
- Page elements that may be distracting the visitors
- Smart ways to declutter the page to make important elements, such as CTAs, clearly visible
- Visitor behavior. Are they scrolling till the end or bouncing off in between?
- If you need to add extra elements to keep the visitors hooked
For instance, even though HubSpot’s end-of-post banner CTAs are visually appealing, they found that their blogs were only generating a small number of leads. HubSpot then decided to integrate heatmaps and look for loopholes. They discovered that placing their anchor text CTAs just below a blog post’s introduction paragraph instead of placing them at the end, helped them generate more blog leads. This is because the CTA grabbed more attention at the beginning of the post and not at the end.
Download Free: Website Heatmap Guide
4. Product pages
The quality and content of a product page can make or break a deal for your business. Heatmaps allow you to study many critical aspects of your page elements and how they interact with your visitors. They help you find out –
- If the product descriptions are influencing your visitor’s buying decisions.
- If the product prices are prominently visible to the customers.
- If your visitors are focusing their attention on product images and demo videos.
- If any elements may distract your visitors, such as pop-ups, etc.
- If your CTA is catchy enough to attract customers.
- If the overall structuring of your page is good to go or needs changes.
5. Checkout pages
Heatmaps on checkout pages can give you insights on how and why visitors are bouncing off at the last stage of the conversion funnel. They tell you about:
- The page elements that are distracting your visitors from completing their purchase.
- The performance of page buttons. For instance, if the “Make Payment” button is not working properly.
- The form present on the page is too lengthy and complicated for visitors to fill out and proceed.
- Clickable elements that users are not able to figure out and vice versa.
Heatmaps are a visual representation of actions users take on your website. It is a powerful tool to develop insights about user behavior on your pages. The observations from heatmaps can help you adapt an optimization strategy that helps you reduce bounce rate and improve conversions.
Jon MacDonald, Founder and President, of The Good, uses heatmap data from real websites and shares insights that marketers tend to miss out on in the video below.

FAQs on Website Heatmap Analysis
Yes, heatmaps can be used on any sort of page. Home page, product pages, blog pages, landing pages, and checkout pages should be your top focus for data analysis through heatmaps.
Using heatmap analysis, you can discover how visitors are interacting with essential website elements such as CTAs, form fields, headings, carousels, product descriptions, and more.
Categories:


![Top 10 Shopify Heatmap Apps [With Features – 2026]](https://static.wingify.com/gcp/uploads/sites/3/2020/04/Feature-image_Shopify-Heatmaps-All-you-need-to-know.png?tr=w-300,h-150)


