
Follow us and stay on top of everything CRO
Read summarized version with
Have you ever wondered how visitors navigate your website? While heatmaps are a familiar concept, scroll maps are emerging as a crucial tool for user behavior analysis.
These powerful analytics tools offer unique insights into how users interact with your content, potentially unlocking new ways to improve your site’s performance.
Heatmaps help marketers and designers understand user behavior, providing data on various interactions. Scrollmap data reveals how far visitors scroll and where they focus on a page.
Let’s explore why scrollmaps matter and how they can enhance your web design and content strategy. Understanding scrolling patterns could be key to optimizing engagement and achieving your online goals.

What are scrollmaps?
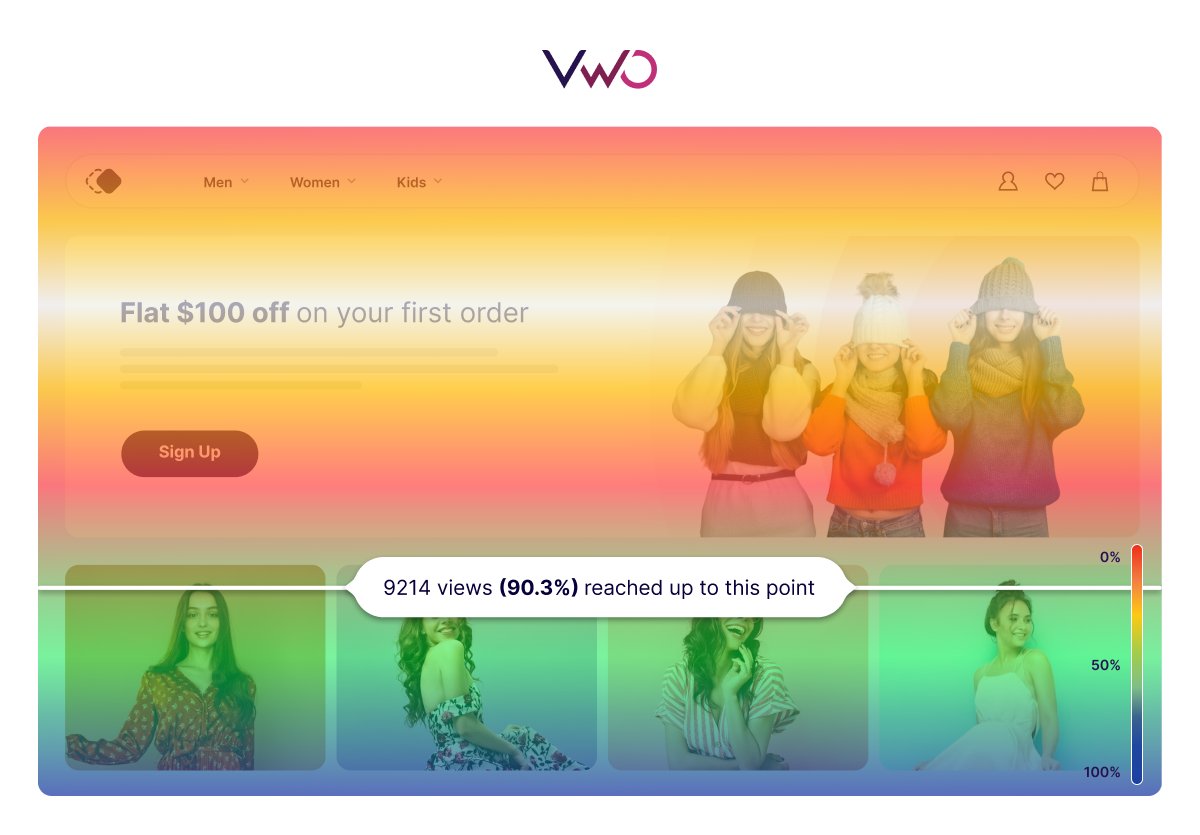
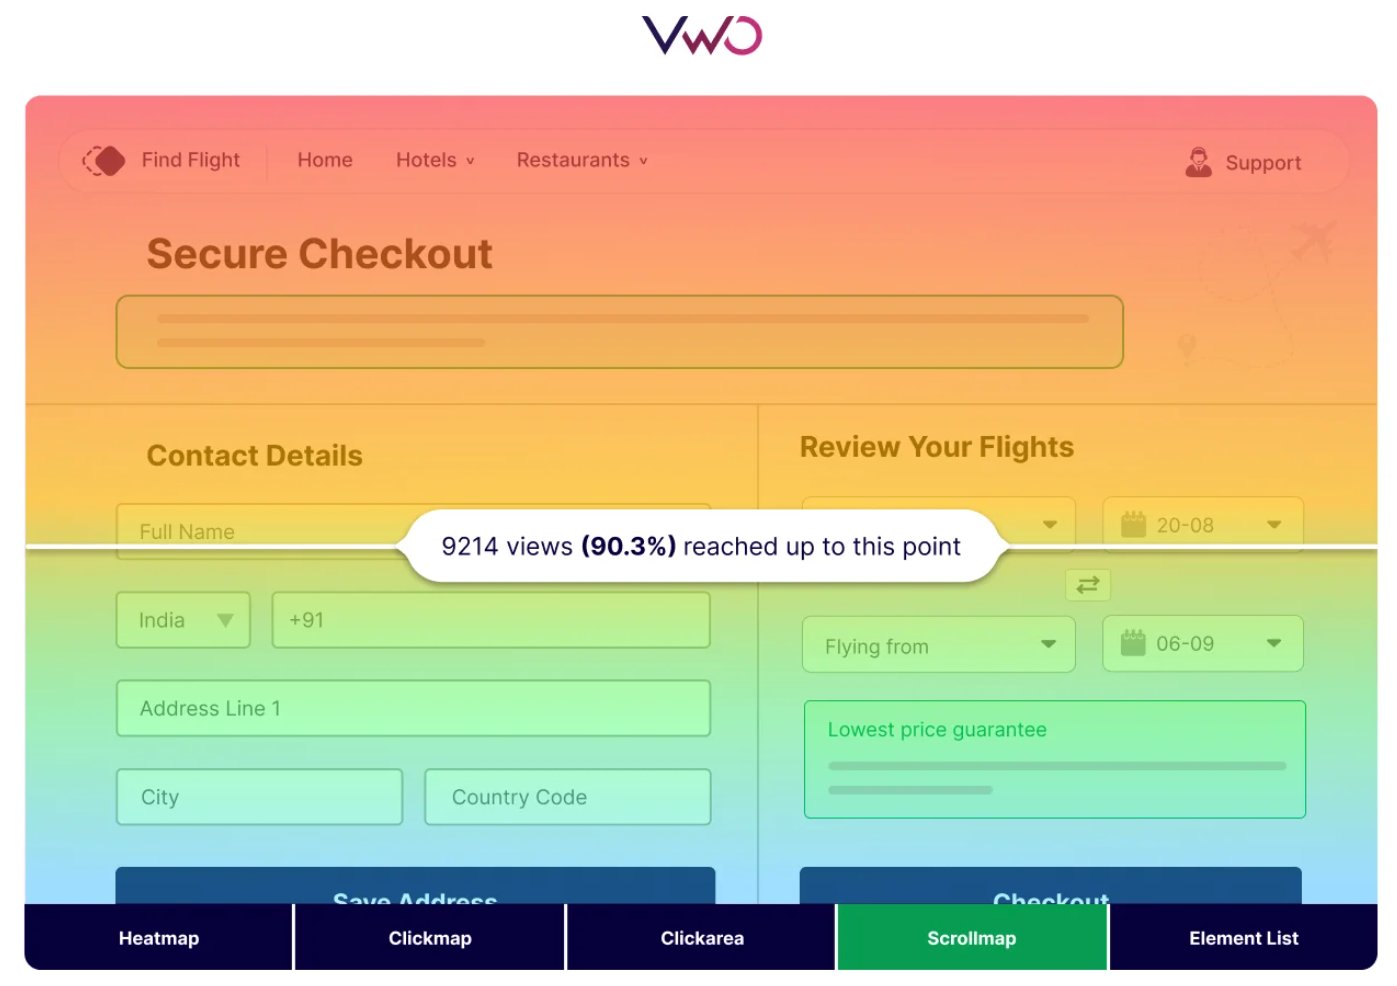
Scrollmaps, also called scroll heatmaps or scroll reach heatmaps, are visual representations of how far users scroll down a webpage. These tools provide invaluable insights into user engagement and content visibility by displaying color-coded data that indicates the percentage of users who reach different parts of a page.
A typical scroll heatmap uses a color spectrum to represent user behavior:
- Red areas indicate the highest visibility, where most users have scrolled to and viewed the content.
- Yellow and green areas show moderate visibility, with fewer users reaching these sections.
- Blue areas represent the least viewed parts of the page, where only a tiny percentage of users have scrolled.
By analyzing a scrollmap, website owners and UX designers can identify:
- The “fold” or the point where users typically stop scrolling
- Which sections of the page receive the most attention
- Areas of the page that users rarely reach
- How different types of content affect scrolling behavior
Understanding these patterns allows for data-driven decisions in content placement, design adjustments, and overall user experience improvements.
Scrollmaps vs. heatmaps
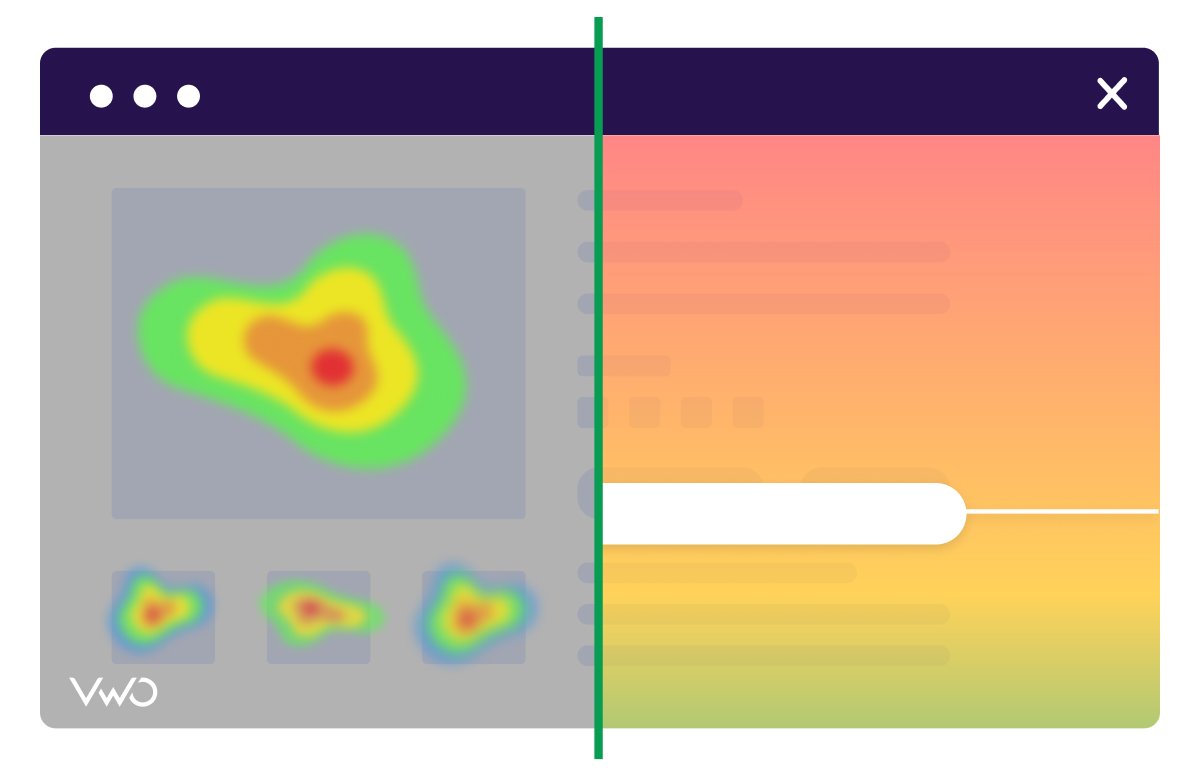
While scrollmaps and heatmaps are both valuable behavior analytic tools, they serve different purposes and provide distinct insights:
Scrollmaps
- Focus on vertical scrolling behavior
- Show how far down the page users typically scroll
- Indicate the percentage of users who view different sections of a page
- Help identify where users lose interest or abandon the page
- Assist in optimizing content placement and page length
Heatmaps
- Display areas of a page where users click, move their mouse or tap (on mobile devices)
- Show both horizontal and vertical interaction patterns
- Highlight specific elements that receive the most attention
- Help identify which buttons, links, or images are most engaging
- Provide insights into overall user interaction with page elements
| Key Differences | Scrollmaps | Heatmaps |
| Data Focus | Specifically, track scrolling behavior, showing how users navigate a webpage’s vertical space. | Capture a broader range of user interactions, including clicks and mouse movements. |
| Insight Types | Provide insights into content visibility and user reach. | Highlight engagement hotspots and interaction patterns. |
| Color Coding | Use a gradient to show scroll depth. | Use colors to indicate interaction intensity. |
While scrollmaps specifically track vertical scrolling behavior, heatmaps capture a wider range of user interactions across the page. When used together, these powerful visualization tools provide a comprehensive view of how users engage with your website.
By utilizing both scrollmaps and heatmaps, businesses can make informed decisions to create pixel-perfect user experiences and increase engagement. Understanding each tool’s insights and using this information to create more effective web experiences is critical.
How to use a scrollmap
To effectively use a scrollmap and extract actionable insights, follow these steps:
Identify key areas
Pinpoint crucial sections of your webpage for analysis, such as:
- Hero section or above-the-fold content
- Product information or critical features
- Call-to-action blocks
- Important content sections or lengthy articles
- Footer area
Set goals
Determine specific objectives for your scrollmap analysis:
- Increase conversion rates
- Reduce bounce rates
- Improve content visibility and engagement
- Optimize page length
- Create pixel-perfect user experiences across devices.
Install the scrollmap tool
- Choose a reliable tool like VWO for implementation
- Add the tracking code to your site
- Configure the tool to track your target web pages and page elements
- Set up any specific parameters or segments you want to analyze
Review the scrollmap visualization
1. Examine the color-coded representation of user scrolling behavior
- Identify areas where users are losing interest
- Spot “false bottoms” where users might think the page ends prematurely
- Determine the average “fold” for both desktop and mobile users
2. Identify patterns in how users behave with your content
- Analyze how users scroll to find information
- Assess differences in behavior between desktop and mobile users
- Detect opportunities to improve usability, such as adding filters to category pages
Use VWO Surveys to ask users, “What can we improve on this page?” to add qualitative depth to your scroll heatmap data and gain a more comprehensive understanding of user behavior.
3. Note where users spend the most time and where they’re likely to drop off
- Pinpoint sections where visitors are most likely to leave the page
- Use this data to find ways to optimize UX and increase conversions
- Optimize placement of critical content above the fold to boost engagement
Analyze results
Focus on these key metrics and insights:
- Scroll depth: Understand how far users typically scroll
- Scroll abandonment: Identify points where users tend to leave the page
- Engagement hotspots: Recognize areas that capture user attention
- Content visibility: Assess which sections are most and least viewed
- Device-specific behavior: Compare scrolling patterns on different devices
Identify opportunities for improvement
Based on your analysis, consider:
- Optimizing content placement for maximum visibility
- Adjusting page layout to encourage further scrolling
- Enhancing user engagement in underperforming sections
- Redesigning elements to retain user attention
- Addressing any device-specific issues
Make adjustments
Implement changes based on your findings, such as:
- Moving essential content higher up the page
- Redesigning page elements to improve engagement
- Adding engaging multimedia at strategic points
- Optimizing page length based on scroll patterns
- Improving mobile responsiveness if needed
Test different layouts
- Experiment with various page designs and content structures
- A/B test different versions to see how they affect scrolling behavior
- Consider testing elements like
- Content order and hierarchy
- Visual design and use of white space
- Placement of CTAs and critical information
Track changes over time
- Regularly review your scroll maps to monitor the impact of your changes
- Look for trends or shifts in user behavior
- Continuously refine your approach based on ongoing data
By systematically analyzing your scroll data and implementing changes based on the data, you can significantly improve user engagement and the overall effectiveness of your website. Remember that optimization is an ongoing process, and regular monitoring and adjustment are vital to maintaining a high-performing website.
How does a scrollmap help your website?
Scrollmaps offer a wealth of advantages that can transform your website’s performance and user engagement. By providing detailed insights into user scrolling behavior, scrollmaps help you make data-driven decisions to optimize your content and design. Here’s how scroll maps can benefit your website:
Optimize content placement
Scroll maps show which parts of your web page capture users’ attention and which areas are overlooked. This information lets you strategically position your most important content and calls-to-action (CTAs) in sections where they are most likely to be seen. By placing key elements where users are most engaged, you can maximize their impact, encourage deeper interaction with your site, and ultimately increase revenue through enhanced website personalization.
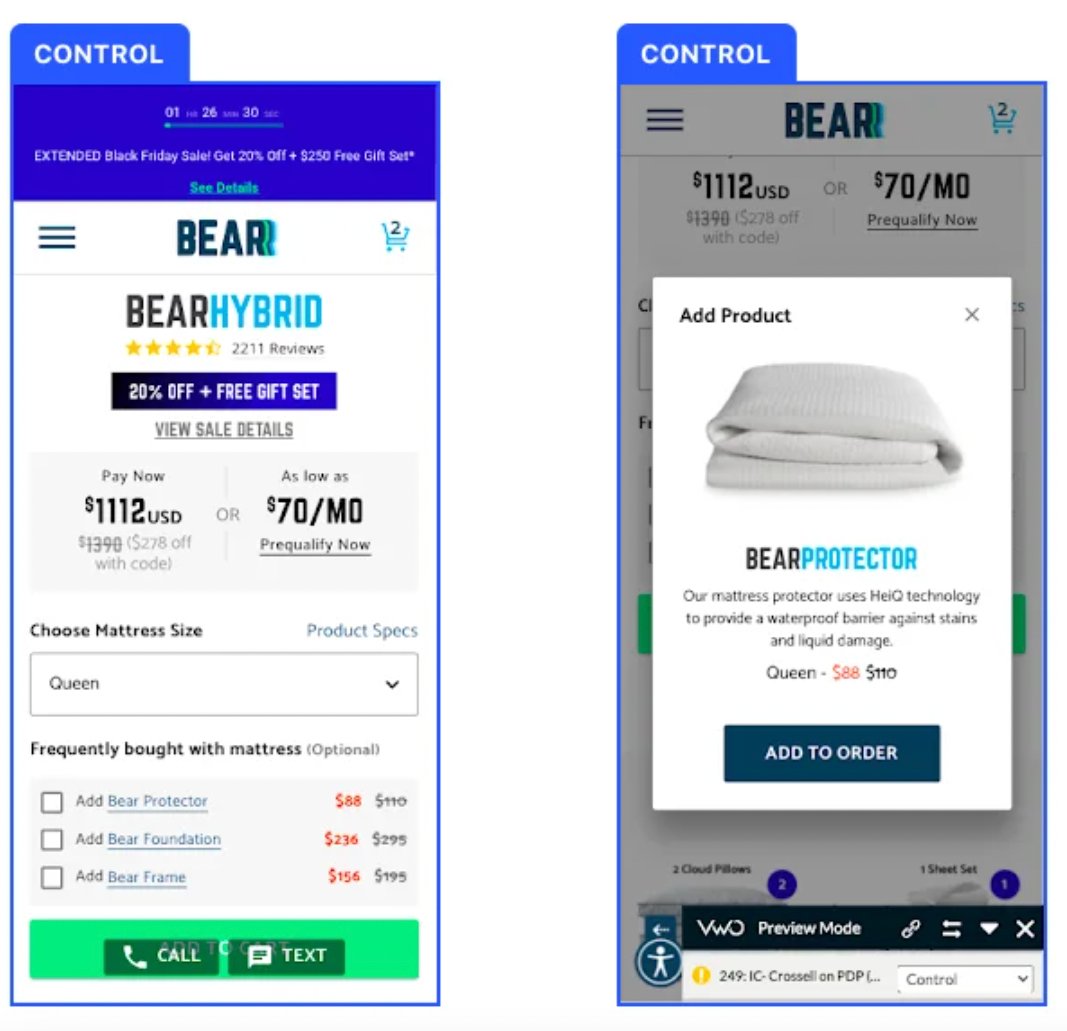
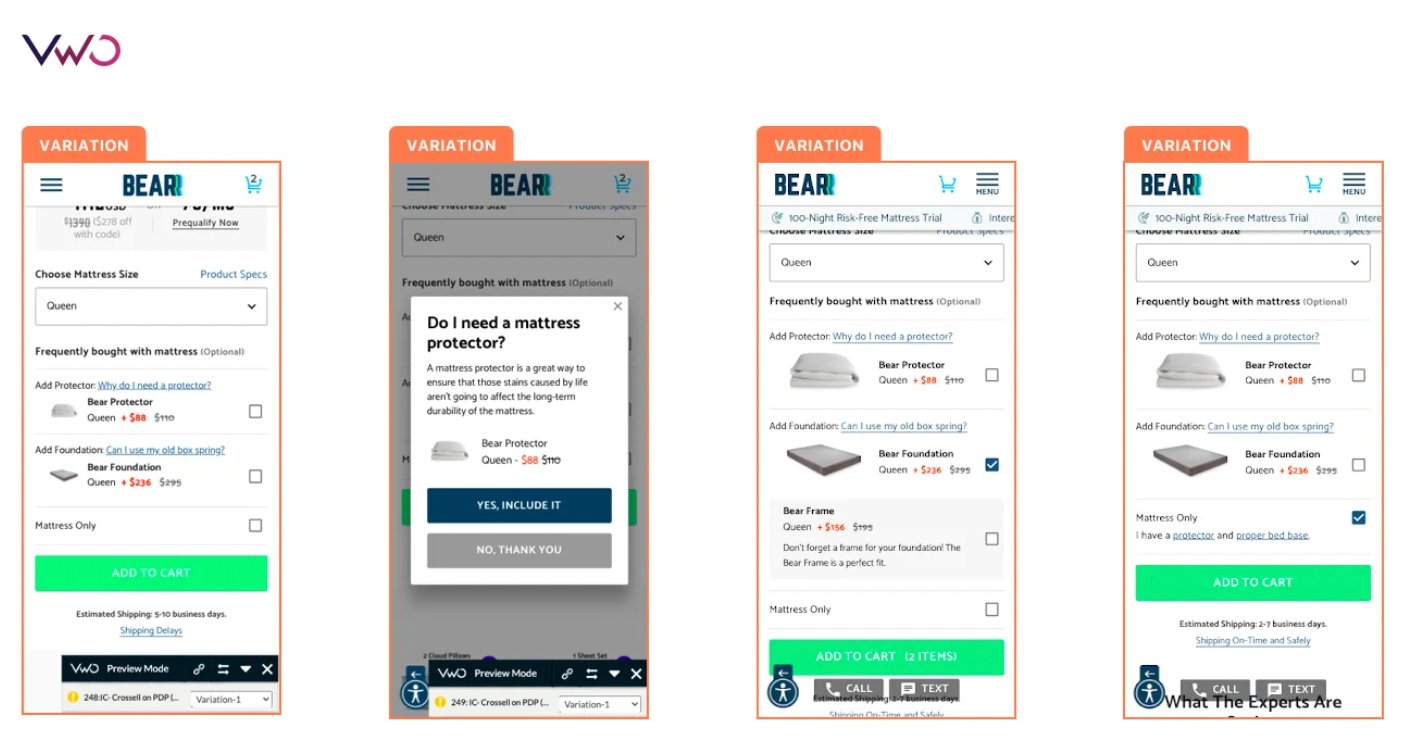
Data-driven design: How Bear Mattress used VWO heatmaps to boost sales and revenue
Bear Mattress partnered with VWO to enhance their website’s cross-sell flow, improving the ‘Frequently bought with the mattress’ section. By redesigning this section based on heatmap insights, including adding images and customer-centric copy, they achieved a 24.18% increase in successful purchases and a 16.21% revenue boost.
Enhance user experience
Understanding how users interact with your website enables you to make informed adjustments to the layout, structure, and content. These changes can create a more intuitive and enjoyable user experience, increasing conversions and customer loyalty. For example, if users consistently drop off before reaching vital information, you can restructure the page to present that information earlier.
Identify engagement trends
Scroll maps show patterns in customer behavior, such as common drop-off points or sections that consistently receive high engagement. This data can inform your content strategy, helping you create more compelling and relevant experiences for your audience. By recognizing which content resonates most with users, you can tailor your approach to more effectively meet their preferences and needs.
Optimize for mobile
Scroll maps are handy for understanding mobile user preferences, as they reveal how users interact with your website on smaller screens. This information is crucial for guiding your mobile optimization efforts and ensuring a good cross-device experience.
Addressing issues specific to mobile users, such as touch-friendly navigation and faster loading times, can improve overall accessibility and satisfaction.
Boost conversion rates
One of the most significant advantages of scrollmaps is their potential to boost conversion rates. You can identify the optimal placement for your CTAs and important content by analyzing scroll depth and user engagement. Ensuring that these elements are prominently displayed and easily accessible can lead to higher interaction rates and ultimately drive more conversions.
Additionally, minimizing user frustration and creating a smoother navigation experience can reduce bounce rates and increase the likelihood of visitors completing desired actions, such as making a purchase or filling out a form.
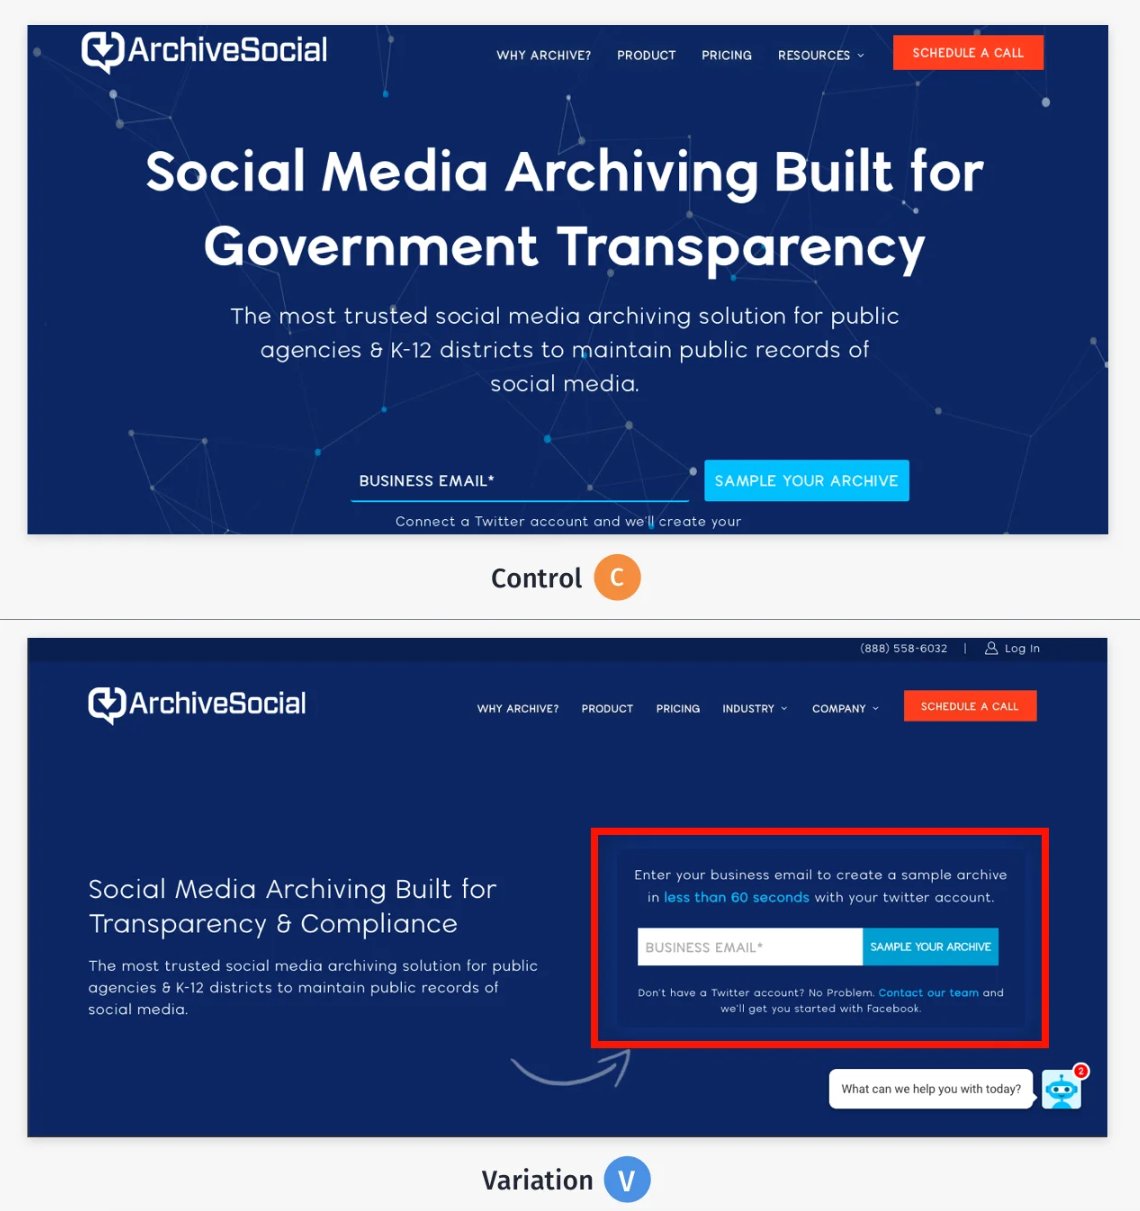
ArchiveSocial’s conversions soar with VWO scrollmaps and A/B testing
ArchiveSocial leveraged VWO for website optimization, achieving remarkable results. A/B testing increased CTA clicks by 101.68%, with VWO scrollmaps showing improved content exploration. They also boosted pricing page conversions by 64.76% and resource page traffic by 73.30%. These data-driven changes significantly enhanced their website’s overall performance.
How does a scroll map not help your website?
While scroll maps are handy tools, they have limitations that can impact their effectiveness. Here are some of the cons associated with using scroll maps:
Lack of context
Scroll maps provide valuable insights into user scrolling behavior but often need full context behind why users behave in a certain way. For instance, a high drop-off point might indicate a problem, but it needs to explain whether users leave because of uninteresting content, technical issues, or external distractions.
To gain a deeper understanding, additional qualitative research, such as user interviews or surveys, is necessary to uncover the underlying reasons behind user interactions.
Limited targeting
Scroll maps typically offer an aggregate view of user engagement across an entire website or specific webpage, which may not account for the nuances of different user segments. They may not provide detailed insights into the behavior of particular groups, such as new vs. returning visitors or various demographic categories.
This limitation can make it challenging to tailor optimizations that address different user segments’ unique needs and behaviors.
Potential data inaccuracies
The accuracy of scroll map data can vary depending on the implementation and the analytics tool used. Issues such as proper tracking code placement, browser incompatibilities, or complex user interactions can result in accurate data.
If not carefully validated, these inaccuracies might lead to misguided conclusions. It is crucial to recognize the potential for data discrepancies and validate findings with additional analytics methods.
Lack of actionable insights
While scroll maps provide a wealth of data, translating that information into meaningful, actionable insights can be challenging. The visual data from scroll maps show where users drop off or spend the most time, but it doesn’t always indicate the best action to address these issues.
Website owners and designers need a solid understanding of data interpretation and how to effectively apply these insights to their optimization strategies.
Overemphasis on scrolling behavior
Focusing too much on scroll maps might lead to overlooking other important aspects of user experience. These tools don’t capture interactions like clicks, form submissions, or time spent on specific elements. While scroll data is helpful, it’s just one piece of the user experience puzzle.
For instance, you might prioritize keeping content “above the fold” at the expense of providing comprehensive information that some users desire.
Balancing scroll optimization with other essential metrics and user goals is crucial for comprehensive website improvement.
VWO scrollmaps
Scrollmaps are an essential feature within VWO Insights, our user behavior analytics toolkit. They provide detailed insights into how users interact with your website, enabling you to make data-driven decisions to enhance user experience and boost conversion rates.
Critical features of VWO scrollmaps
Real-time data collection
VWO captures scrolling behavior as it happens, offering real-time insights that help you understand user interactions immediately.
Segmentation capabilities
Analyze scroll behavior based on user segments, such as traffic source, device type, or geographic location. This allows for a more granular understanding of how different audiences interact with your content.
Comparison tools
Compare scrollmaps across different periods or between variations in A/B tests. This feature helps you identify trends and measure the impact of changes on user behavior.
Integration with other VWO tools
Seamlessly combine scrollmap data with other heatmaps like clickmaps and features such as session recordings, surveys, and form analytics for a comprehensive analysis. This integration allows for a holistic view of user behavior on your website.
Cross-platform insights
VWO lets you view scrollmaps for desktop, mobile, and tablet visitors, offering crucial insights into user scrolling behavior across different devices. Understanding how users scroll on smaller screens can benefit effective mobile optimization.
Easy setup
VWO’s user-friendly interface makes setting up and analyzing scrollmaps simple. The intuitive design ensures that even those with limited technical expertise can utilize this tool effectively.
Export and sharing options
Easily share scrollmap insights with team members or stakeholders. VWO provides options to export data, facilitating collaboration and informed decision-making within your team.
Data privacy compliance
VWO adheres to GDPR and other privacy regulations, collecting anonymized scrollmap data. It offers tools for managing user consent and data retention, ensuring compliance with global privacy standards while providing valuable user behavior insights.
How to set up scrollmaps with VWO
To implement VWO scrollmaps, create an account and add the VWO SmartCode to your site. Then, create a heatmap campaign from the VWO dashboard, configure settings like target URL and audience segments, and launch. This process lets you collect scrollmap data to optimize your website’s user experience.
Use VWO Insight’s dashboard to track campaign performance
Once your campaign is live, use VWO Insight’s dashboard to monitor its performance. The dashboard provides various filters and options to analyze the data effectively. You can filter the data based on user segments, devices, geographic locations, and more to get a detailed view of how different groups interact with your content.
View scrollmaps
Scrollmaps are part of VWO’s heatmaps feature. To access scrollmaps:
- Navigate to the heatmaps section in the VWO dashboard.
- In the bottom navigation, switch to the “Scrollmaps” tab.
Switching to this tab will display the scroll depth data, showing how far users scroll down your pages.
Conclusion
Mastering scroll maps allows you to make informed decisions about your website’s design and content strategy, leading to an improved user experience and better overall performance. However, it’s important to remember that scroll maps are just one piece of the analytics puzzle.
To achieve the best outcomes, integrate scroll map data with additional analytics, user feedback, and A/B testing. This holistic strategy ensures your website stays user-friendly, engaging, and continually optimized for success.
Start your free trial with VWO today to see scrollmaps in action and experience their powerful insights firsthand!
FAQs
While both scroll maps and heatmaps use color coding to represent user behavior, they focus on different aspects of user interaction. Scroll maps show how far users scroll down a page, indicating which sections receive the most visibility. Heatmaps, on the other hand, display where users click, move their mouse, or tap on mobile devices, showing overall interaction patterns across the entire page.
Yes, most modern scroll map tools, including VWO Scroll Maps, can track scrolling behavior on mobile devices. This is particularly important given the increasing prevalence of mobile browsing. Mobile-specific scroll maps can provide valuable insights into how users interact with your site on smaller screens, helping you optimize the mobile user experience.
The duration of collecting scroll map data depends on various factors, including your website’s traffic volume and the level of statistical significance you’re aiming for. Generally, data collection for at least 1-2 weeks is recommended to account for daily and weekly variations in user behavior.
You should extend this period for lower-traffic websites to gather sufficient data. Always ensure you have a representative sample size before concluding your scroll data.


