

Adam Ruse, UI/UX designer at IMB Bank, a respected financial giant in Australia, spearheaded efforts to boost loan conversion rates through the bank’s website form. He dove deep into visitor behavior using heatmaps, funnel analysis, form checks, and session recordings. With a clear view of where users hit roadblocks, Adam and his team crafted tests to improve the user experience. And guess what? They knocked it out of the park with an 87% surge in loan conversions!
The above case study proves that behavior analysis is the cornerstone of conversion rate optimization, anchoring your efforts in data rather than guesswork. It’s the bedrock upon which successful experimentation is built, providing invaluable insights that drive measurable improvements in conversion rates. Thus, it is an inevitable part of a comprehensive CRO strategy.
However, does behavior analysis come with its fair share of challenges? Absolutely.
Behavior analysis can be time-consuming and arduous, particularly when dealing with vast amounts of sampled traffic. This labor-intensive aspect often compels many functions to scale back on behavior analysis due to bandwidth constraints—a silent struggle faced by many organizations.
But why is it so taxing? Let’s delve deeper into this aspect.

Diving in: The tedious aspect of behavior analysis
Let’s try to understand the challenge through a scenario, where a business’s website suddenly hits a snag in its conversion rates. The CRO team gets on high alert, eager to unearth the underlying cause using their trusty behavior analytics tool. But in the process of behavior analysis, here’s what it has to undergo:
a. Sift through each session recording
After pinpointing the consideration funnel stage, the CRO team delves into reviewing session recordings of those pages. Here’s a glimpse of the session recordings list it needs to scrutinize:
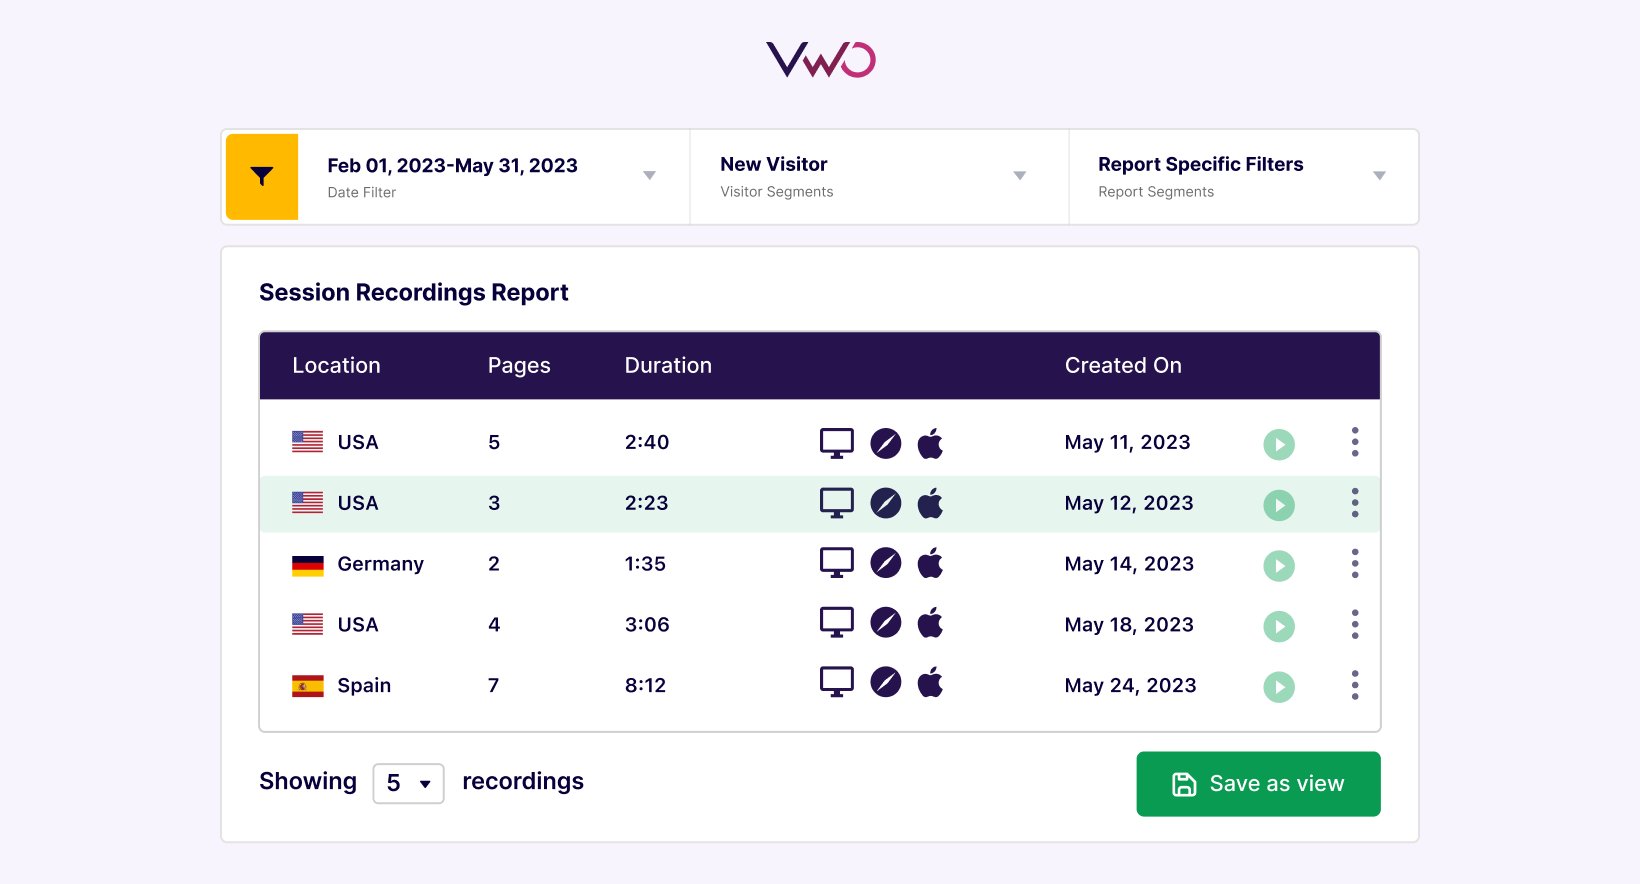
Reviewing such a comprehensive list to uncover mouse flow and click patterns demands a significant amount of time for CRO team members. They often find themselves rewatching sessions to ensure accurate conclusions.
It’s important to note that if the CRO identified multiple funnel stages, the task would become even more laborious. All of this complexity may increase the likelihood of missing crucial insights, impacting the later stages of the CRO campaign.
b. Read each survey response
In their quest to diagnose the issue, the team also implemented surveys to gather feedback from visitors about their experiences and areas of difficulty. Now that the responses are in, the team member responsible for surveys must sift through each response, particularly the open-ended questions, to identify common pain points or glean insights for future action.
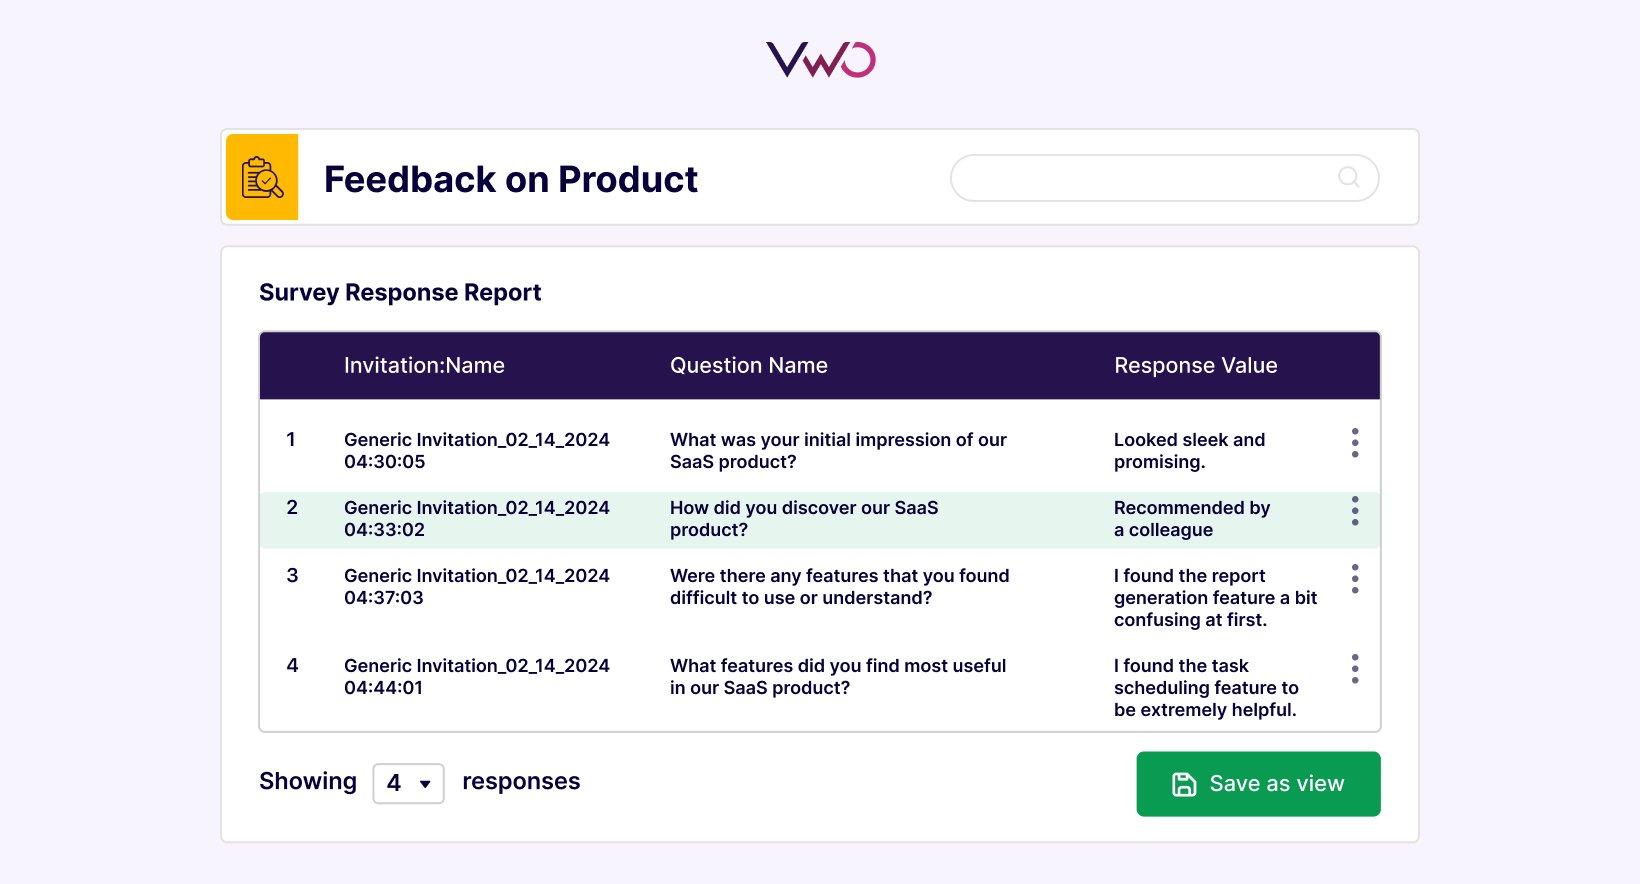
However, this process became incredibly burdensome as the responses flooded in, numbering in the hundreds. The CRO team member found juggling this task alongside the regular workload, making it all a bit challenging to manage effectively.
c. Perform the arduous task of periodic behavior analysis
Customer behavior is inherently dynamic, evolving over time. What was once a standout feature or website element may become outdated as user preferences shift. To stay abreast of these changes, the CRO team conducts quarterly audits, meticulously analyzing multiple pages at each sales funnel step to detect any shifts in mouse flow patterns.
This means delving into session recordings, heatmap reports, and form analytics for every stage of the funnel. Moreover, if there’s a new feature adoption or a significant overhaul in the current user experience, the team must once again undertake this exhaustive process or pinpoint underperforming pages through web analytics.
So you see, behavior analysis is a relentless cycle that demands constant vigilance to ensure continued optimization and alignment with evolving user behavior. But, is there a way to streamline this process and simultaneously stay attuned to evolving user behavior?
With the VWO Insights Dashboard, this dilemma becomes a thing of the past.
Solving the challenge with VWO’s Insights Dashboard
VWO Insights Dashboard consolidates all visitor behavior data into one convenient location, eliminating the need to analyze individual pages, funnel stages, or sift through countless session recordings.
But how?
Quantifying behavior analysis
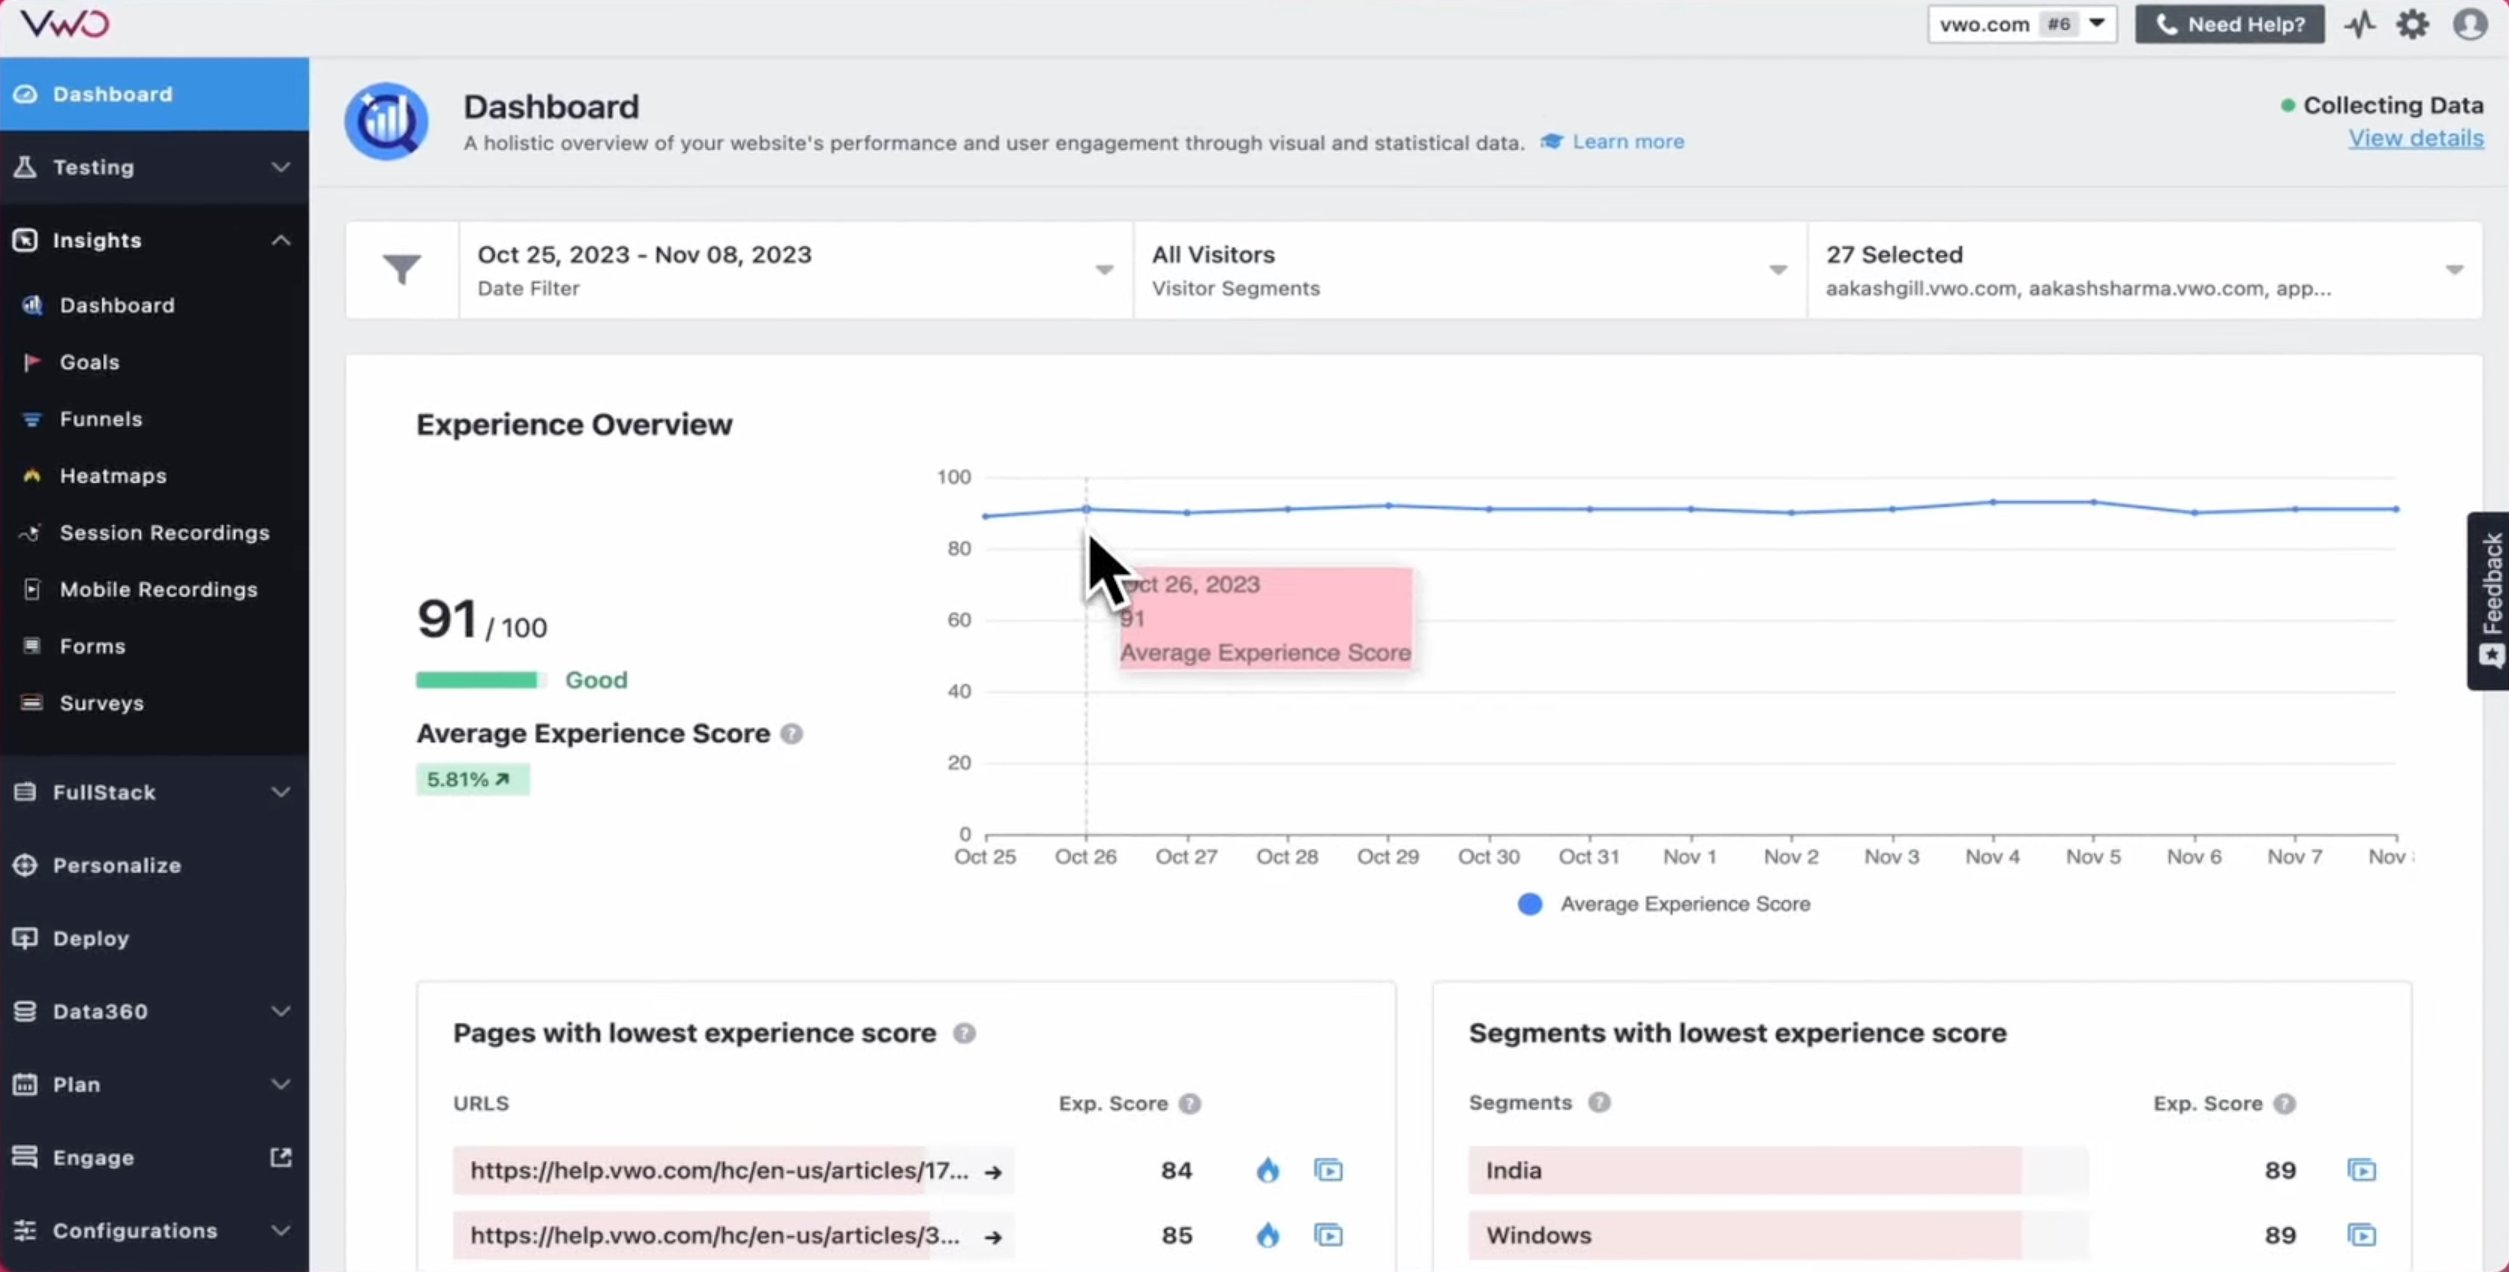
The Insights Dashboard employs a unique approach by quantifying behavior analysis through an experience score, graded on a scale of 0 to 100, where 100 signifies an optimal experience. This score is derived from various visitor interactions, such as dead clicks and rage clicks, providing a comprehensive overview of each page’s performance.
How does this help?
This feature eliminates the need to tediously sift through each page report, analyze them individually, and draw insights. Instead, you’re presented with a curated list of pages flagged with poor experience scores. This targeted approach allows you to focus your attention solely on pages that require optimization efforts, streamlining your workflow and maximizing efficiency.
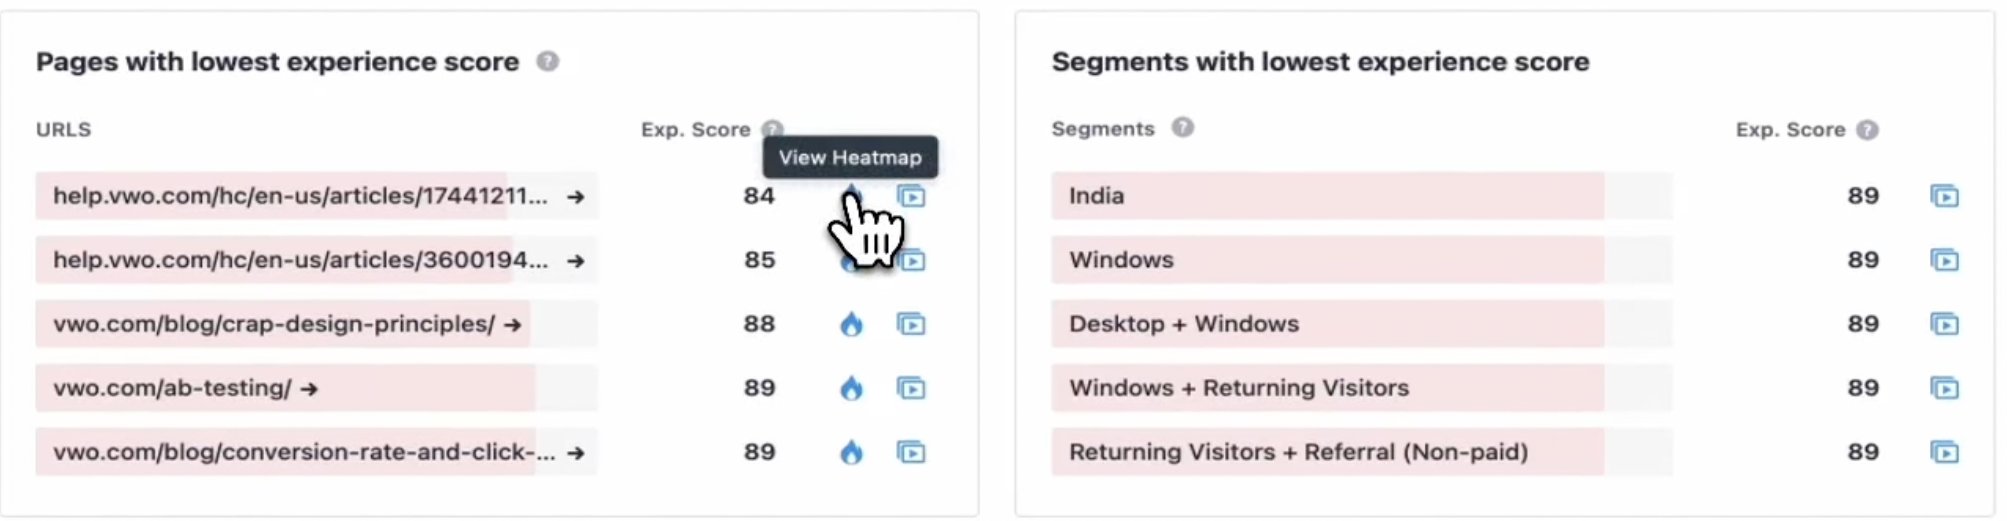
Adding to its capabilities, the feature also provides segment-level experience scores. For instance, if segments consisting of returning mobile visitors exhibit poor experience scores, you can dive into those specific session recordings for deeper insights. This strategic approach streamlines session recording analysis, allowing you to focus on areas that require immediate attention, rather than sifting through all recordings indiscriminately.
Furthermore, this quantification fosters internal clarity within your business communication. You can establish a percentage goal to enhance the user experience or present the numbers to senior management to illustrate the comparative quality of experiences across different pages.
Additionally, you can consistently monitor the user experience through the experience score graph, enabling instant identification of any declines. This facilitates precise analysis without the need for laborious periodic audits, making the process significantly less tedious.
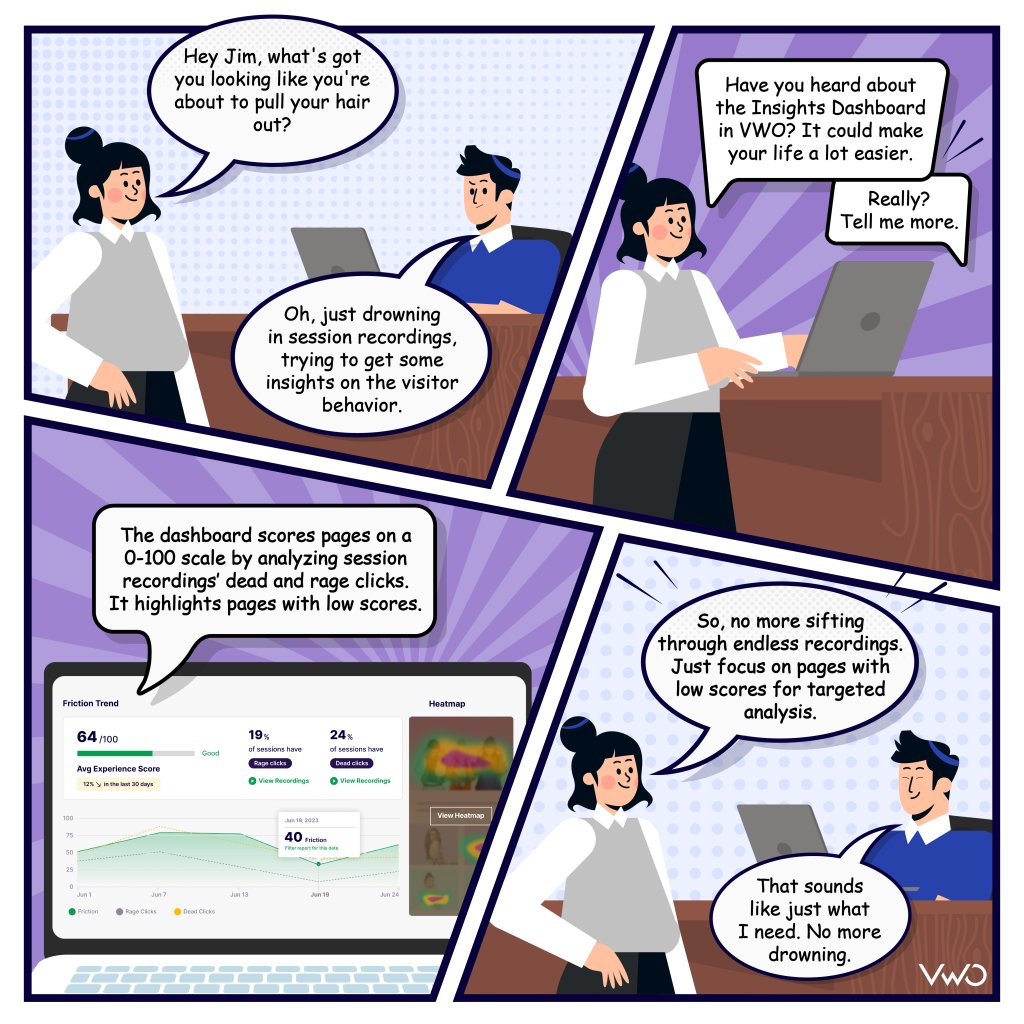
Check out this storyboard for a quick rundown on how the Insights Dashboard can work wonders for you!
But wait there’s more.
Making survey analysis a breeze
The Insights Dashboard allows you to see the performance of your two recent surveys. On the survey reports, you get a concise summary of the open-ended questions and responses with a word cloud and response list to identify patterns in them easily.
Therefore, there’s no need for a back-and-forth analysis of survey responses; everything is accessible from the same dashboard. You can also view the form analysis of the two recent forms on the dashboard.
So you see, VWO’s Insights Dashboard becomes a central hub for swiftly grasping visitor behavior nuances. Should there be any deviations, you can delve deeper into specific pages rather than analyzing everything, pinpointing areas for improvement more effectively and swiftly.
If you believe this could substantially enhance your visitor experience analysis, seize the opportunity to access a 30-day full-featured trial and witness its impact firsthand.
[Note: The Insights Dashboard is evolving to make behavior analysis more easy and swift. Stay tuned here for upcoming updates.]
To conclude
Behavior analysis stands as a pivotal component of conversion rate optimization, yet its labor-intensive nature often presents challenges for organizations with limited bandwidth.
Fortunately, VWO’s Insights Dashboard revolutionizes this process by centralizing all visitor behavior data, offering a streamlined approach to optimization. By consolidating data into one accessible platform, teams can efficiently identify areas for improvement and focus efforts where they are most needed.
Moreover, the dashboard’s innovative experience score quantification provides a holistic view of page performance, enabling organizations to adapt to evolving user behavior and drive tangible enhancements in conversion rates.
Categories:


![10 Best Enterprise Analytics Platforms [2026]: Expert Picks with Reviews and Comparisons](https://static.wingify.com/gcp/uploads/sites/3/2025/08/Feature-image-10-Best-Enterprise-Analytics-Platforms_-In-Depth-Reviews-and-Comparisons.jpg?tr=w-300,h-150)


