

Corey, a sneaker enthusiast, had one of the most disappointing website experiences.
In the pursuit of some trendy sneakers, Corey thought he hit the jackpot on an online fashion store. Everything seemed perfect – the ideal pair, the right price, you know the drill. However, that’s when things took a turn for the worse.
Upon clicking ‘Add to Cart,’ Corey confronted a dreaded account registration form. Numerous mandatory fields stared him in the face, and there was no quick option to log in with Google or Facebook. Given the morning rush, Corey wasn’t in the mood for a digital obstacle course. So, he decided to bail, thinking he’d just grab those sneakers from his usual store in the upcoming festive season.
As someone working hard to increase sales from your website, doesn’t it bug you that the e-commerce store missed out on a seriously promising lead? I mean, Corey visited from a search engine, so the SEO game was on point. Plus, he liked the sneakers and their pricing – total green lights for customer and product research. But then, bam, the website experience drops a red cross and just kind of ruins the vibe that other teams worked hard to build.
If you find yourself empathetic to the described situation and want to steer clear of a similar fate for your website, it’s time to consider diving into behavior analytics. Also, if you find yourself in the dark about the intricacies of user behavior analysis and how it could be a solution, then this blog post is for you.
We’re going to break down behavior analytics for you. We’ll start by introducing the concept, walk you through how it works as per business objectives, help you choose the right behavior-tracking tool, and why you should consider VWO for behavior analytics.
Let’s roll!
What is behavior analytics?
Behavior analytics involves systematically tracking visitor interactions with a website and its critical components. The goal is to gain insights into how the website is perceived and identify any pain points that visitors may encounter. For example, the online fashion store that Corey visited could analyze how he hesitated when faced with the sign-up form. This analysis serves as a foundation for devising potential solutions to the identified issues.
With behavior analytics, you can dive into the visitor activity, like mouse flow, clicking patterns, scrolling habits, moments of hesitation, and even instances of frustration. The results of this analysis are then compiled and presented visually, providing a more nuanced understanding of customer engagement and potential pain points. Behavior analysis can be done using heatmap, clickmap, scrollmap, form analytics, session recordings, and surveys.
Here is a short intro to each of these features in case it’s the first time you are reading these terms. Otherwise, you can move on to the next section.
- Heatmap: A heatmap is like a color-coded map showing where visitors click (hotspots in red) or don’t click (spots in blue) on a website. It’s a quick visual snapshot of what’s popular and what’s not.
- Clickmaps: This is a type of heatmap that visually displays where visitors click on your website. They show the click activity on different elements, such as CTA buttons, images, text, and URLs.
- Scrollmap: This is a type of heatmap showing how visitors scroll on a webpage. It highlights the average depth of scrolling and pinpoints visitors’ drop-off on the web page in terms of percentage (Like 25% drop-off at this point.)
- Form analytics: This tracks how visitors interact with your website forms. It reveals who completed, abandoned, or hesitated during form submissions and even provides the time visitors took to fill them out.
- Session recording: This is a feature that captures visitor actions, including clicks, mouse movements, and page scrolling, providing a playback of their journey across the website.
- Surveys: This enables you to collect insights on a specific page or entire website by conducting surveys and asking visitors questions about their experience.
Now, let’s delve into how you can gain insights into your customers’ experience through behavior analytics.
How to tap into customer experience with behavior analytics
To grasp how visitor behavior analytics can unravel the intricacies of your customers’ experiences, let’s take a journey akin to Corey at the fashion store to buy sneakers. We’ll construct a parallel experience for each stage of the funnel and then reconvene on the other side of the table to explore how behavior analytics can be instrumental in pinpointing potential friction points.
Top of the Funnel (ToFu):
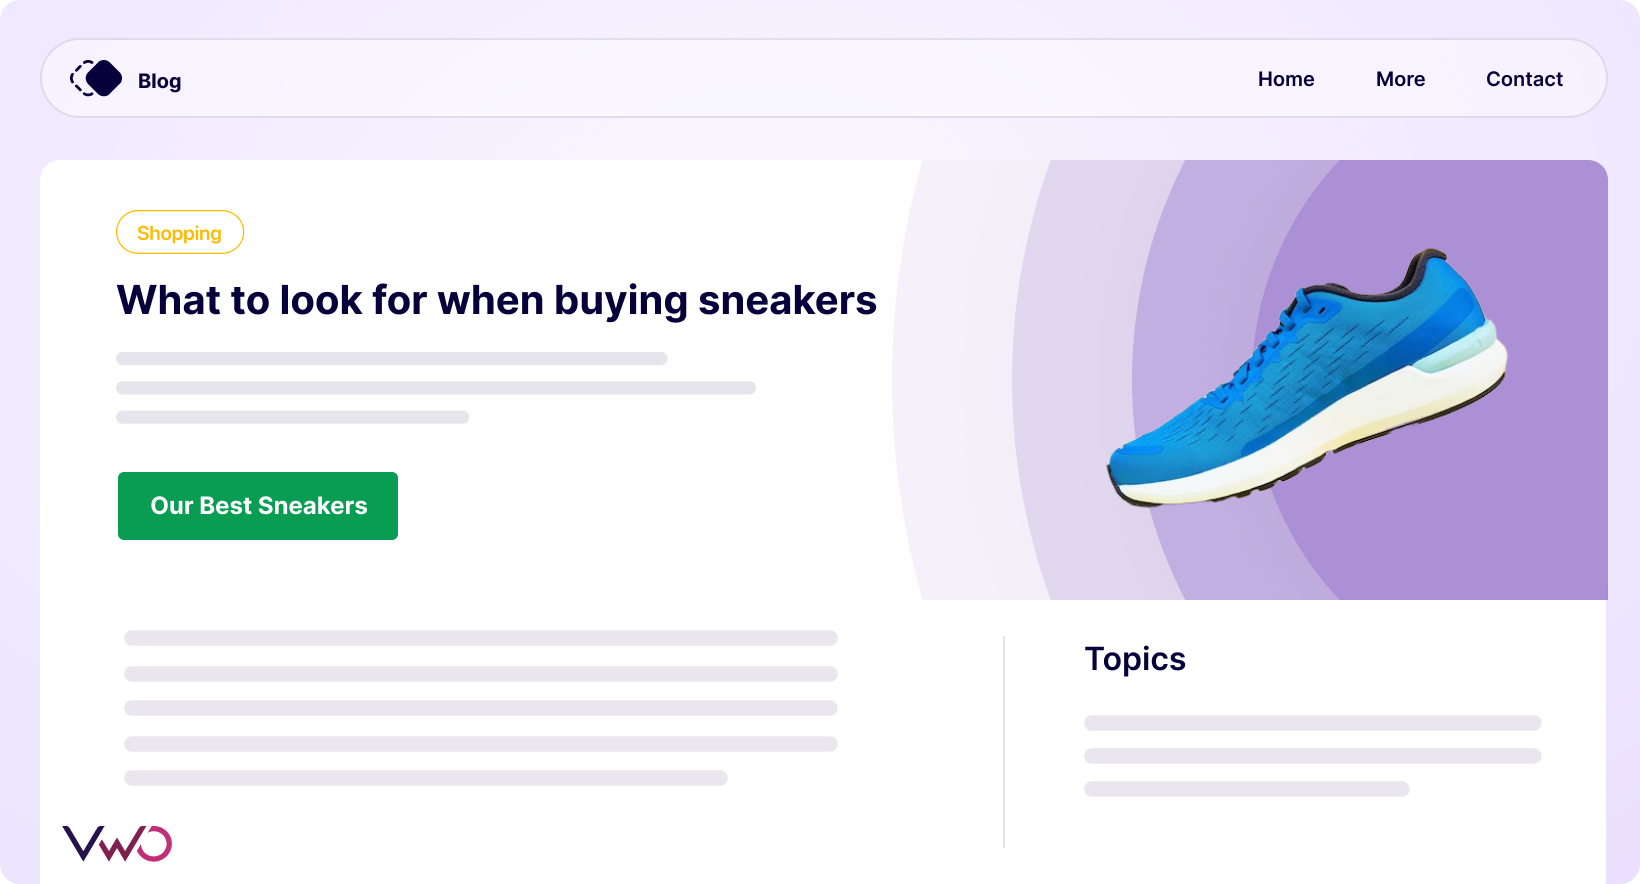
The journey kicks off with a quest for insights on sneaker shopping, guiding to the fashion store’s blog addressing “What to look for when buying sneakers.” Within the blog, strategically placed CTAs in the middle and bottom prompt Corey to venture into the product list page titled “Our Best Sneakers.”
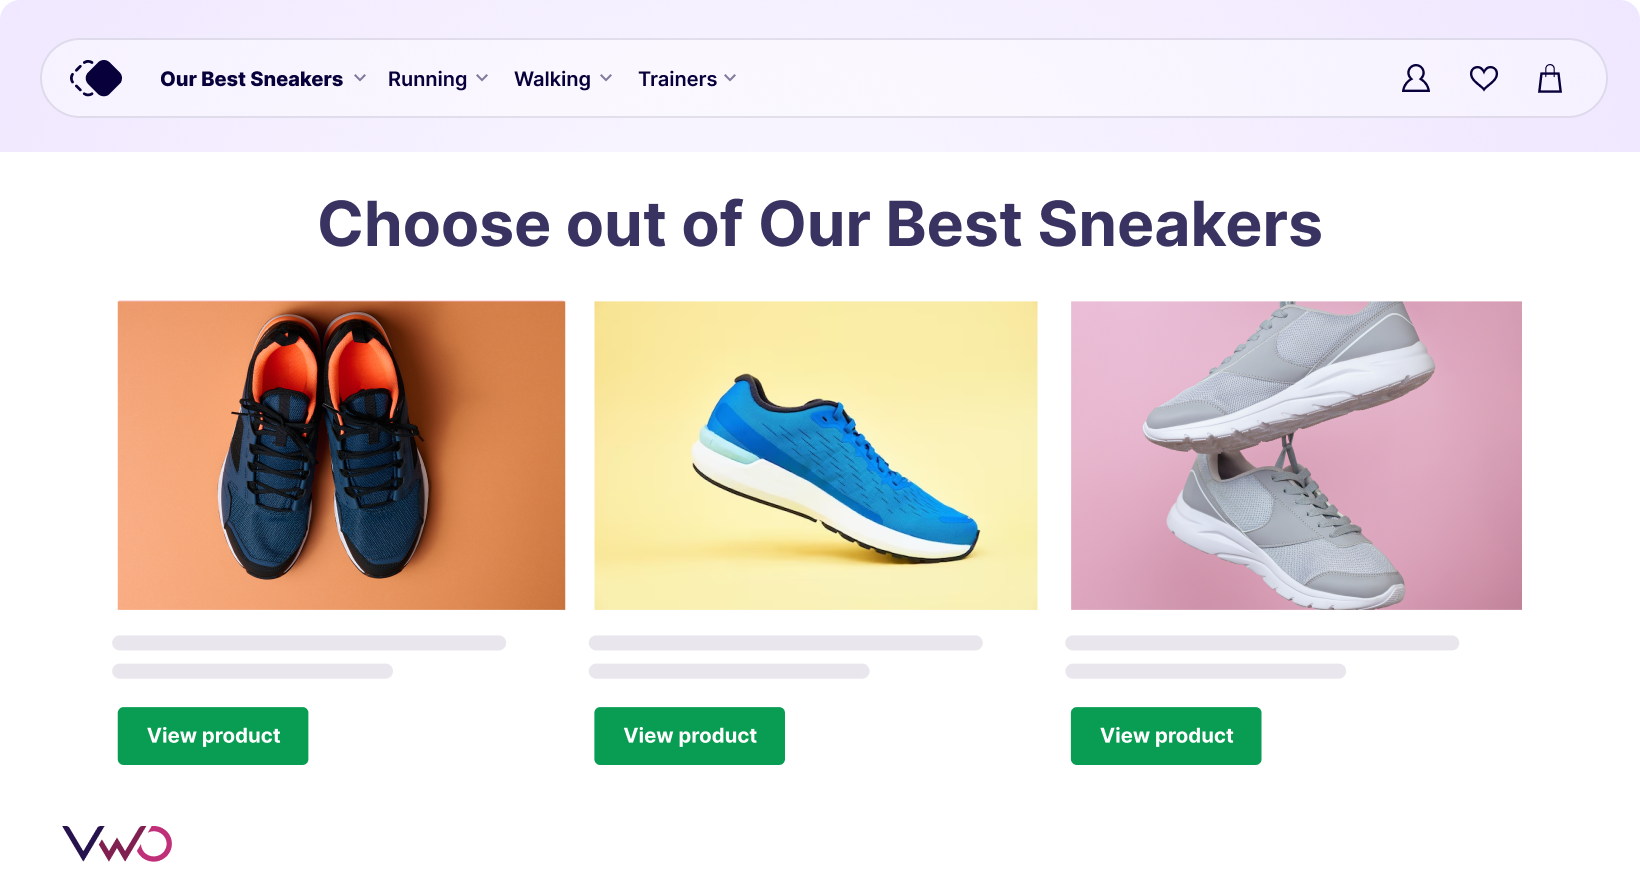
Middle of the Funnel (MoFu):
On the “Our Best Sneakers” page, Corey peruses a variety of sneakers and engages by clicking on the “View product” CTA for the selected sneaker.
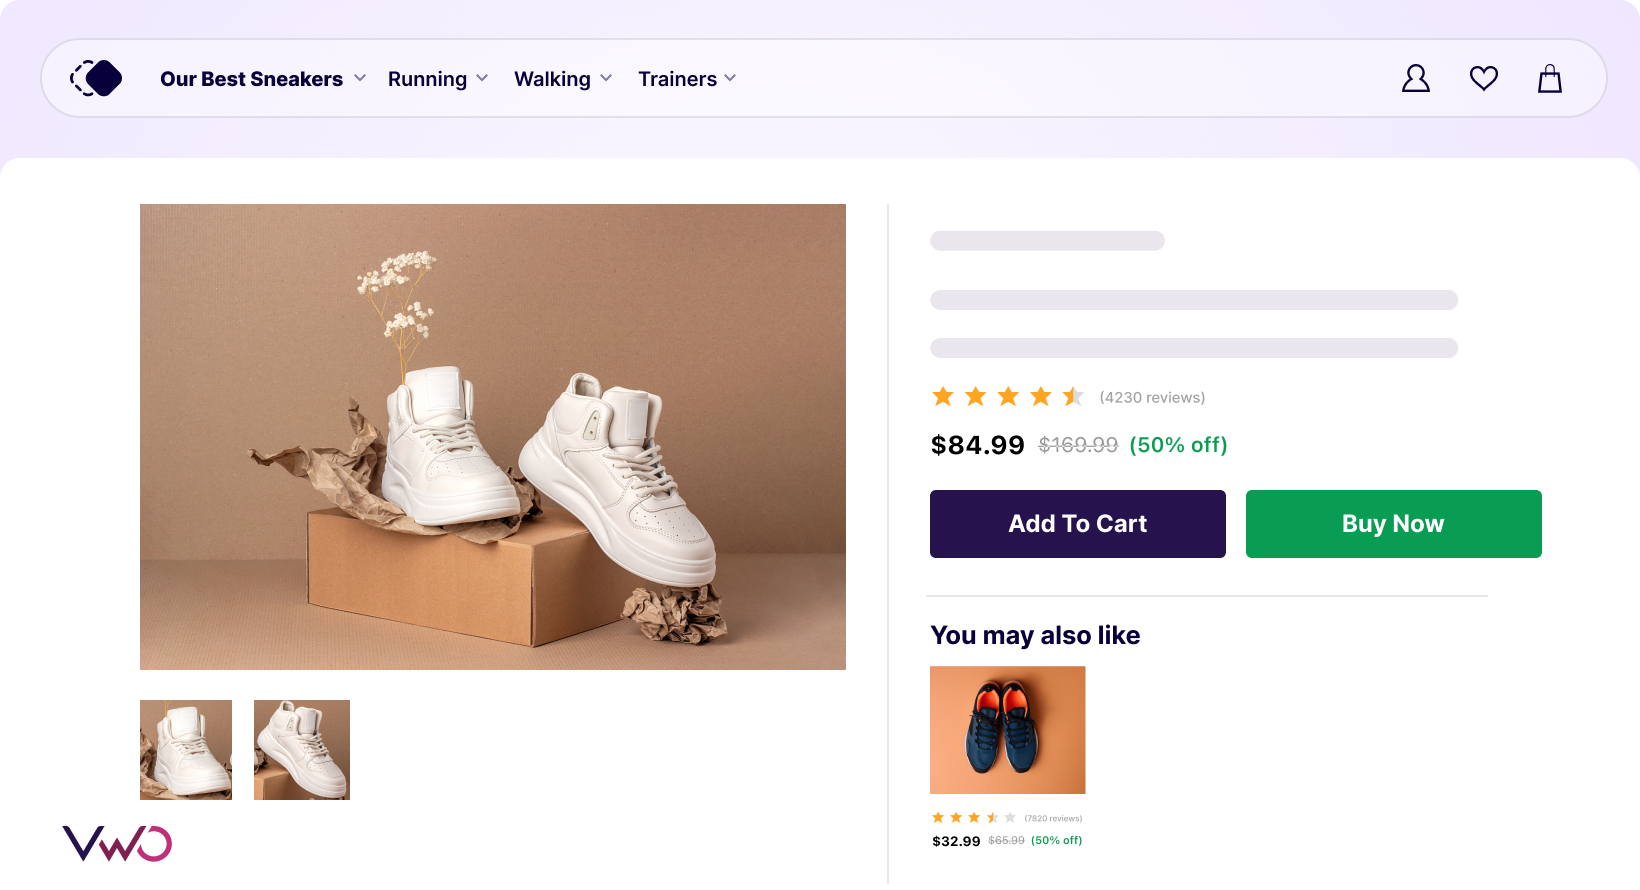
Bottom of the Funnel (BoFu):
Upon discovering the ideal pair, Corey faces the pivotal decision to click “Add to Cart,” proceed with account creation, and ultimately make the purchase through the checkout page.
Now, armed with this breakdown, let’s use behavior analytics to dissect each stage and uncover those friction points that may have disrupted the flow.
Let’s start with web analytics
Before getting into behavior analysis, you can start with web analytics. With Google Analytics, you can set a funnel exploration report for each of the steps mentioned earlier. The completion event for ToFu is clicking on the “Our Best Sneakers” CTA from the mentioned blog, for MoFu, it’s “Clicking view product CTA,” and for BoFu, it’s making the purchase.
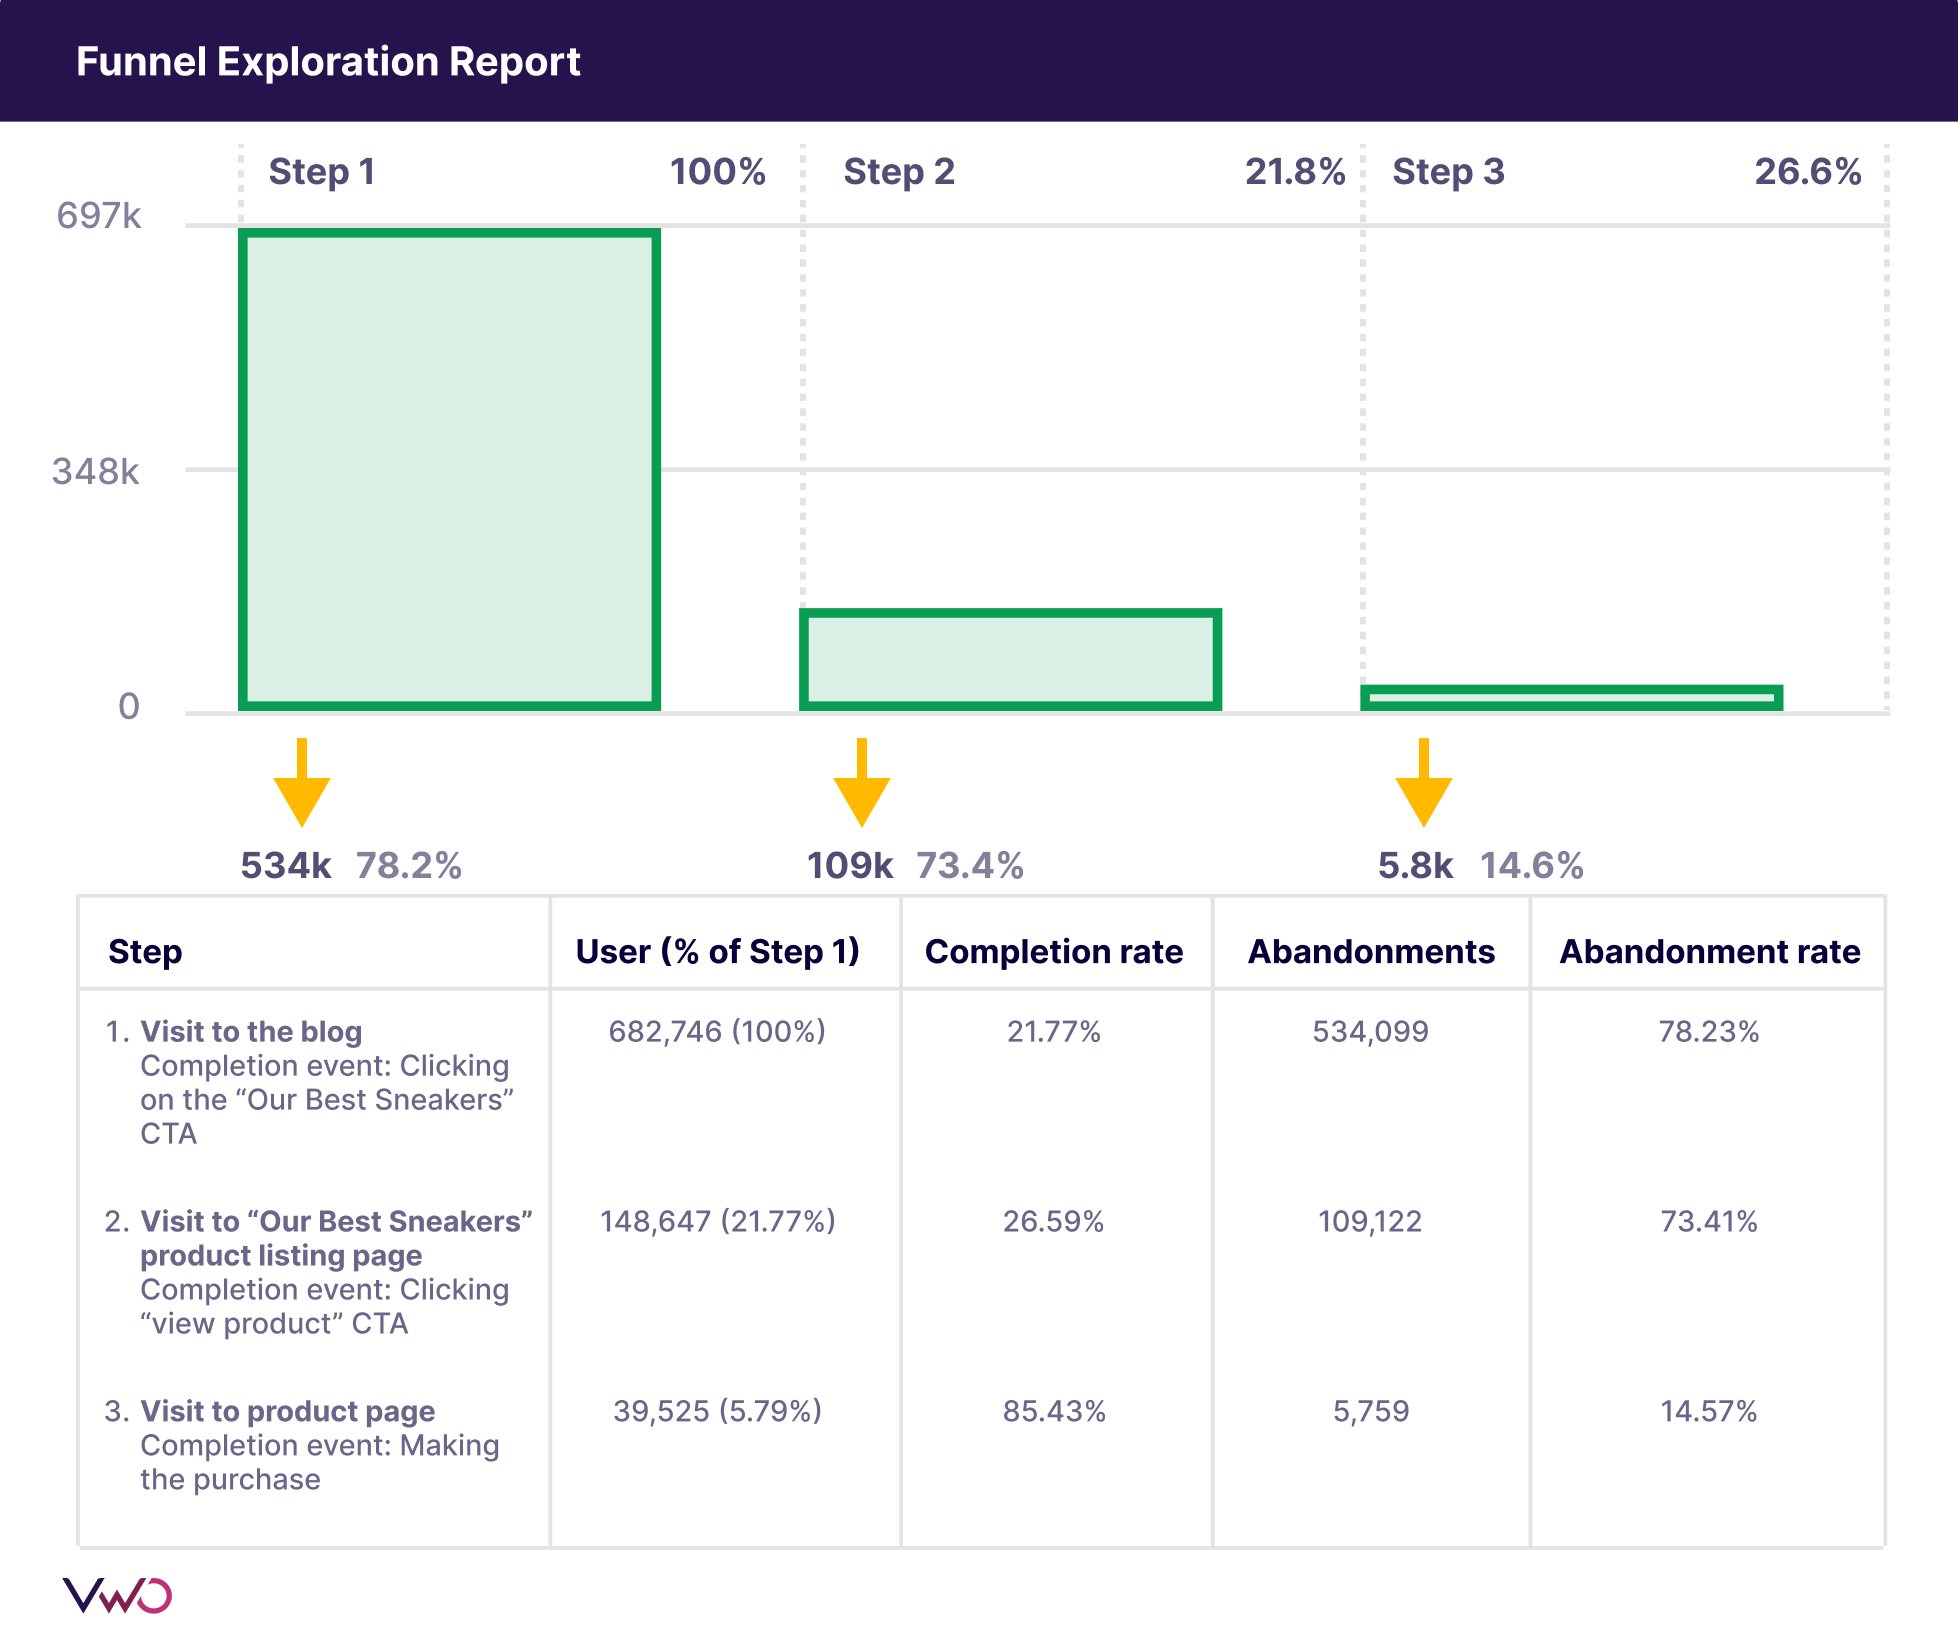
Once the data starts rolling in, you’ll have a clear view of the conversion rate and customer drop-off rate for each stage of the funnel. Now, let’s delve into how behavior analysis can come to the rescue, especially when you identify a stage where the drop-off exceeds our benchmark.
Here, it’s a hypothetical scenario with an elevated drop-off at each funnel stage to illustrate how behavior analysis can be the key to uncovering those elusive pain points.
Carrying out behavior analysis
a. Low conversion rate at the blog post
Suppose the blog is acing its ranking for the chosen keyword, and there’s a substantial influx of traffic. However, a notable chunk of visitors is detouring away from the blog post, failing to progress by clicking on “Our Best Sneakers.” Which is leaving a mark on the conversion rate, dragging it below the benchmark you’ve set.
Now, armed with behavior analysis features, it’s time to roll up your sleeves and uncover the reasons behind this diversion. Starting with the scrollmap, you can see how many visitors are dropping off by checking the percentage scroll depth. The scrollmap will allow you to find what percentage of visitors are dropping before seeing the first text CTA to the product listing page.
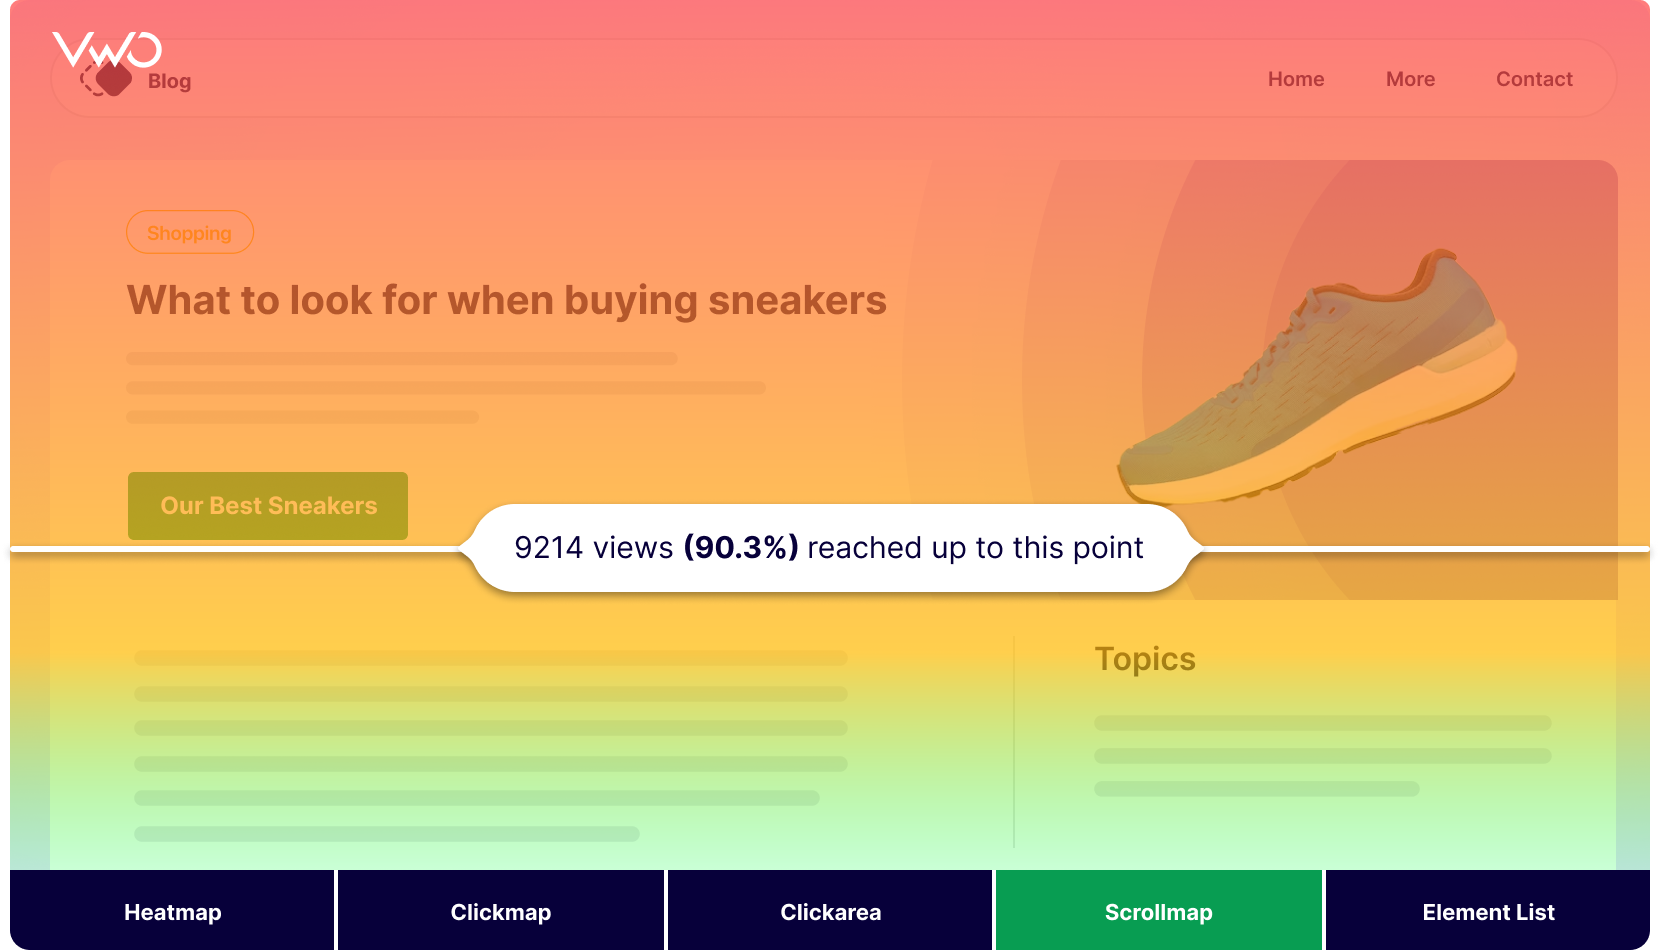
If the scrollmap reveals a significant number of visitors dropping before seeing the CTA and validates the drop-off at the funnel, you can formulate a hypothesis. Perhaps moving the text CTA up the page or analyzing the content to ensure it remains engaging, steering clear of lengthy paragraphs or text-heavy sections, could be potential avenues for improvement.
Suppose, visitors aren’t dropping off, and the content keeps them engaged. The next stop in the analysis is the heatmap reports.
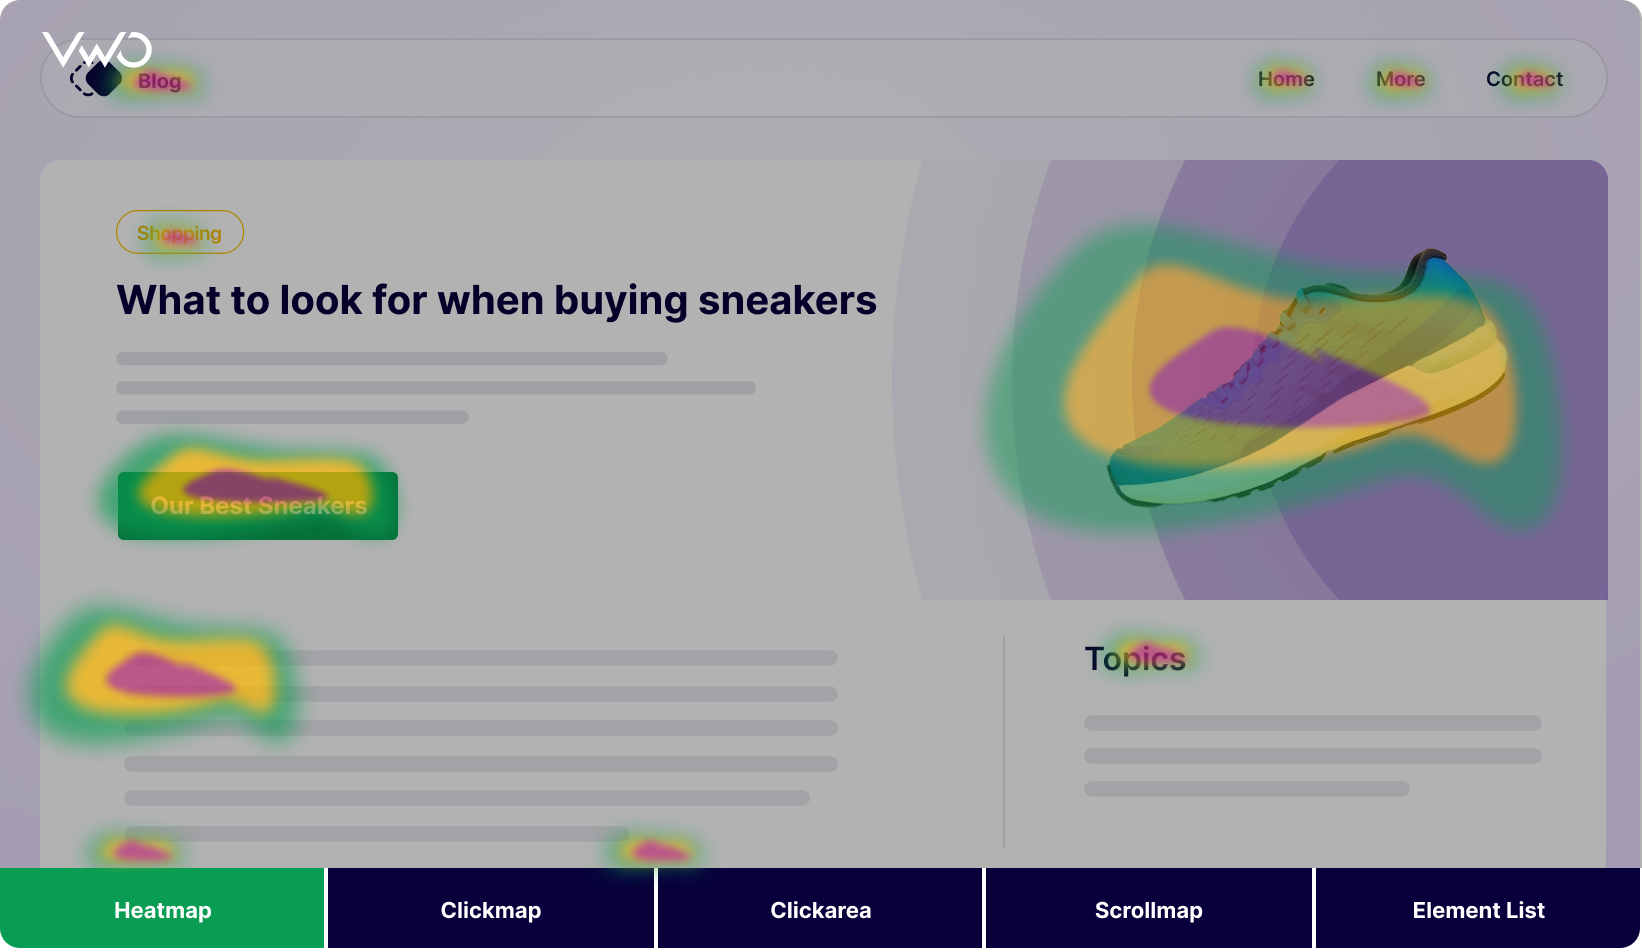
These reports can shed light on how actively visitors are interacting with the text CTAs. If the CTA’s texts are indicated by a cool blue hue in the heatmap, it might be time to craft a hypothesis. To amp up engagement, you can consider tweaking the CTA text, experimenting with different colors, transforming it into a prominent CTA image banner, or even exploring the option of removing the CTAs and introducing a floating side widget.
So, you see scrollmaps helped in figuring out how visitors were engaging with the content, and heatmaps gave clues on how well the CTAs are doing and if their position on the page is hitting the mark.
b. High drop-off at the product listing page
Suppose, visitors are bouncing off the product listing page. In this scenario, you dive into the reports of heatmaps and clickmaps. If you spot a trend of lack of clicks on all CTAs of the listed product, it might be time to redesign CTAs to catch the eye and be super user-friendly. To double-check, you can peek into some session recordings to see if visitors are casually scrolling past those CTAs before. Also, this might help you understand the role of the product image size (whether visitors are trying to click on them to expand.)
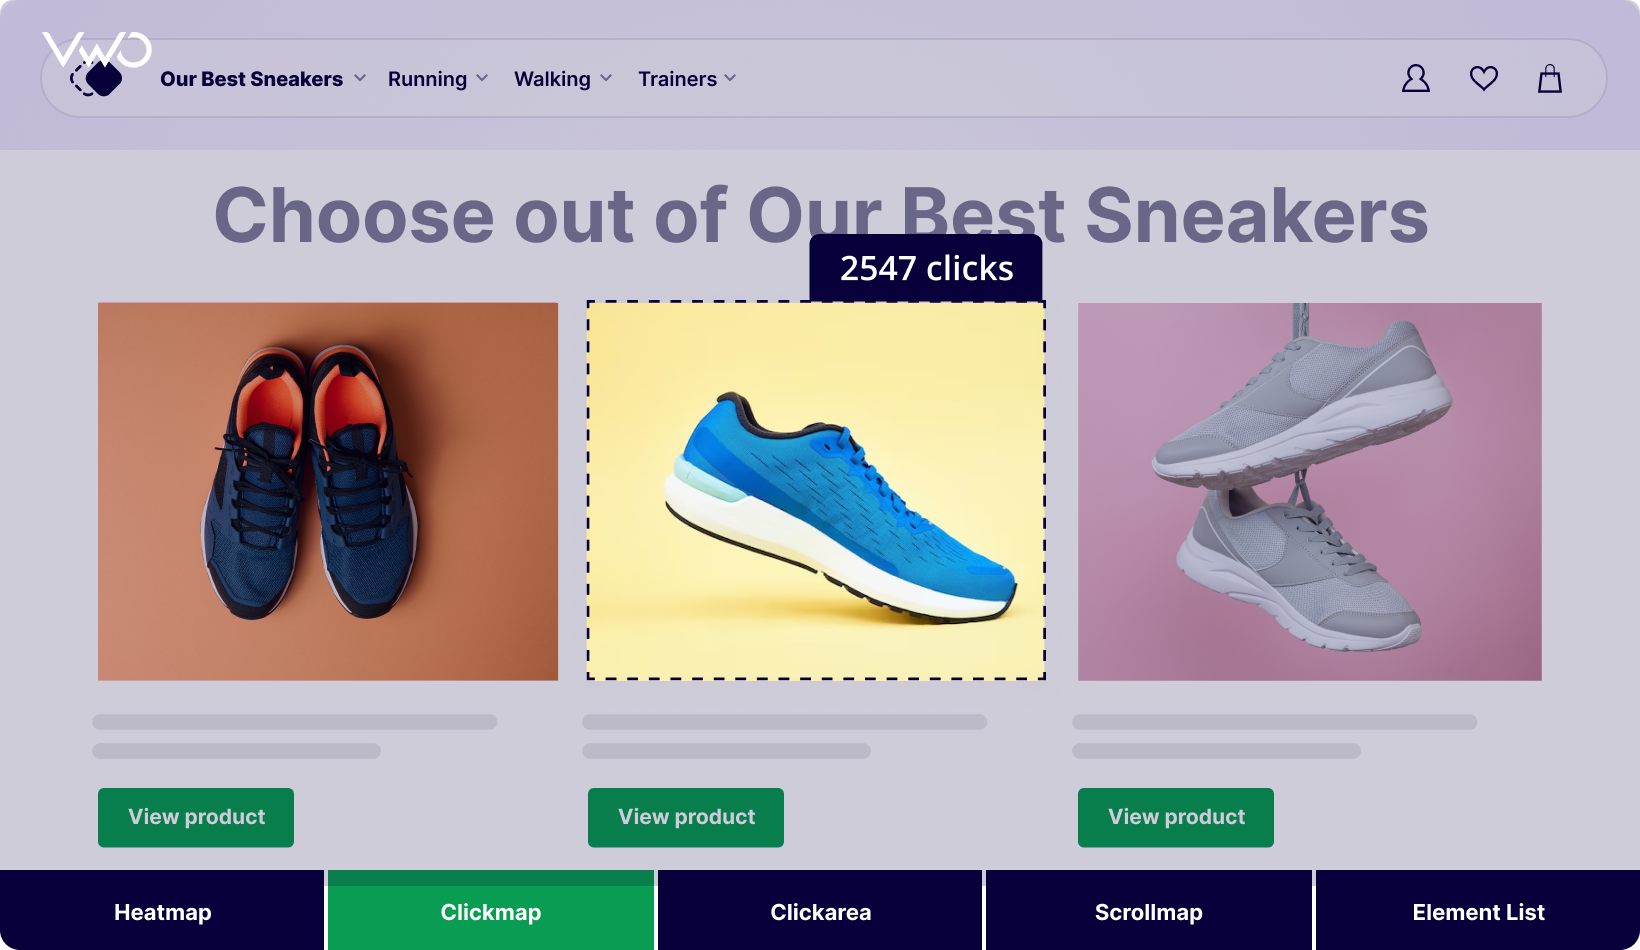
Now, if the clickmap report on individual product lists doesn’t reveal a clear pattern or there is a significant difference in clicks between various products, you can ideate to bring the products with higher clicks up the page and bring new ones in place of the non-clicked ones.
So you see, when you’re digging into visitor behavior on product listings with multiple CTAs, heatmaps, and clickmaps capture the overall trend of clicks. Meanwhile, session recordings precisely let you know how visitors are experiencing the page and whether those CTAs are being shrugged off.
c. Low purchase rate on the product page
If the quantitative analysis shows low purchases from the product page, start by studying heatmap and scrollmap data. This will help you understand how visitors navigate the product page and whether the add-to-cart button is getting enough clicks. If the clicks on the call-to-action (CTA) are low, consider redesigning either the CTA or the entire product page. Experiment with image positioning and CTA placement to see if it makes a difference.
If the add-to-cart CTA is performing well, move on to examining how new visitors interact with the registration form. Use the form analytics report to identify hesitation, frustration, rage clicks, and completion rates, assessing the overall form performance. If it’s not meeting expectations, brainstorm and implement new design ideas for the forms.
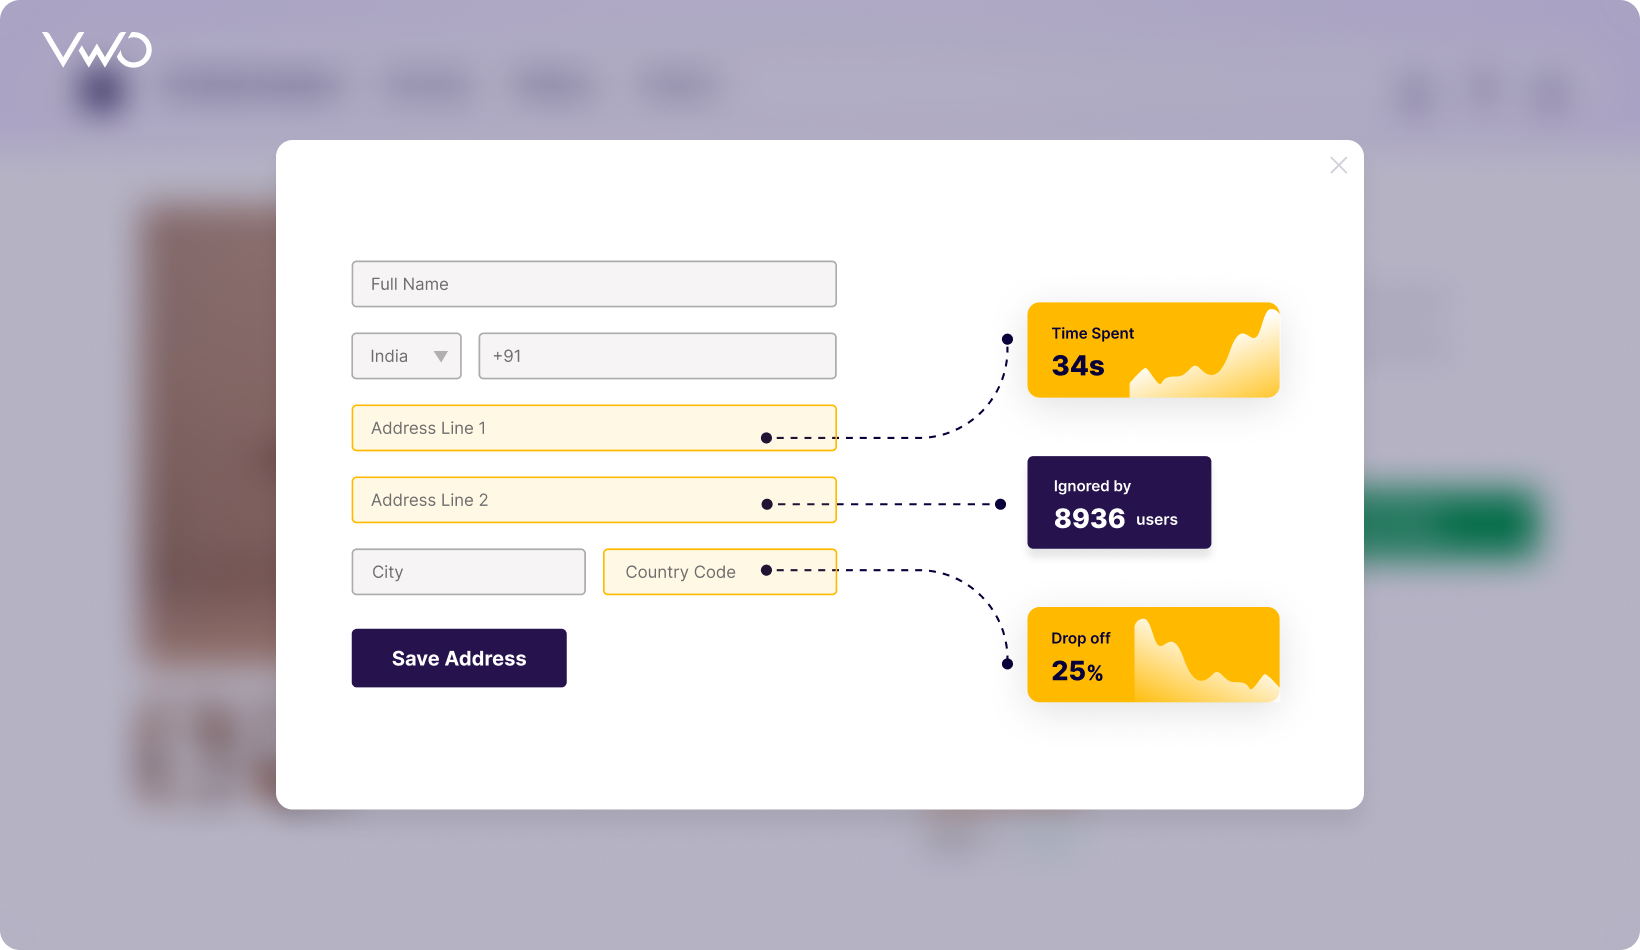
For a more in-depth analysis, explore session recordings to observe how visitors are filling out the form. This will provide additional insights for optimizing the registration process.
Don’t forget to use all of these features to assess the checkout page and determine if it’s user-friendly for payments. During the BoFu (Bottom of the Funnel), deploy exit surveys to gather direct insights from high-intent leads about their experience. At this stage, the response rate to surveys is high, and you get quality feedback on the most crucial stage of your funnel. This information can guide improvements in design, pricing, and the overall checkout experience.
So, if you see, using multiple features for behavior analysis provides you with highly detailed insights into visitor behavior. These detailed observations can lead to valuable ideas for improvements or experimentation.
It’s worth noting that you don’t always have to kick off with web analytics. If you have just rolled out a new page experience, caught wind of issues through customer feedback, or noticed a decline in sales trends, you can go straight to behavior analytics.
Your funnel might be different, but the above approach and the features used can act as an inspiration to you. Take a cue from it and strategically use these features to decode the behavior patterns of your customers or visitors.
Now that we’ve covered the details on how to conduct behavior analysis, let’s progress to the next step: shortlisting a tool for the job.
How to choose a tool for behavior analytics
Selecting a behavior analytics tool is mainly driven by the need to address business-specific challenges, set goals, and allocate budget for the project. In addition to these considerations, here are some guardrails to assist in narrowing down the tool.
a. Explore tools that give a full-featured free trial or free plan
Securing a thorough free trial is incredibly valuable for understanding the capabilities of a prospecting tool. It offers insights into the customer service experience and how well it aligns with established practices, all without committing financially. Prioritizing such tools in the initial phase is a smart move for any business. Additionally, consider exploring tools with forever-free plans, especially if you have budget constraints or are just setting up your behavior analytics roadmap.
b. Look for tools that provide instant value
Consider exploring tools that provide features with quick turnaround times. Take generative AI, for instance. Its popularity is on the rise, transforming the scale and speed at which businesses deliver solutions. Its applications are now extending to processes like behavior analytics.
As your organization grows and places greater emphasis on behavior analytics for optimization, the manual task of sorting through each report for insights can become cumbersome. Fortunately, analytics tools are incorporating Generative AI solutions to automate insights derived from survey and heatmap reports, streamlining the entire process. It’s advisable to explore tools that offer features in this area to enhance the efficiency of your analytics endeavors.
c. Prioritize privacy-first tools
Privacy is a fundamental right of every human being, and when you are analyzing the behavior of your visitors, you must be using tools that are privacy first. Here are some features of a privacy-first tool:
- It allows data minimization, collecting only necessary information and obtaining user consent transparently.
- Allows user whitelisting to limit account access based on user location or IP address, and access is restricted to only those designated areas.
- Offers security measures, including encryption and adherence to international privacy certifications, to ensure data protection.
- The tool prioritizes data residency compliance. Additionally, it employs data anonymization techniques, respects deletion timelines, and incorporates privacy principles into product development, showcasing a privacy-by-design approach.
- Provides user consent mechanisms, opt-out options, and adherence to privacy laws such as GDPR, CCPA, and others for user privacy.
In essence, a good privacy-first tool integrates transparency, user control, and robust security practices to uphold privacy standards effectively.
Now that you have a grasp of behavior analytics and tool selection, consider exploring VWO Insights – Web, a tool with compelling reasons to be on your radar, regardless of your business stage.
Behavior analytics with VWO Insights – Web
VWO Insights – Web stands out as an all-in-one product, providing heatmaps, session recordings, form field analytics, and on-page surveys. The setup process is straightforward, and its uniqueness lies in its approach to sampling visitors. Based on the volume of visitors purchased, it uniformly samples visitors from the traffic directed to your website (or specific pages where the VWO tracking code is present). This ensures a representative set of data across a month. Each visitor is counted as unique, meaning that once a visitor is sampled, all data points for heatmaps, recordings, and forms are collected for that visitor, regardless of how many times they return in that month. This approach ensures that your quota isn’t depleted simply because someone is visiting multiple times.
To add to its sophistication, VWO Insights-Web also provides access to generative AI features, such as Generative AI-based surveys. This empowers users with cutting-edge technology to achieve success swiftly. To illustrate, here’s how it generates survey reports using generative AI, streamlining the otherwise tedious process of extracting insights from a vast dataset:
Now, let’s talk pricing. You can explore and choose from plans like Growth, Pro, and Enterprise, tailoring your selection to the specific needs of your business. This flexibility allows you to scale up according to your requirements and budget as your business grows.
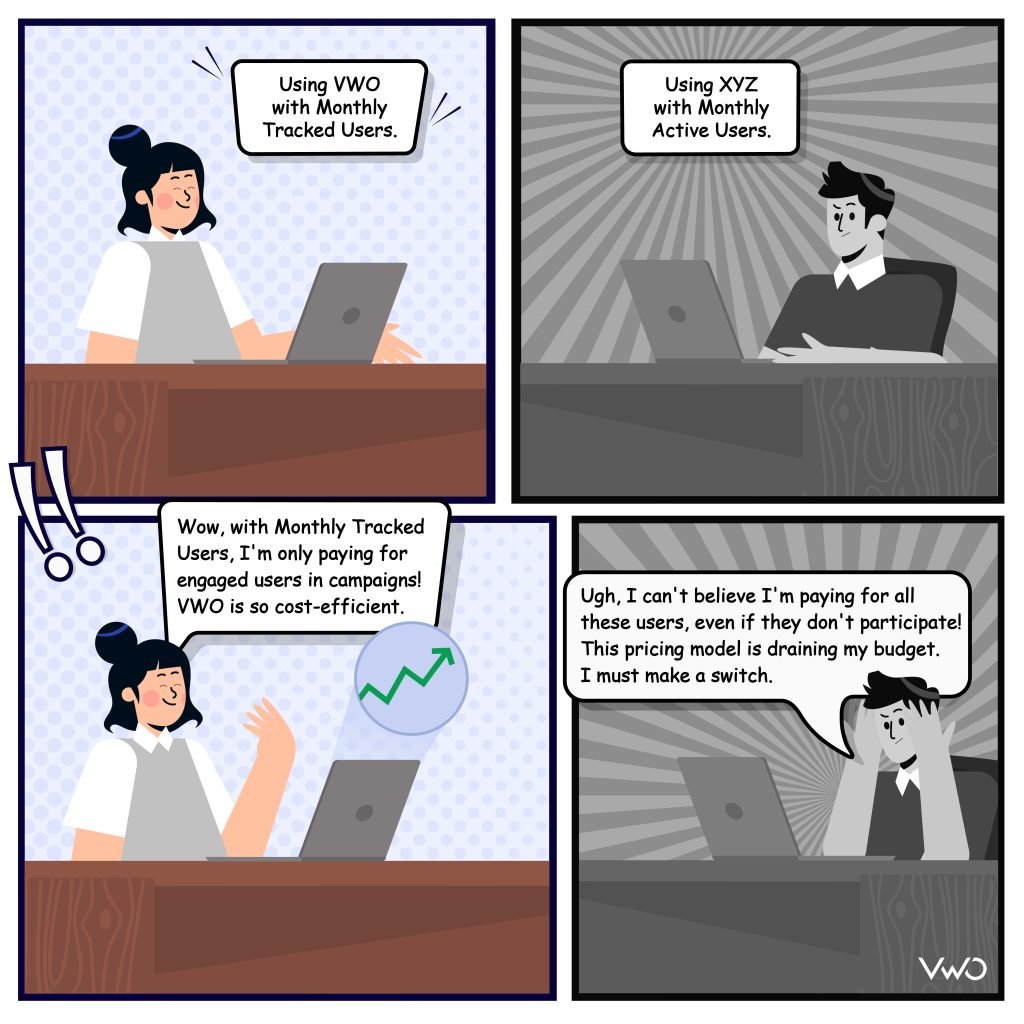
VWO operates on a monthly tracked users (MTU) pricing model. This means you’re only charged for users who actively engage with your campaigns.
When it comes to safety and compliance, VWO stands out as the only tool among its competitors that adheres to stringent standards. It complies with GDPR, CCPA, CPRA PCI DSS, HIPAA, ISO 27001:2022 ISMS, ISO 27001:2019 PIMS, ISO 27017 Cloud Security, ISO 27018 Cloud Privacy certifications, and SOC 2 Type II. This commitment to various regulatory and security measures ensures that your data and user information are handled with the highest level of protection and following industry standards.
Here is one testimonial from our client on G2:
VWO Insights help us identify customer pain points and reasons for their drop-off. Being an e-commerce company, it is important to know how our customers feel about the products and services we provide. Through VWO Insights, we are easily able to identify our blind spots and rectify them.
Feeling intrigued? Take the leap and give it a try with a full-featured 30-day free trial. If you prefer to learn more before making any decisions, check out the fascinating success story of the 250-year-old Encyclopedia Britannica. They used VWO Web-Insights to comprehend visitor behavior and successfully increased their click-through rate by 10% through experimentation. It’s a compelling testament to the tool’s effectiveness in real-world scenarios. Also, you can get a detailed read on how VWO handles behavior analytics.
Final thoughts
Creating a website with the best practices is a solid start, but the real insight comes when visitors start interacting. Analyzing their behavior becomes crucial, as imperfections and friction points may only become evident when you put yourself in your customers’ shoes to understand their experience.
Categories:


![10 Best Enterprise Analytics Platforms [2026]: Expert Picks with Reviews and Comparisons](https://static.wingify.com/gcp/uploads/sites/3/2025/08/Feature-image-10-Best-Enterprise-Analytics-Platforms_-In-Depth-Reviews-and-Comparisons.jpg?tr=w-300,h-150)


