

‘Supposing is good, but finding out is better.’ – Mark Twain
In the realm of visitor behavior analytics, we resonate with the same wisdom.
Trying to guess what might be off in the visitor journey or what issues they are dealing with can only get us so far.
Diving into the insights hidden within visitor behavior is crucial for making smart decisions for unbeatable business success.
VWO Insights has been a game-changer in the journey of scores of brands to help them understand their visitors’ behavior using heatmaps, session recordings, surveys, and forms.
However, with the latest upgrades, we’ve taken its potential to the next level, making the data more actionable than ever without demanding endless hours of human effort.
In this blog, we’re giving you a refresher about all that’s achievable with this capability. So, keep reading!
How do you maximize insights with heatmaps?
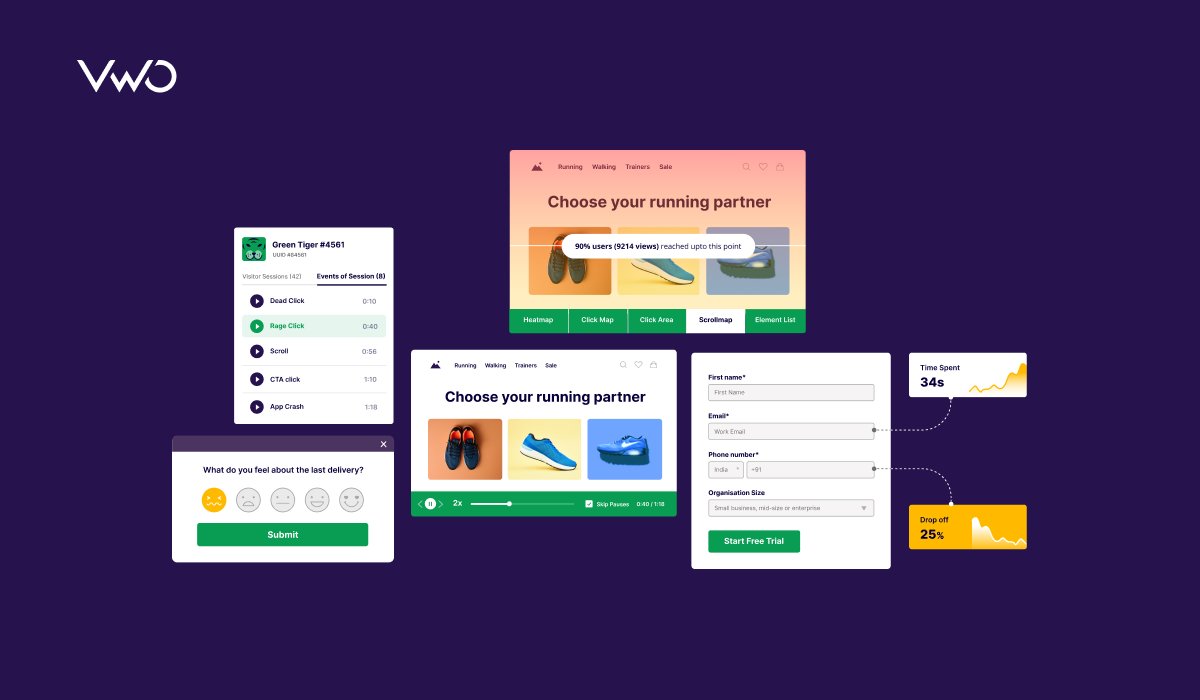
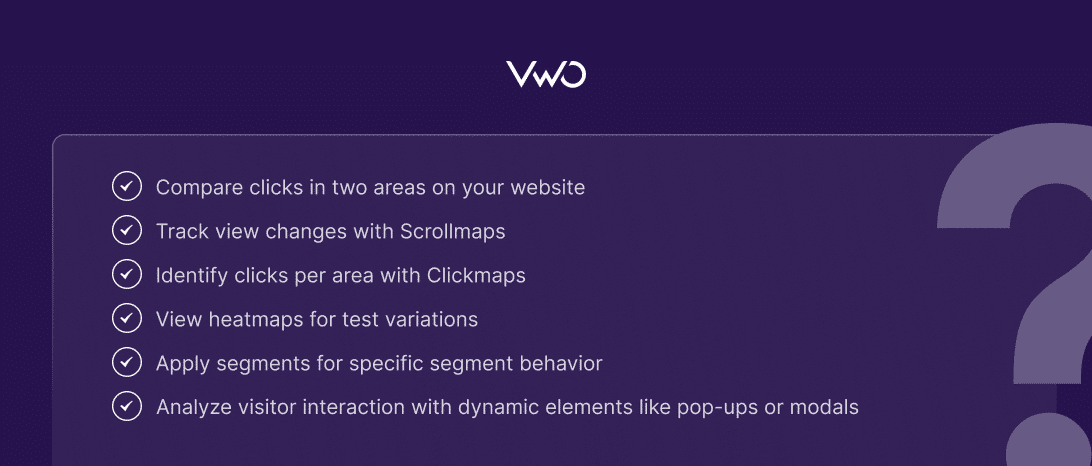
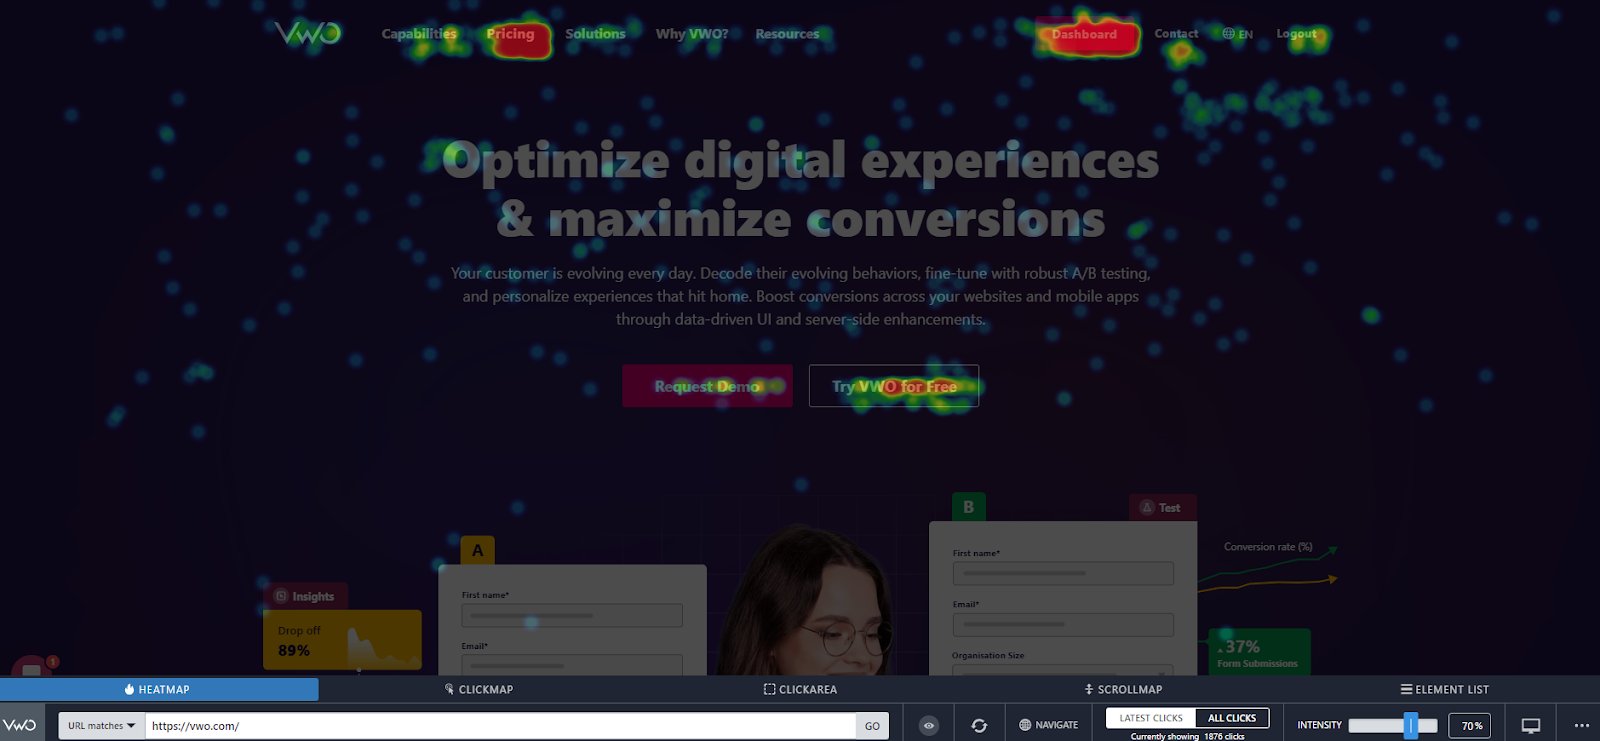
Heatmaps by VWO Insights – Web serves as an excellent starting point for analyzing visitor behavior. With heatmaps, one can get a visual summary of visitor interaction on the page – mainly of clicks and scrolls.
Let’s understand a use case where you can analyze visitor behavior through heatmaps.
Consider you run a relocation service company and you want to see how your website is performing in terms of visitor behavior. As you navigate to Google Analytics 4 to review current metrics, you’re struck by the high bounce rate on service pages. To understand why this is happening, you initiate a qualitative analysis, starting with the heatmaps.
You observe through the Clickmap that the ‘Read more’ button, intended for exploring service details, receives the least percentage of clicks on these pages (indicated by a cooler color).
Further, you click and compare different areas to see that blue bolded text in the copy garners the highest percentage of the total clicks on the page. This indicates visitors might perceive them as anchor text links to take them to a new page.
Next, the scrollmap indicates a consistent decline in views as visitors scroll through the page. This tells you that visitors are not even scrolling down and engaging with the section that talks about the benefits of your service.
Additionally, the heatmap on a dynamic element like the ‘Get a quotation’ pop-up reveals that visitors click the close option more than they engage with the content in the pop-up. Interestingly, in segment-level analysis, you see visitors using the Safari browser are the most engaged group on your page.
You can download the heatmaps and even share the click area data with your marketing team to brainstorm optimization ideas. That way, your entire team can stay posted about engagement status on a webpage.
Read our detailed article to know how to get started with heatmaps on VWO.
A real-life example to inspire you:
Ubisoft Entertainment, a leading French video game company recognized for franchises like For Honor and Assassin’s Creed, prioritized lead generation and conversion rates for overall performance analysis. Despite strong performance on several pages, the ‘Buy Now’ page for ‘For Honor’ needed improvement. Ubisoft’s team, leveraging click maps, scroll maps, heatmaps, and surveys, discovered a tedious buying process on that particular page. Driven by these insights, the team completely overhauled the page, increasing the sign-ups by 12%.
How do recordings help you keep an eye on visitor actions?
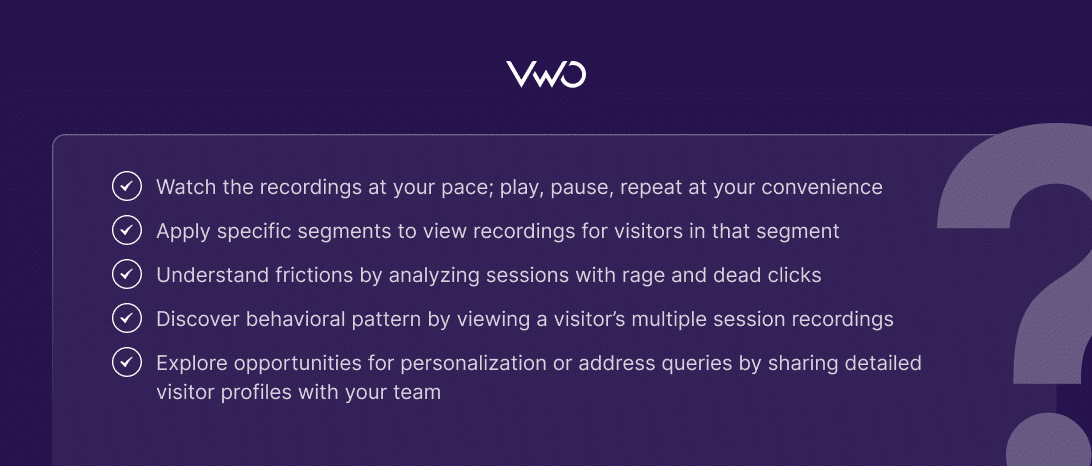
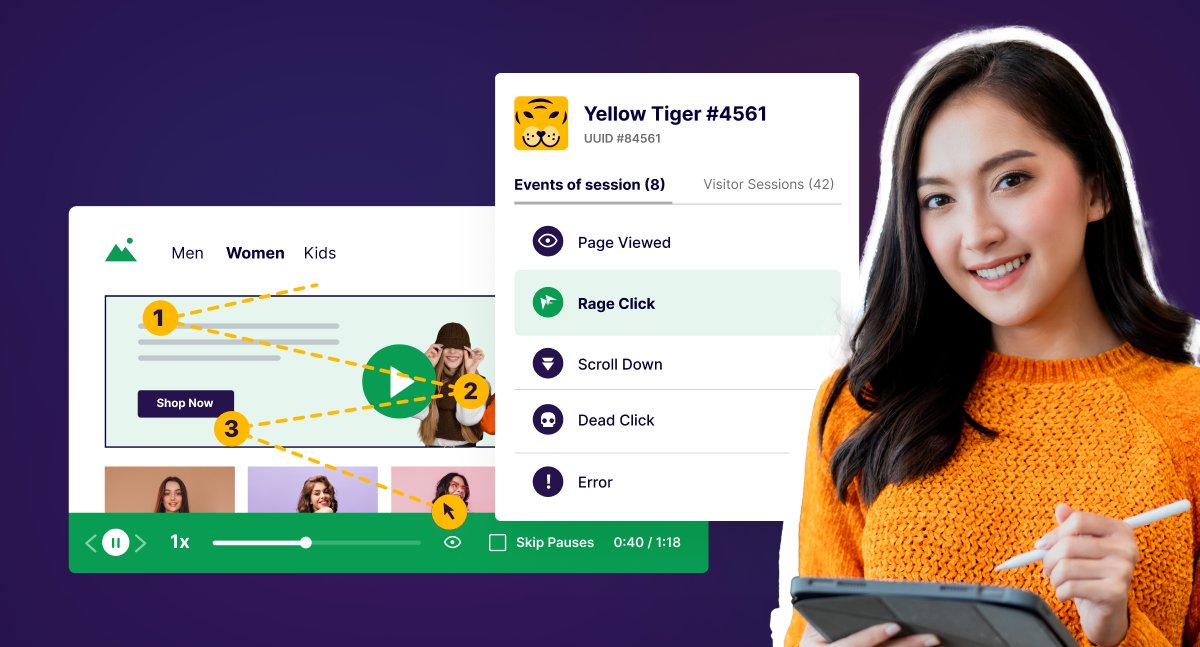
Session Recordings by VWO Insights – Web literally lets you watch visitors in action. What path they take, where they click, if they wait somewhere before clicking – it’s all about capturing these granular details that make our recordings a favorite among businesses.
Consider a scenario where people are actively engaging with the navigation menu on your website. You can see this through the warm red colors in the heatmaps. But the website funnel analysis shows that not many visitors are reaching the product listing pages. It makes you wonder if the visitors are having trouble finding products. To investigate, you turn to session recordings.
So, you create a view for the page and choose a segment you’d like to see recordings for—perhaps shoppers from Singapore, your upcoming market where you aim to maximize sales.
While reviewing the recordings, you observe the visitors’ mouse movement, noticing pauses and hesitancy about selecting a product in the navigation menu. They go back and forth without making a selection. Ultimately, you come to believe that the product categories could be arranged more systematically to simplify navigation.
Additionally, you see a couple of sessions of this visitor with dead clicks where he tries to click a product but it doesn’t take him to the listing page. This is another problem area that needs to be addressed.
If the visitor has been to your website across multiple sessions, you can review recordings of their interactions in those sessions. Check other recordings, if available, to see if the same issues persisted or if new problems emerged.
Watch recordings of other visitors in that segment to determine whether the problem was unique to the previous visitor or whether they were also hesitant and failed to click through to the product listing page.
You can even share any visitor profile with your team if you identify something interesting in their behavior that your team can glean insights from and refine their optimization efforts.
Get details on how to create a session recording, how to interpret it, and much more in our in-depth article.
A real-life example for you:
Pearl Only, an online jewelry store, first discovered through analytics that there was some scope for optimization on its website. Paired with this insight, the team identified that the checkout page was cluttered and distracting visitors from the main CTA. To confirm these observations, they analyzed recordings of visitor sessions on the checkout page and discovered that visitors weren’t paying attention to the USPs. Instead, they were clicking on elements that led them away from the page. Based on these insights, the team implemented changes that resulted in a 10% increase in revenue.
How do surveys keep you up to date with customer feedback?
Surveys by VWO Insights – Web always helps you stay updated with customer feedback, and its power is now doubled with AI.
Wondering how? Let’s break it down with an example.
Meet Smith, concerned about the declining visitor engagement on his news publishing site, as reflected in the reduced average time spent in GA4. To uncover the root cause, he decided to set up an on-page survey.
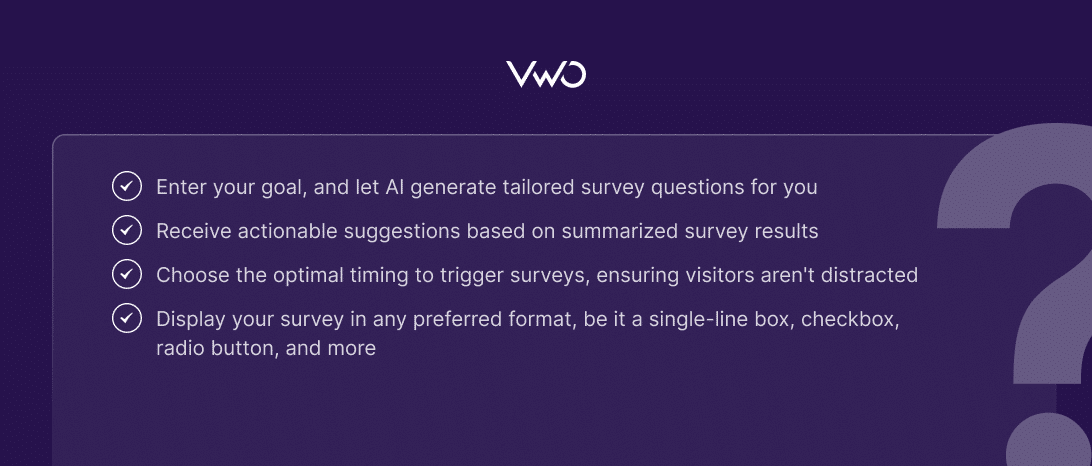
Here’s how he gets started: Smith enters the goal ‘Ask visitors for improvement ideas’ and is presented with a series of AI-generated questions. Because this AI-powered feature lets visitors regenerate questions, Smith takes full advantage of it and finalizes a question after 3 iterations.
Next, he selects a single text box format and sets the trigger to display the survey after visitors spend 3 minutes on the page. Of course, you can choose other triggers, like showing surveys when visitors click somewhere or when they’re about to leave the page. The choice is yours.
Fast forward to a month later, Smith is ready to analyze the survey responses. He’s saved from the hassle of sifting through piles of responses as AI steps in to summarize the key insights.
For instance, a key insight emerges, revealing that most visitors perceive the website as text-heavy. To enhance the visitor experience, actionable takeaways include making the site more visually appealing by incorporating multimedia elements, adopting a minimalist layout, and strategically increasing white space.
Even if you wish to delve deeper into responses, you can do so. Let’s say Smith filtered responses specific to a segment, such as new visitors, and found some really good suggestions he thinks can be tried out.
Overall, implementing improvements based on these insights allows you to seamlessly integrate customer feedback into website enhancements.
Are you intrigued to give it a try? Learn how to use surveys on VWO in our in-depth article.
A real-life example for you to read:
Encyclopedia Britannica added Q&A accordions to engage visitors on their site and prevent them from searching on Google. These accordions offer helpful information related to what visitors are reading. The company identified popular articles, used our surveys to learn what visitors wanted to know more about these topics, and then created accordion features with top Q&As for each article. The result? More than 23% of visitors clicked to see answers and explore more content.
How does form analytics improve form conversions?
Have you been on the lookout for a tool that can dive deep and provide field-level analysis? Form Analytics by VWO Insights – Web has got your back.
Imagine you have a loan application form on your finance website. Lately, there has been a surge in live chat queries about the loan form, suggesting confusion among visitors.
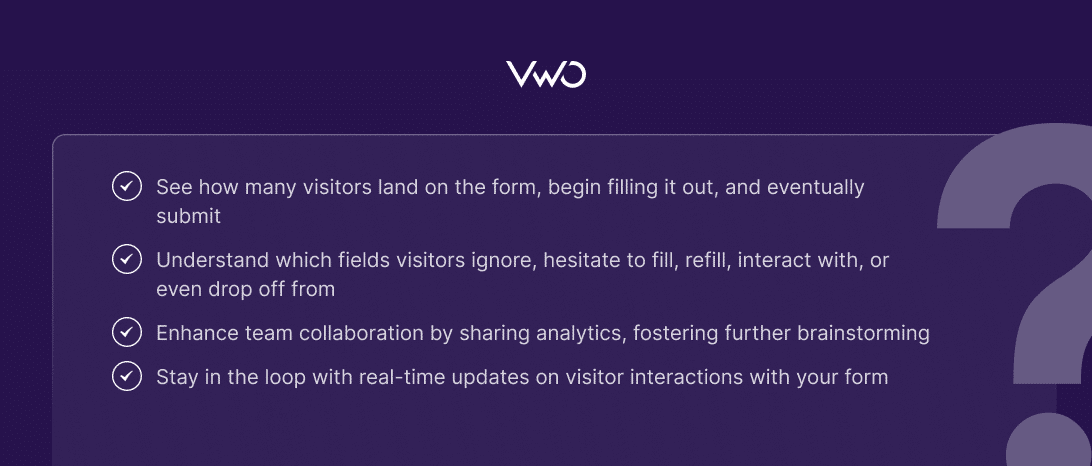
Using form analytics, you dig deeper and find that the total time spent on filling out the form is unusually high. Moreover, hesitation around sharing credit history is noticeable, with a significant drop-off from this field. Visitors are also neglecting the fields where they have to enter the address.
Real-time updates reveal that the number of visitors landing on your form, interacting with it, and then dropping off is steadily increasing. Moreover, when you apply filters to identify the segment from which most visitors drop off, you notice that the majority is coming from mobile.
This suggests that mobile visitors may encounter difficulties when filling out a lengthy form on a small screen.
These insights suggest that shortening the form by removing insignificant fields could be the solution to engage visitors more effectively.
To get the ball rolling for your form analysis, read how to set up form tracking, use the dashboard, and more in our article.
A real-life example to inspire you:
PayU, an Indian-origin fin-tech company, wanted to reduce drop-offs from the checkout page for their merchants. All PayU had were quantitative metrics such as time duration and bounce rate. They lacked qualitative insights into the specifics of what happened on the checkout page. Leveraging our form analytics, the team identified that requiring both telephone and email addresses caused friction and contributed to significant drop-offs. In response, they promptly eliminated unnecessary fields from the form, resulting in a 6% increase in the checkout rate.
One of our clients using VWO’s Form Analysis felt that it could be the first feature to start with your website optimization.
The platform is interactive and easy to navigate through, Even without training it’s quite easy to understand how to use it. One of the key advantages is how Insights is connected to the rest of VWO’s products. From observations, through heatmaps to hypothesis and testing.
It’s a very good way how to keep the data connected. It was very easy to implement, we could start right away. If there was an issue or a question regarding the setup of functionality, the support team was very qualified and fixed everything quite quickly.
Feature-wise the best addition is the Form analysis, very useful if you are wondering where to start with optimisation. Adding observations into session recordings and sending them over to the dev team without them needing the app access saved us a lot of time.
A G2 review
Insights Dashboard – What’s new and how does it simplify behavioral analysis?
As you can understand from the above discussion, our session recordings and heatmaps give you a full view of how visitors behave on your site, helping you make better decisions for website improvements.
However, in the past, going through hundreds of recordings and heatmaps was needed to validate your analyses. You had to go through heatmaps for page after page or session recordings from visitor after visitor to actually derive a concrete actionable insight – where the consistent friction is and what could be done.
Now, with the Insights Dashboard in VWO Web Insights, you can easily understand the overall visitor experience. Check average engagement scores, pages with lowest engagement scores, segments with lowest scores, and identify problems like high rage clicks or errors.
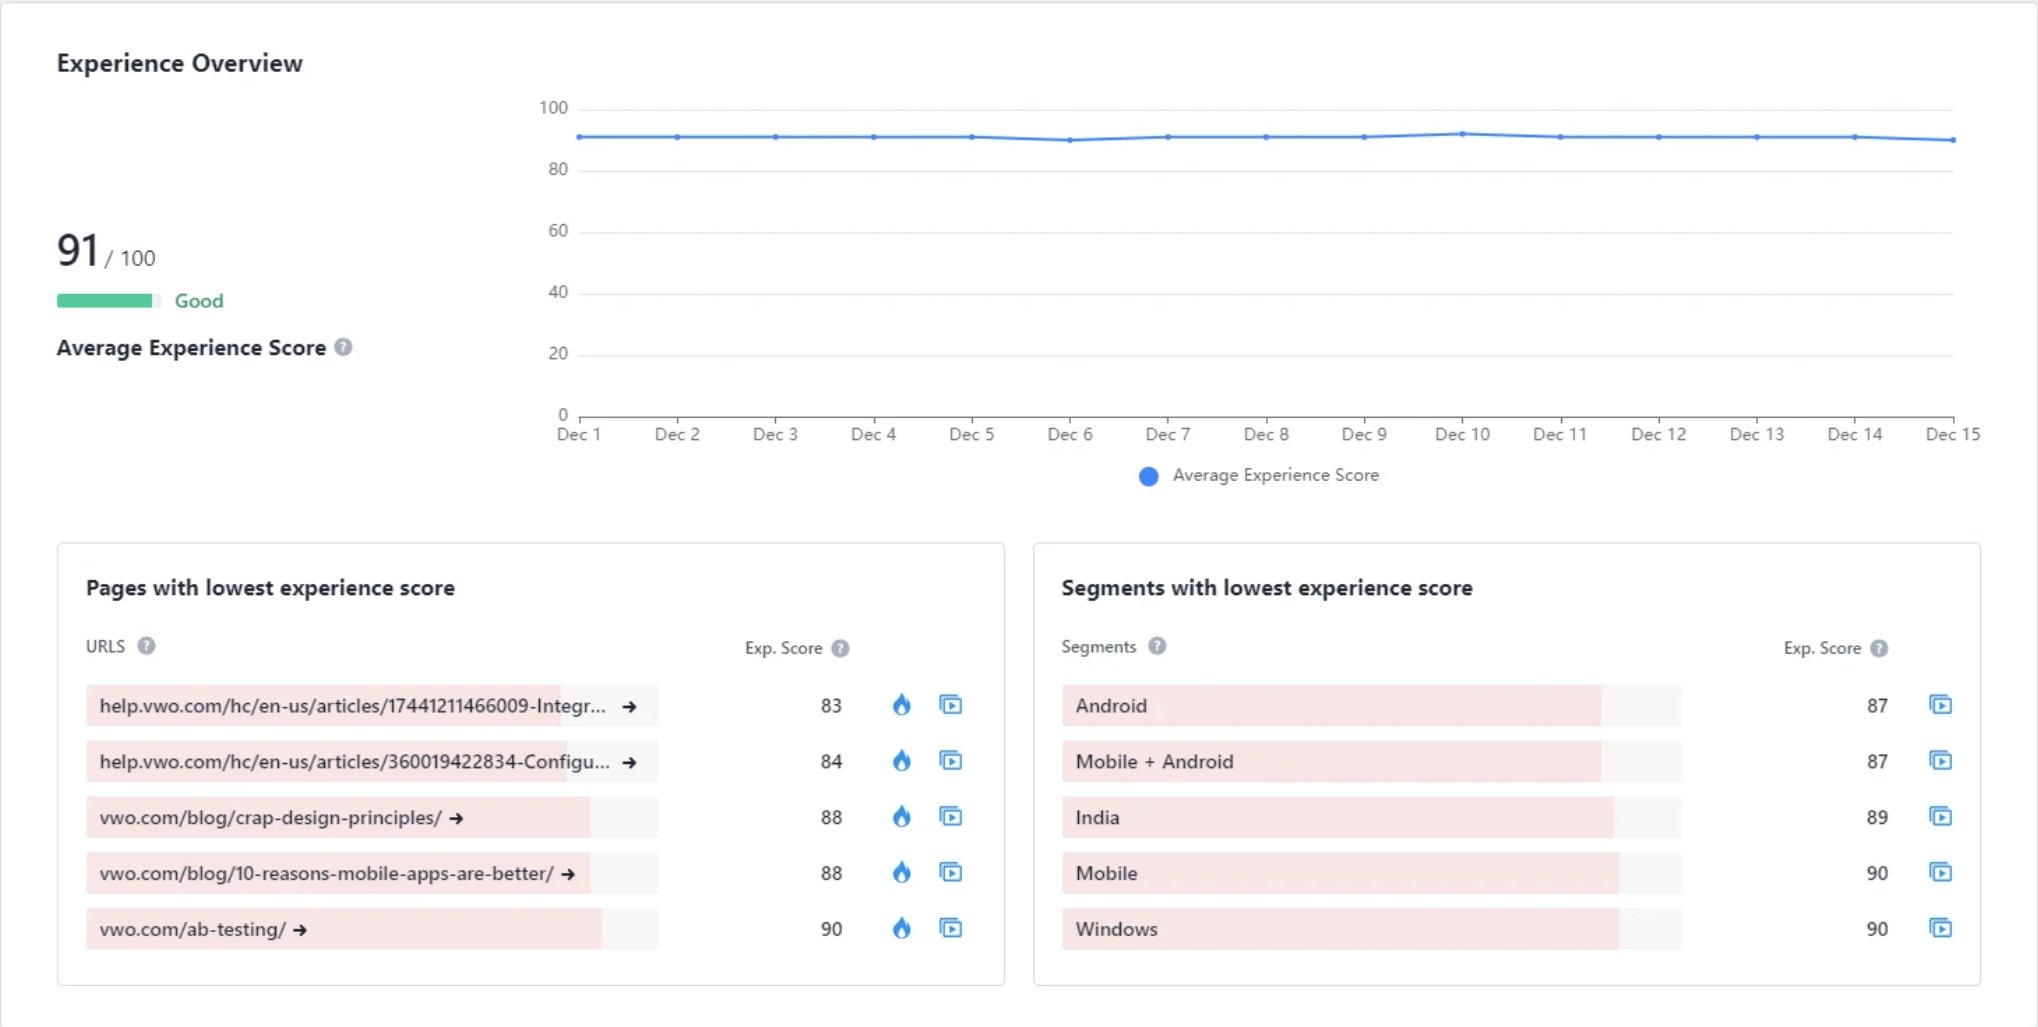
You can use heatmaps and session recordings for the lowest-performing pages, along with other page-level details like friction trends, errors on the page, segments with the lowest engagement, sessions with the lowest engagement, and so on. The dashboard also covers form performance and survey responses for a quick overview.
By bringing actionable insights to your fingertips, the dashboard saves you time and cuts down on effort. It makes finding problems and understanding segment-level behavior for each page easier, making the analysis process smoother and more effective.
What does Behavior Analytics mean for Product Managers, UX designers, and Marketers?
Behavior analytics is a game-changer for professionals across various roles in businesses today, enabling them to get to the root of user problems. Let’s see how product managers, marketers, and UX designers leverage behavior analytics for experience optimization.
Product Manager
A product manager can enhance feature adoption by prioritizing visitors’ input, addressing glitches, and improving the overall product experience. Leveraging behavior analytics plays a crucial role in this process that helps refine features based on visitors’ actual behavior and preferences.
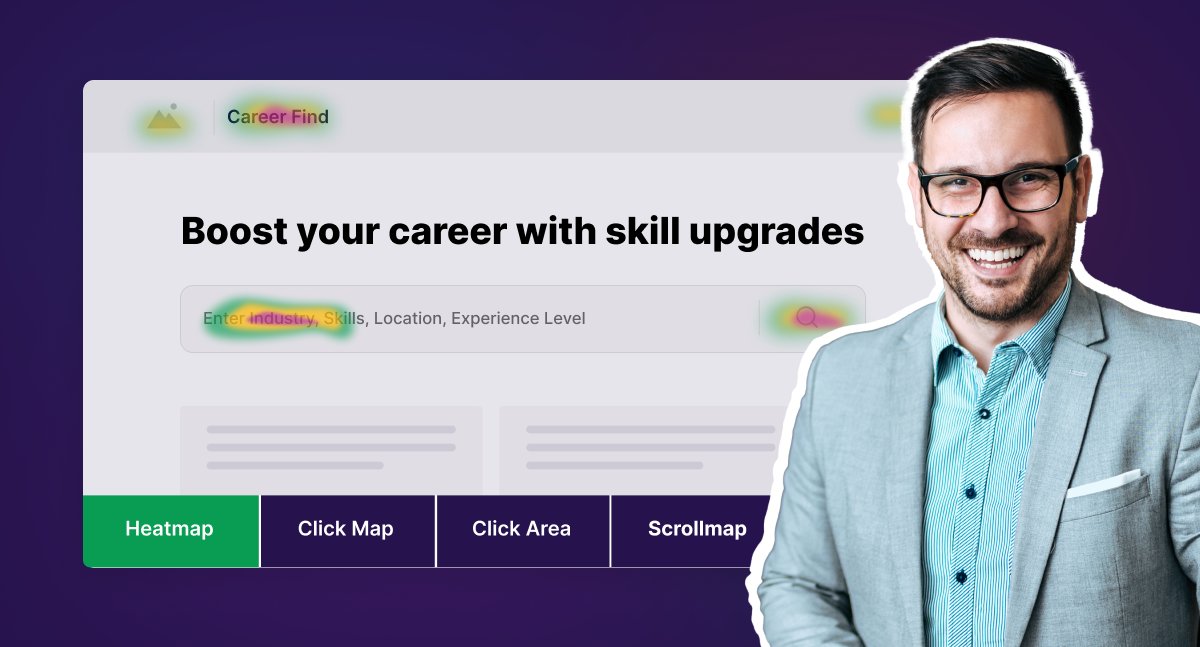
Consider this: As a product manager at an executive education learning website, you’ve been tracking the adoption rate of the new “Career Find” feature through your product experience platform, Userpilot. You see the numbers are not impressive, indicating that not many visitors are interacting with the feature as desired.
Warm colors in the heatmaps indicate that visitors are most engaged with the advanced search filter, featuring multiple boxes and different selectors like location, experience level, and industry. You see this area receives the majority of clicks compared to other sections of the page. To find out why adoption is low despite many people using the filter, you check session recordings for more details.
The recordings reveal that, after entering their criteria, the page loads for 7-8 seconds, displaying delayed results. This is the first roadblock because ideally, any page load time should be under 3 seconds.
Interestingly, visitors click through to a job page from the job listings results but often return to the “Career Find” page, eventually scrolling back to the search filter. The goal now is to understand what prevents them from fully exploring job pages and makes them go back to the search boxes.
To understand their concerns better, you initiate a survey on the career find page, seeking visitors’ feedback on the feature and discovering areas for improvement. The survey responses provide valuable insights: visitors want additional search options such as job type (full-time, remote, internships), salary range, and skills for more relevant search results.
Additionally, they need more comprehensive job details, including job descriptions, company information, images, website links, employee strength, and required qualifications for the post.
Currently, just stating the company name and role expectations isn’t enough for the visitors.
You now understand what’s lacking and where improvements are needed.
With these observations, you can enhance the feature to be more visitor-centric, thereby improving the overall experience and driving increased adoption.
UX teams
UX researchers and designers can enhance visitor flow by leveraging visual data insights, incorporating feedback, and eliminating navigation bottlenecks. Behavior analytics helps with this granular understanding by revealing visitors’ pain points, friction areas, and improvement opportunities.
A short hypothetical example can help you understand better: Emma, a skilled UX researcher at an online fashion store, observed a sudden increase in drop-offs from the cart page while reviewing the metrics in their analytics tool. This shows a clear disruption in their behavior flow, preventing them from following the expected journey on the website.
Instead of making assumptions, Emma sought an unbiased understanding of the issues. She turned to heatmaps to understand visitors’ behavior and explore ways to improve their journey.
Emma’s observations were intriguing. Firstly, she saw visitors engaging with the product quantity selector button the most as shown by warm colors. Secondly, not only did views decrease towards the bottom of the page, but the number of clicks on the ‘Proceed to checkout’ button was also lower. This indicates that visitors didn’t scroll down and, as a result, couldn’t find the button, which appeared below the initial scroll depth on the page.
To understand the reasons behind this click behavior, she delved into session recordings. Emma observed that although visitors clicked the quantity selector button, it didn’t help remove or add products, likely causing frustration. Moreover, visitors hardly scrolled down the page to click the check-out button. Eventually, they left without knowing it was at the bottom.
These observations convinced Emma that addressing these two major problem areas can smoothen visitors’ flow toward the checkout, making it easier for them to take the actions they want to on the website.
CRO experts and marketers
Marketers aim to boost website conversions by optimizing problematic areas, enhancing engagement, and tailoring experiences for visitors. In this regard, behavior analytics helps them understand how visitors navigate, what they like, and what might distract them from taking desired actions, impacting conversions.
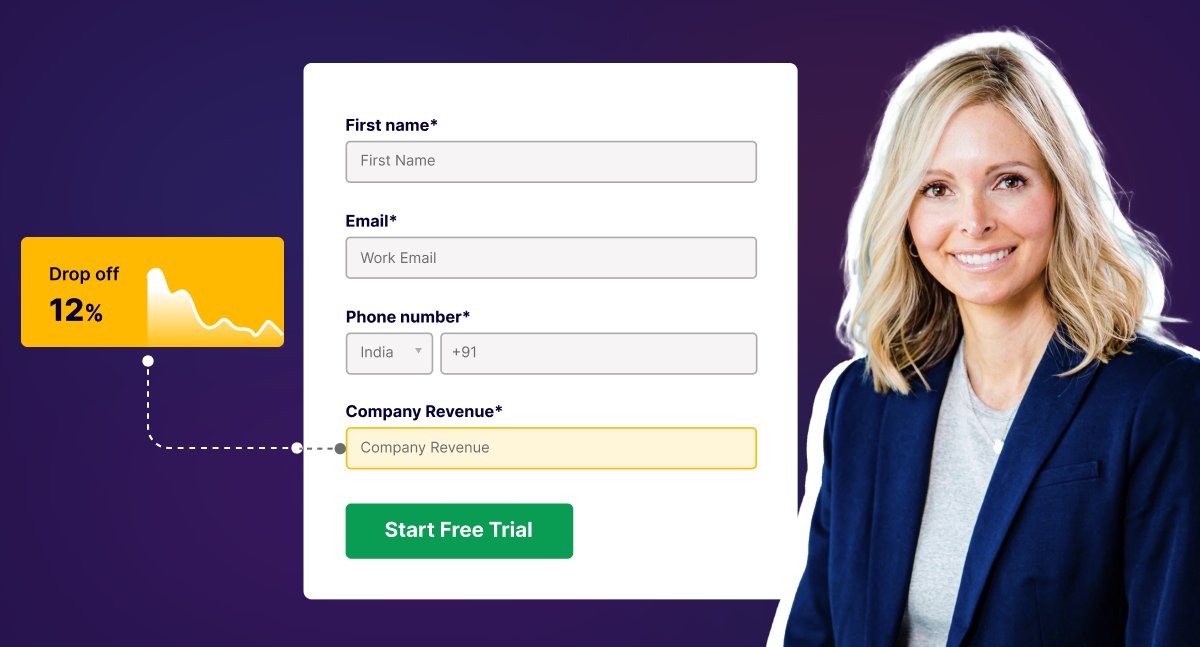
Consider this: As a CRO marketer at a consulting agency, you usually monitor form submissions on its website, tracking the lead flow into the conversion funnel. Things were going well, but this time, you noticed a 12% increase in visitors leaving the form without completing submissions.
The main culprit seems to be the field requesting visitors to share their company revenue—a new criterion for lead selection introduced by the company. It was decided to include the criterion here to filter out prospects that didn’t meet this field from the get-go.
You realize you need to look beyond the form and understand how visitors behave before and after interacting with it to get a complete picture. You observe dense red areas in heatmaps on the navigation menu, texts, and pictures on the left, while the form on the right exhibits low engagement in cooler colors.
For even better analysis, you watched recordings of what a visitor’s behavioral flow looks like on the website. What is distracting them from noticing the form? Is there something that they find more interesting? Watching their movements is key to solving this mystery. In the recordings, you observe that although visitors move their mouse over the form, they pause frequently, indicating hesitation.
This made you realize that asking about the company’s revenue might be too much for them at this point. Because the drop-offs from the form were manageable or within acceptable levels before adding the specified field. Now that you know where people are having a hard time, you can optimize the form and see if it improves form conversions again.
How will visitor behavior analytics contribute to your business?
Investing in visitor behavior analytics provides you with a wealth of actionable insights that can be translated into growth strategies contributing to the overall success of your business.
Early detection of potential issues
Monitoring visitor behavior through analytics tools allows you to detect potential issues or roadblocks in the visitor journey early on. Whether it’s a poorly performing landing page or a cluttered form, identifying and addressing issues promptly helps maintain a good visitor experience before they start affecting your conversion rates and the bottom line of your business.
Reduced bounce rates
Analyzing visitor behavior helps spot friction points that prevent them from taking the desired actions on your website. When you address these challenges, you create a smoother experience for them, encouraging them to spend more time on your website. Visitors finding what they are looking for easily can help reduce bounce rates and, in turn, improve conversions.
Data-driven decision-making
Data is the fuel that powers your decision-making process. Hence, basing your strategies on actual visitor interactions enables you to resonate with your audience and drive more business success.
Personalization opportunities
By understanding how visitors interact with your website through heatmaps and session recordings, you can tailor content, recommendations, and various other touchpoints to their preferences. For instance, if you see a segment of visitors most engaged with your forms after applying filters, you can target them with more relevant and personalized offers to push them to the next level in your conversion funnel.
Enhanced customer retention
Understanding visitor behavior and gathering their direct feedback (surveys) can give you insights into their needs and expectations. When you use this information to enhance your website, product, or services, you align with their expectations, fostering customer satisfaction and loyalty. This way, they stick around for a long time with your brand.
Final thoughts
Cutting corners on visitor research is a risky decision that can backfire. If your offering doesn’t align with their preferences and expectations, your efforts could go to waste. Don’t you think it would be worthwhile to align it with their behavior and make them feel valued?
With the incredible capabilities of VWO Insights, why delay adding this powerful tool to your tech stack to ensure a top-notch experience on your website? If you’re on board to give it a try, start with our free trial. And if you see the value in supporting your growing business ambitions, scaling up to a paid plan is just a smart move away. Happy researching, and improving!
Categories:


![10 Best Enterprise Analytics Platforms [2026]: Expert Picks with Reviews and Comparisons](https://static.wingify.com/gcp/uploads/sites/3/2025/08/Feature-image-10-Best-Enterprise-Analytics-Platforms_-In-Depth-Reviews-and-Comparisons.jpg?tr=w-300,h-150)


