
What is visitor segmentation?
When an A/B test is created at VWO, by default all the visitors are included in the experiment, and the objective of the experiment is to evaluate the conversion rate changes at a population level. The overall conversion rate estimate can be thought of as the performance of an average user, however, different sub-groups in the population may behave differently to your product/experience and can have different conversion rates.
There can be a subset of visitors with some shared attributes that have a conversion rate very different from the conversion rate when all visitors are considered for analysis. Suppose your website is catered to serve the needs of an English-speaking audience and the overall conversion rate of purchases is around 2%. As you further analyze your visitors, you found that the traffic on your website also involves a good percentage of Spanish-speaking visitors. By evaluating only Spanish users you observed a sharp decline in conversion rate from average to 0.5%. Based on this analysis, you can develop a personalization strategy to build a Spanish version of your website to improve the experience of Spanish users which eventually may lead to an overall improvement in conversion rate.
Segmenting visitors on different dimensions lets you discover whether there’s a group that responds to your experiment differently from the average population. And as you identify those segments you can target those visitors differently to drive up the overall conversion rate on your website.
Why is it important to analyze visitor segments?
As businesses grow and reach a certain level, segmentation analysis becomes important to move the metrics in a positive direction which otherwise remains saturated when the decisions are made looking only at metrics at an aggregate level.
An A/B or MVT test reports results for all the visitors included in the test. This is useful to identify general trends but that doesn’t talk about any specific trending with certain groups. For example, say visitors from the US are mainly the driving force in conversion rate. Patterns like these get hidden when you look at the data at an aggregated level and can only be revealed when you break that data down into groups.
Also sometimes bugs may get introduced when creating an A/B test where a certain variant may not work for visitors belonging to a particular segment. Post-test segmentation can help you discover whether any of the variations are still buggy. It, therefore, provides a mechanism to QA your experiment.
Dimensions of visitor segmentation
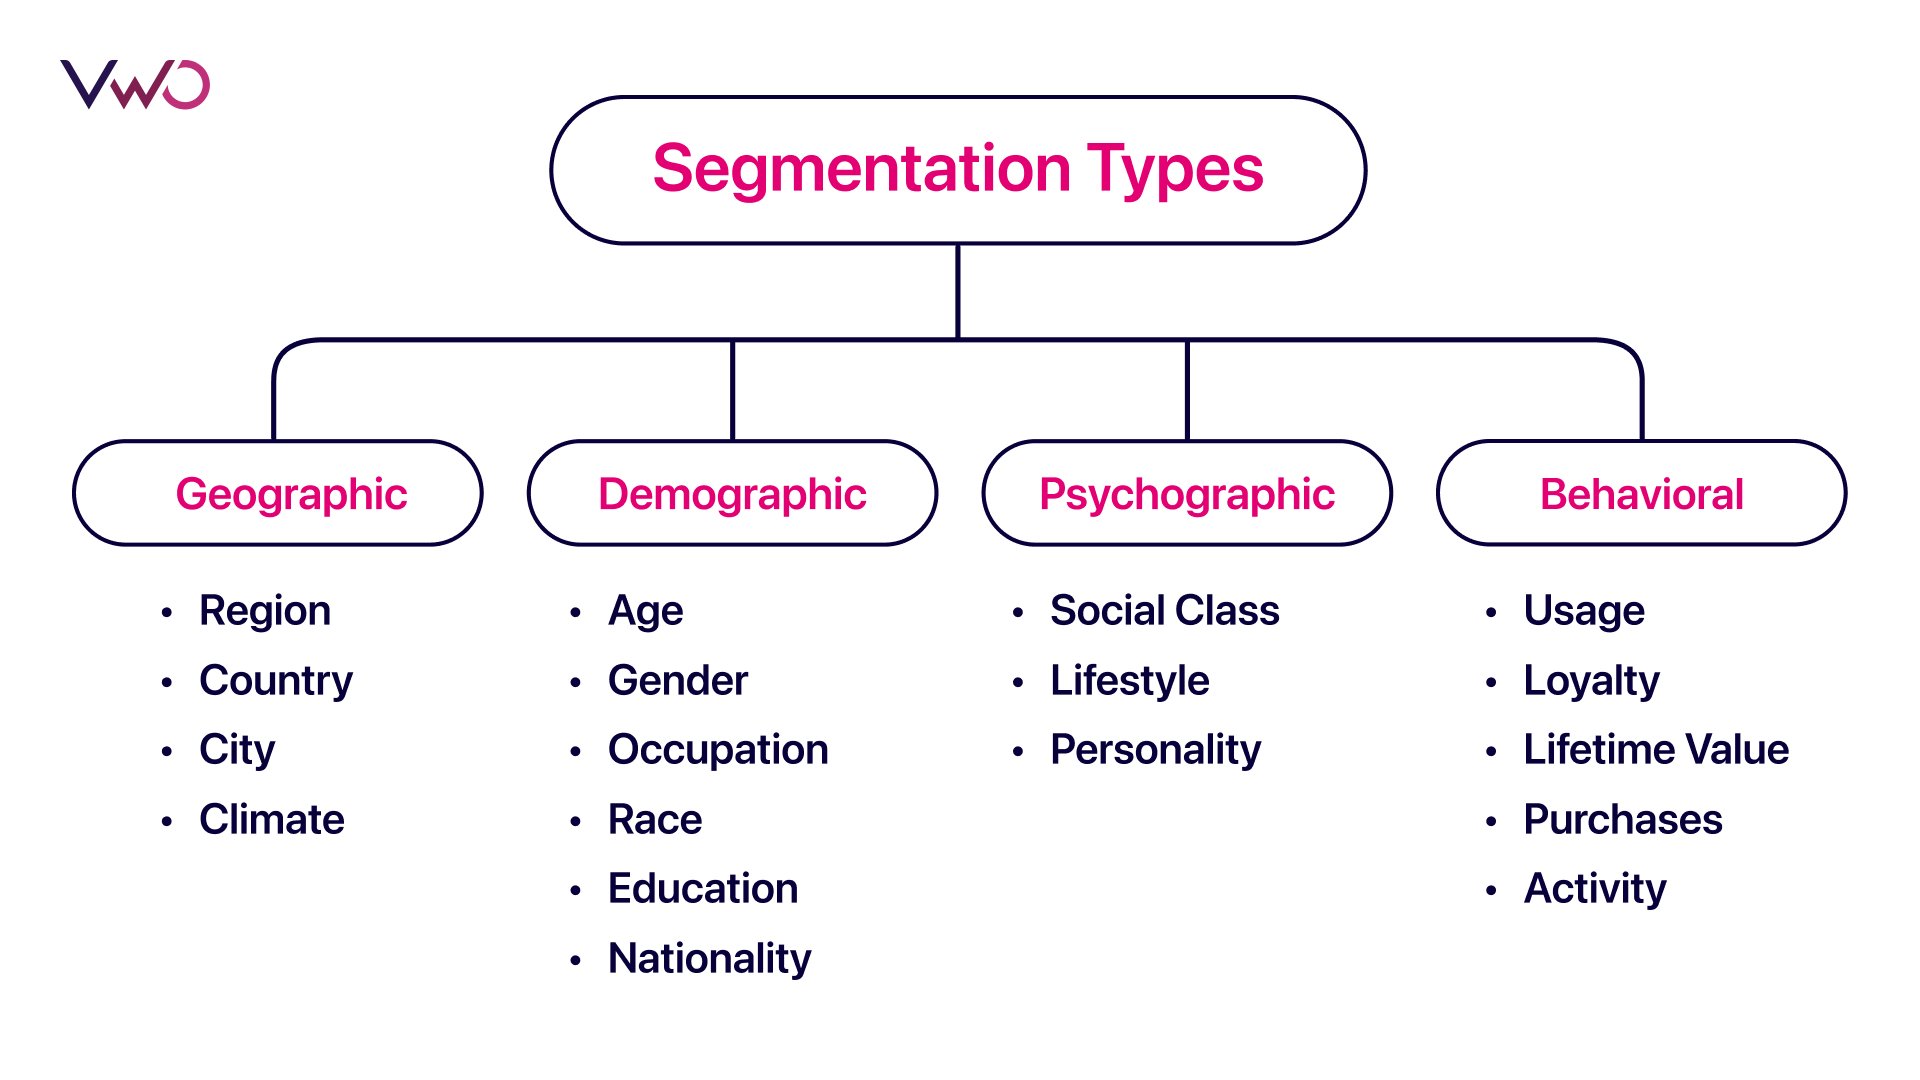
After the test has run and sufficient data has been collected, further analysis can be performed on several visitor dimensions to gather more insights and drive personalization in the future. This segmentation can be performed on single dimensions or in combination with multiple dimensions. The four broad dimensions to segment visitors are:-
- Geographic Market Segmentation
- Demographic Market Segmentation
- Psychographic Market Segmentation
- Behavioral Market Segmentation
Deterministic vs. discovery segmentation on post-test data
After you decide on what dimension to create a segment on, the next question comes how to do segmentation. There are two main alternative approaches when it comes to segmentation:
| Deterministic | Discovery |
| Based on a hypothesis and utility to business, segments are analyzed to see if there is any interesting behaviour shown to them. | Segments are discovered using data mining and statistical algorithms to look for differences in user behaviour. |
| As the utility of a segment is already built inside the hypothesis from the beginning, therefore, this generally doesn’t require further extensive analysis. | Further analysis is done to derive if the segments are meaningful. Just because something is statistically significant doesn’t mean that it is necessarily strategically significant. |
| Identification of interesting segments which are meaningful, interesting, and useful is difficult here, particularly when dealing with large and complex data sets. | Since the discovery of segments is handled by the algorithm. This analysis can result in identifying patterns that may not be known earlier |
As both segmentation approaches are performed on observational data, several segments can be found significant due to a statistical error. When more segments are analyzed from the observational data, the probability to find segments that achieved statistical significance increases which increases the chances of higher false positives. Therefore is it important to run follow-up tests to validate the segmentation results.
What segments can be classified as interesting?
Any personalized decision you make for a segment will have a visible effect on the overall business metrics only if a good population belongs to that segment. Consider two segments X and Y with the following properties:
- The population of visitors belonging to X: 20%
- The population of visitors belonging to Y: 1%
Efforts put into improving the experience of visitors belonging to segment X will have more impact than those Y. Therefore only those segments should be selected and analyzed further that have a proportion of visitors above a certain threshold.
After determining segments that satisfy the minimum support criteria, they can further be selected and categorized under the following taxonomy –
- High-performing segments – These show a High Conversion Rate from the average conversion rate of the campaign.
- Worst-performing segments – These show a Lower Conversion Rate than the average conversion rate of the campaign.
- Segments with a different winner than the campaign winner – In an A/B test, if after a test variation B is declared as the winner but for a certain segment variation A is the winner then that segment is considered interesting.
If the interesting segments are decided by dissecting the post-test data on different dimensions; Then before deciding to take any action from the results, it is recommended to run follow-up tests for specific, well-performing segments.
Through a continuous cycle of exploration and refinement with segmentation, you can create a personalized experience for visitors to your website. Using VWO’s visitor dimension feature you can see the breakdown of test results across the selected visitor dimensions. Take a free trial to try out this feature for yourself.


