
Follow us and stay on top of everything CRO
Read summarized version with
Heatmaps turn number crunching into an interesting and insightful visual journey, making data interpretation an absolute breeze.
No wonder companies are integrating heatmap generators into their tech stacks to achieve effective data analysis.
But how does one choose the right heatmap generator? How does it work? What are its use cases in different industries?
This blog answers all your questions, so you can quickly start your behavior analysis journey with the necessary information in hand.
What is a heatmap?
A heatmap is a graphical representation of numbers using colors. This technique is applied across many disciplines to make complex information and data sets very simple and highlighted for easy understanding of trends and patterns. You don’t need assistance to understand heatmaps as they are pretty self-explanatory.
What are heatmaps good for?
Here’s how heatmaps can help you with analysis by simply using color gradients:
Improved data visualization
Heatmaps condense difficult data into stunning visualizations, easy to comprehend at one glance; therefore, they provide instant insight into trends and anomalies. For example, financial markets are represented by the visual heatmaps of stock performance metrics. Thus, traders can more readily recognize the market trends with one glance and make appropriate investment decisions on time.
Decision support
Heatmaps can be used in any domain to pinpoint areas of critical interest or concern, helping users make informed decisions. For instance, they could be applied in healthcare to show the trend in the prevalence of a disease or the exact origin point of an outbreak, which would guide the policymakers in resource allocation for public health interventions effectively.
Understand user behavior
By using heatmaps, businesses can analyze how visitors interact with their websites and refine optimization strategies to enhance their experiences. Let’s say, clickmaps show the places where on an eCommerce website, visitors most commonly click. This can help you optimize product placement and promotional strategies for more sales.
Efficiency in resource allocation
By analyzing heatmaps to identify areas of high demand or activity, companies can strategically allocate resources and schedule tasks effectively. This approach optimizes workflow management, prevents overburdening of resources, and enhances overall operational efficiency.
Scientific discovery and innovation
Heatmaps in scientific research identify patterns in biological, environmental, or experimental data. These patterns can be linked to the discovery of new phenomena and the development of new technologies in medicine, genetics, and other environmental sciences. For example, biomedical heatmaps on gene expression give information on gene activity in varied cell types or different conditions of diseases. This helps in the advancement of targeted therapies and personalized medicine.
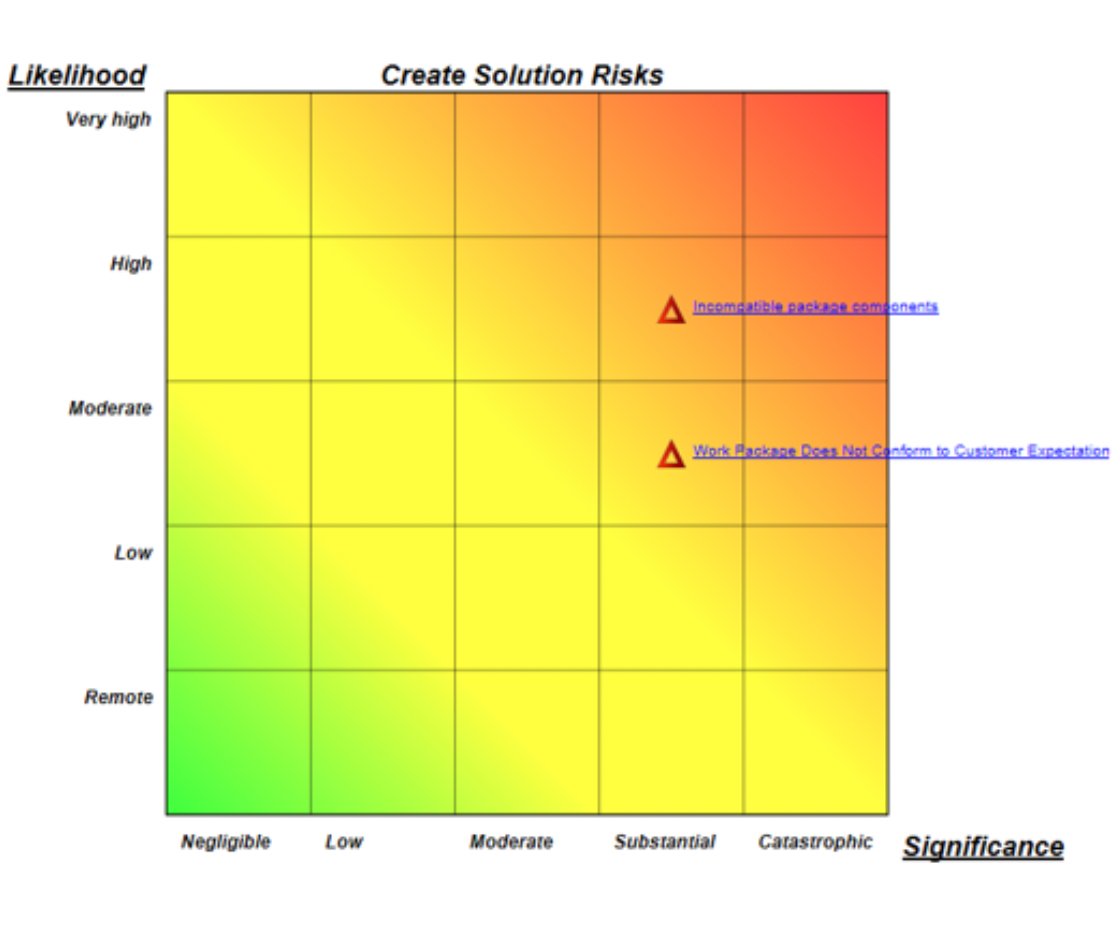
Risk assessment and management
Heatmaps play a very important role in risk assessment and management related to financial and insurance industries. They depict risk exposure concerning portfolios or geographic regions, thus allowing risk managers to proactively identify and mitigate potential risks.
What is a heatmap generator?
A heatmap generator is a tool or software that helps you generate heatmaps—a way of representing data using colors to signify any values.
How to choose a heatmap generator?
Here are some factors to consider when selecting a heatmap generator.
Type of data and visualization needs
Ensure that the heatmap creator caters to your data type, be it geographical, numerical, or categorical, and the style of visualization to be used, such as choropleth maps, density maps, or hierarchical maps.
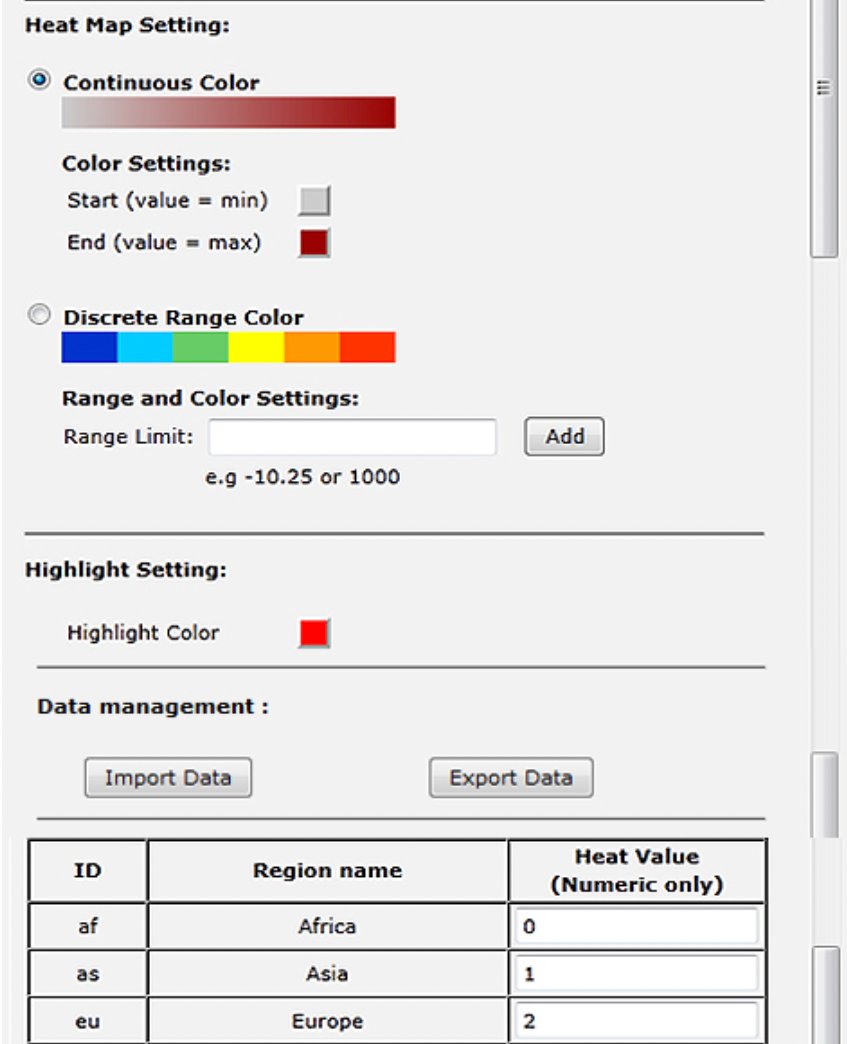
Features and customization options
The heatmap should have all the necessary features—custom color schemes, legends, tooltips, and interactivity features such as zooming or filtering—that can customize visualizations to your liking.
Ease of use and learning curve
Select a heatmap creator that best suits your level of technical expertise and has an easy-to-use interface. Some tools will have drag-and-drop functionality and templates to ease the process of visualizing heatmaps without long strings of code.
Integration and compatibility
Look out for whether or not the generator easily integrates with other tools or platforms one might use, like Excel spreadsheets, Google Sheets, or data visualization software. Smooth integration would let you save time and effort in workflow and data management.
Privacy and security
Ensure that the heatmap generator adheres to all data security standards by providing features such as data encryption, role-based access controls, and compliance with various regulations.
What can I use a heatmap generator for?
Here are several applications of heatmap generators in different industries:
Health
Heatmaps that are generated by dedicated heatmap creators are used to monitor patient results, mapping diseases, and resource usage and allocation. These tools visualize demographics, the efficacy of treatments, and hospital resource utilization to improve the quality of care delivered and operational efficiency.
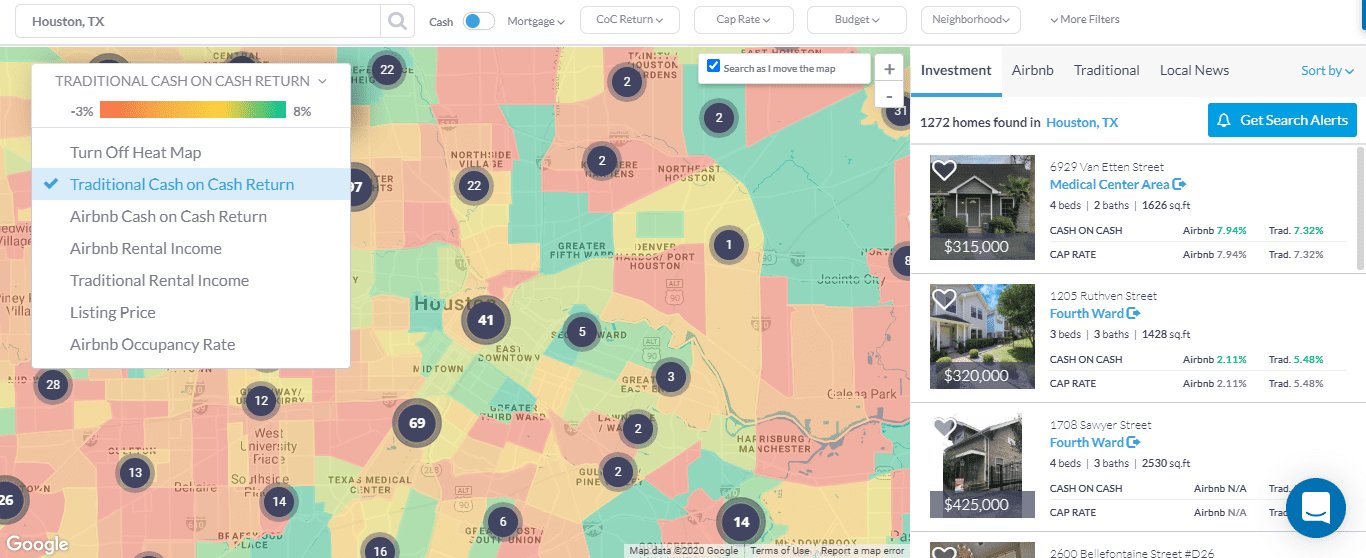
Real estate
Heatmap generators are utilized by real estate professionals for visualizing property values, rental yield, and market dynamics. Useful for defining profitable investment opportunities, such tools depict the demographic data and trends.
Marketing and advertising
These heatmap generators are an essential tool for marketers in analyzing user engagement with digital content and promotions on websites. They indicate click-through rates, what users do on websites, and how ad placements work. These data guide the optimization efforts for increased ROI and campaign effectiveness.
Transportation and logistics
Transportation and logistics businesses rely on heatmap generators to visualize traffic trends in locations, delivery routes, and distribution centers. This data-driven approach allows companies to optimize operational efficiency and reduce costs effectively.
Urban planning and development
Urban planners use heatmap generators to visualize the density of the population, infrastructure needs, and community service demands. They inform decisions on urban development, allocation of resources, and public policy—making the cities livable and sustainable.
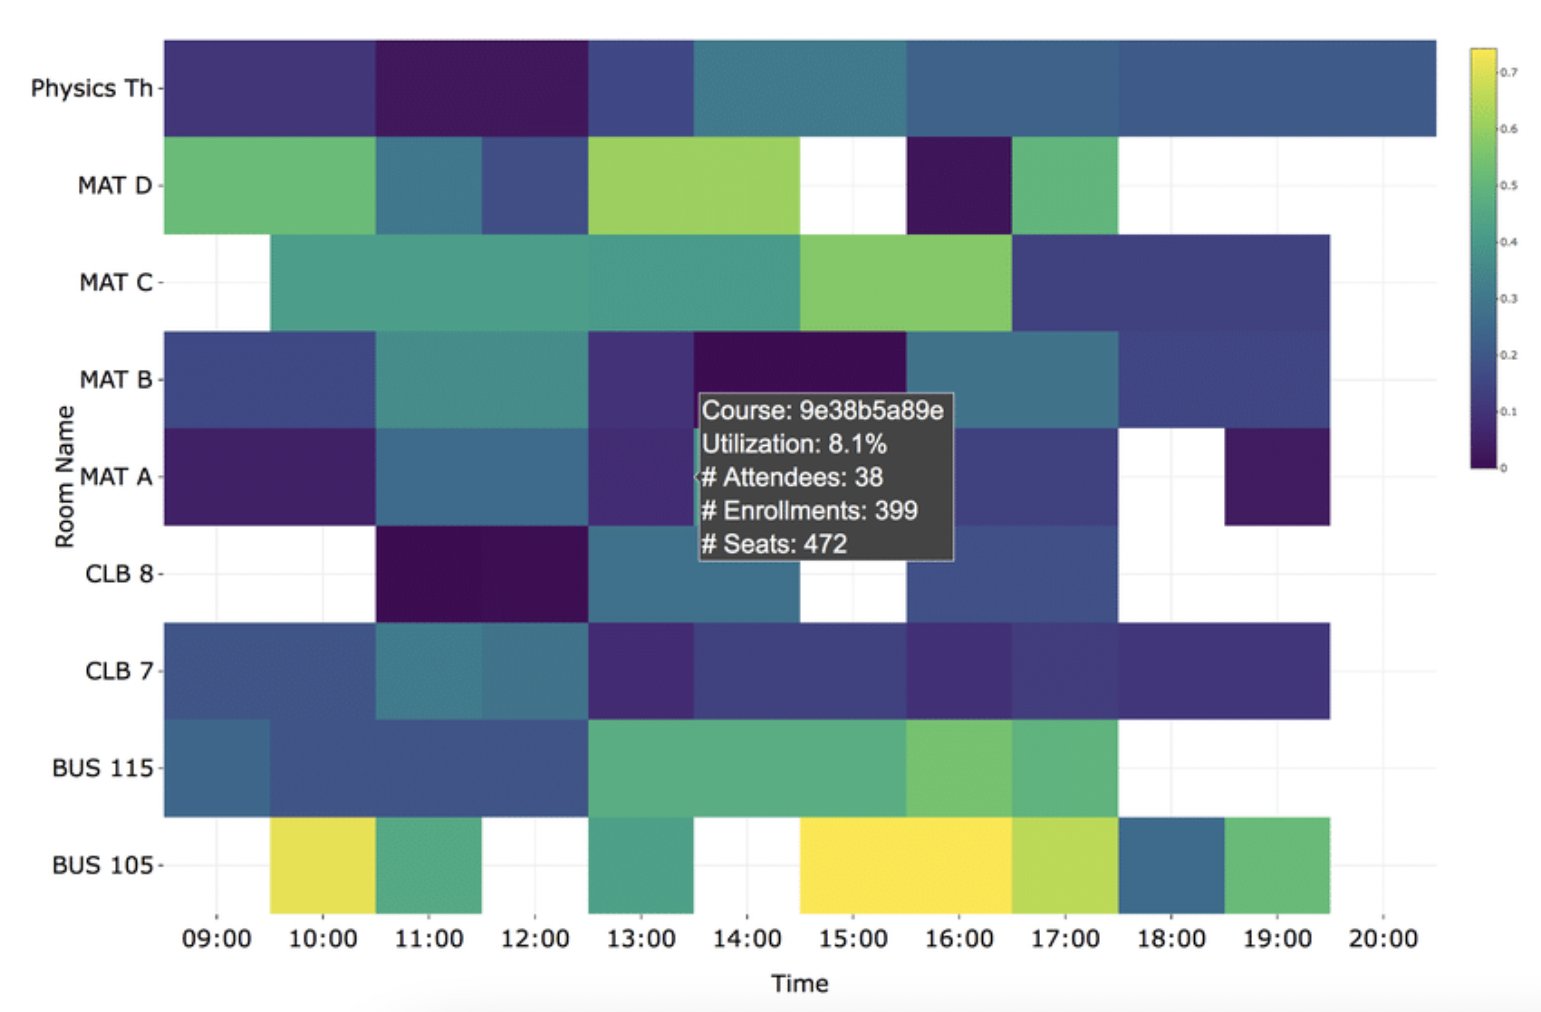
Education and eLearning
In education, heatmap generators are applied for monitoring student engagement and course effectiveness. The tools tactfully visualize student interactions with online content and very easily enable the educator to identify learning gaps and fix instructional design flaws.
Which types of heatmap should you generate?
The kind of heatmap to be generated will depend on the type of data and the understandings to be derived. Find some options below:
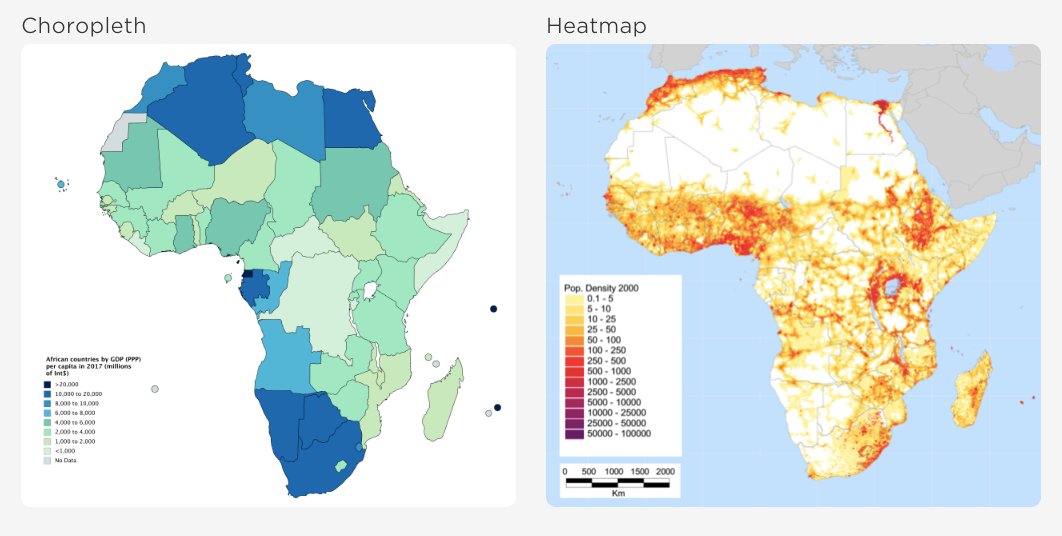
Density heatmap
A density heatmap uses color gradients to represent the highest density of data points within a given area. Often used in geographic maps and web analytics, the heatmap displays more intense activity or data points in warmer colors and less intense areas in cooler colors. This quickly conveys data distribution and intensity across a two-dimensional space.
Choropleth heatmap
A choropleth map is a thematic map in which different geographic areas are shaded to the value of the variable being represented. These maps show data aggregated by predefined geographic regions, as in population density, average income, or election results. The color gradation on the map moves from light to dark to indicate the state of low to high values for each area.
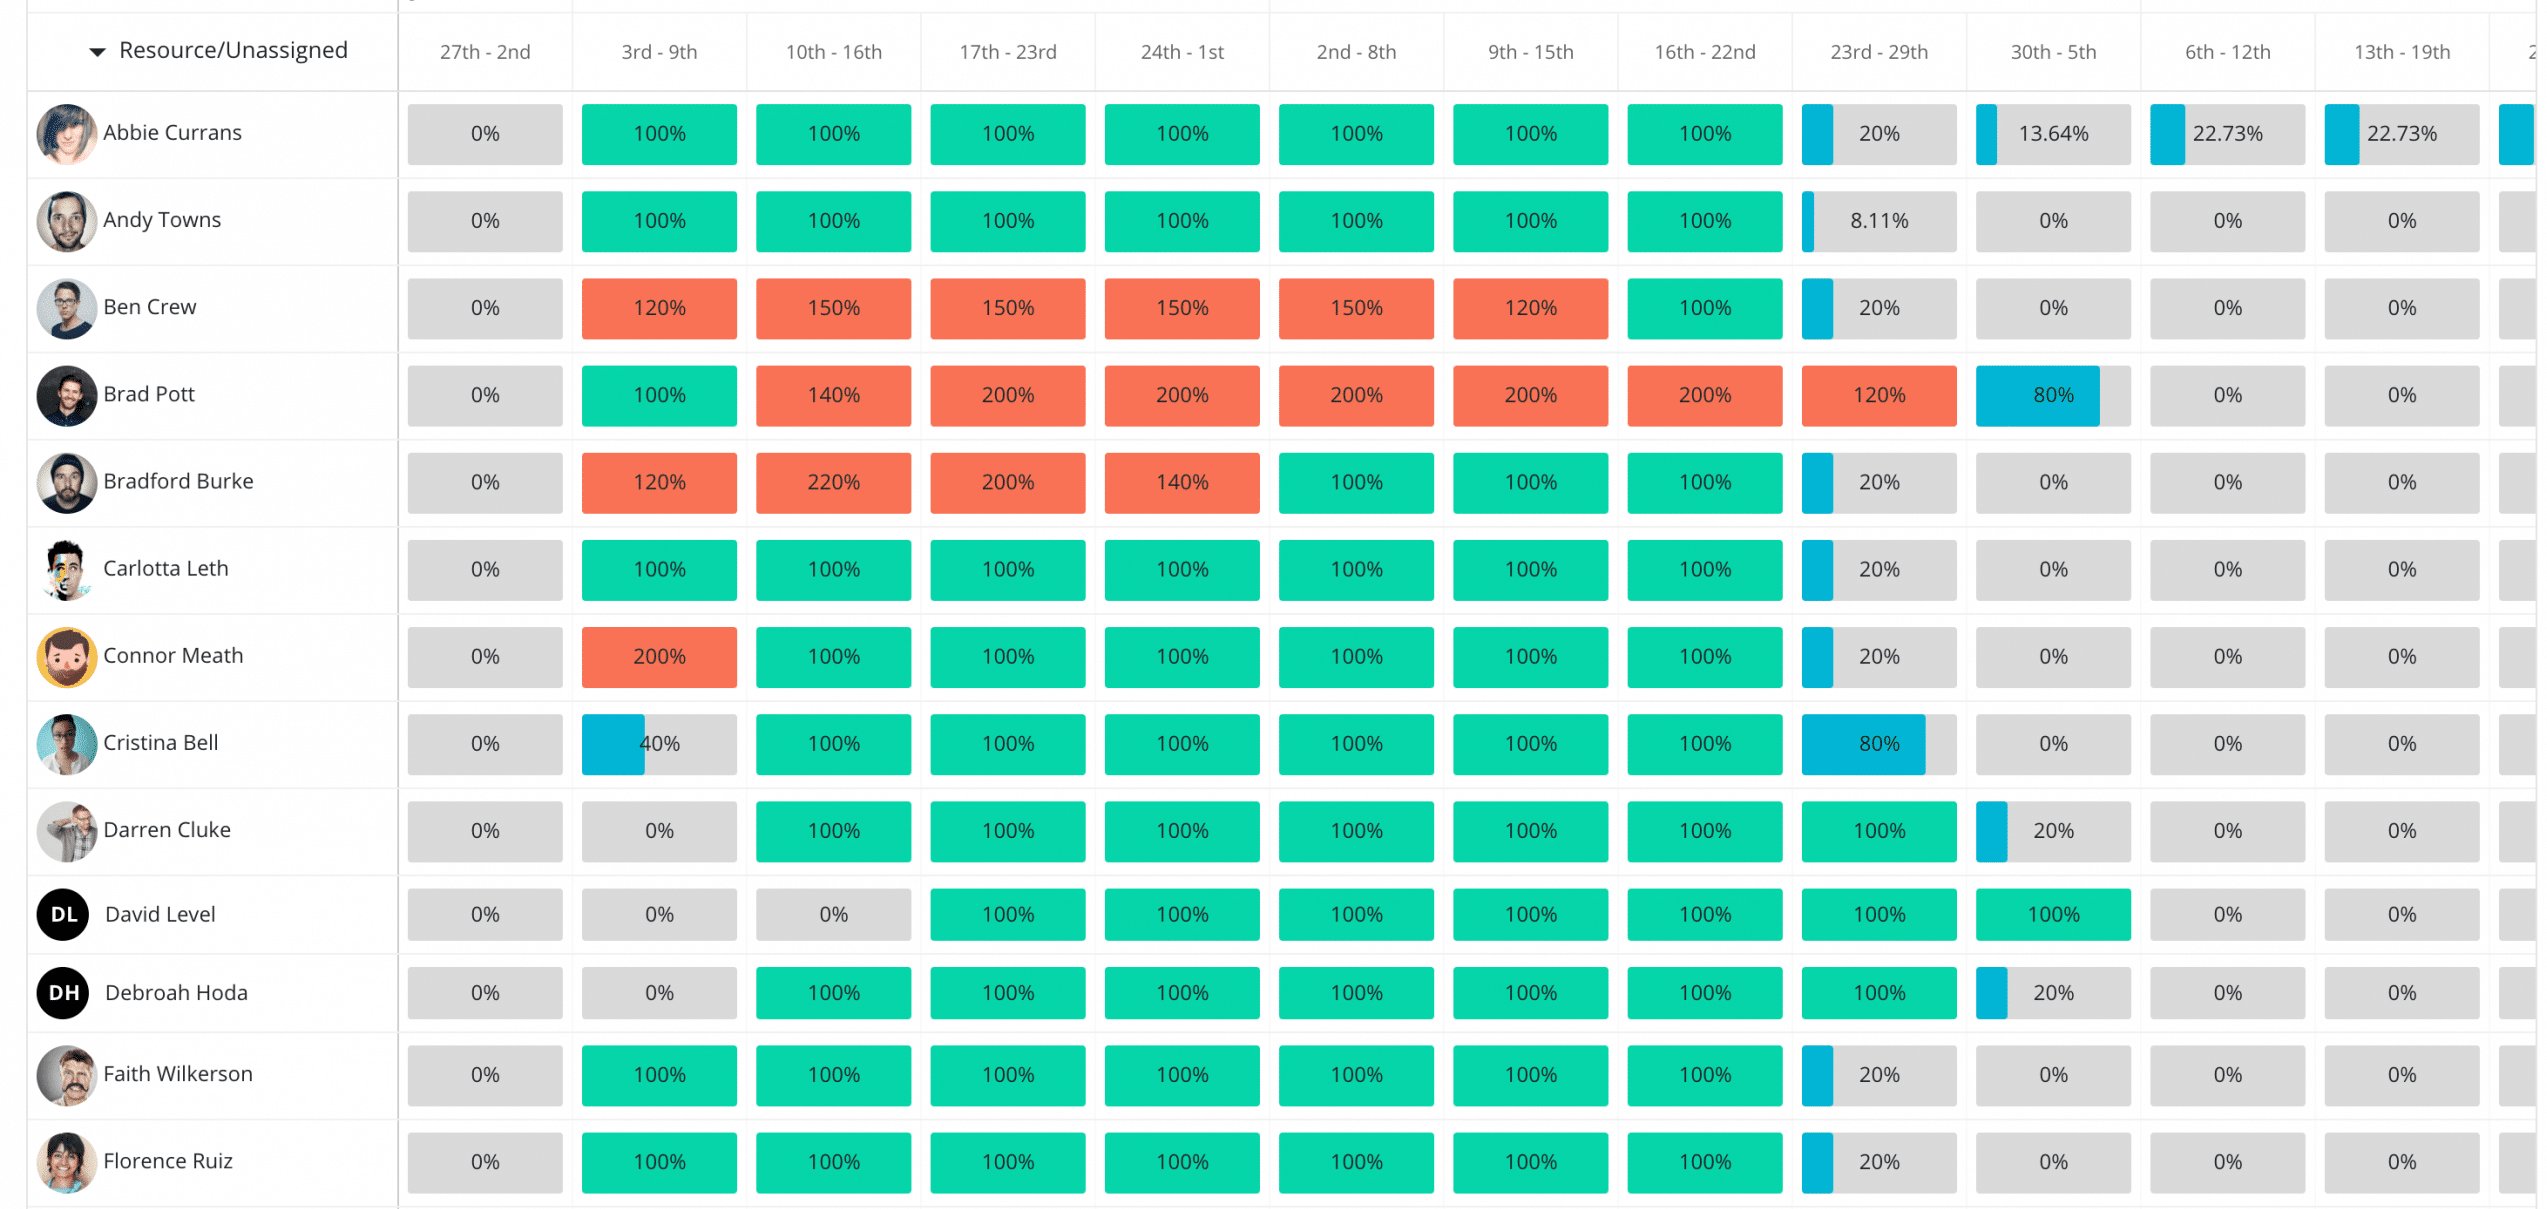
Hierarchical heatmap
Hierarchical heatmap conveys the relationship between multiple variables using color gradients and clustering. Data is organized in a matrix in which rows and columns represent different variables, and values, on the other hand, are represented by colors. This type of heat map helps with visualizing complex data sets and discovering hidden structures.
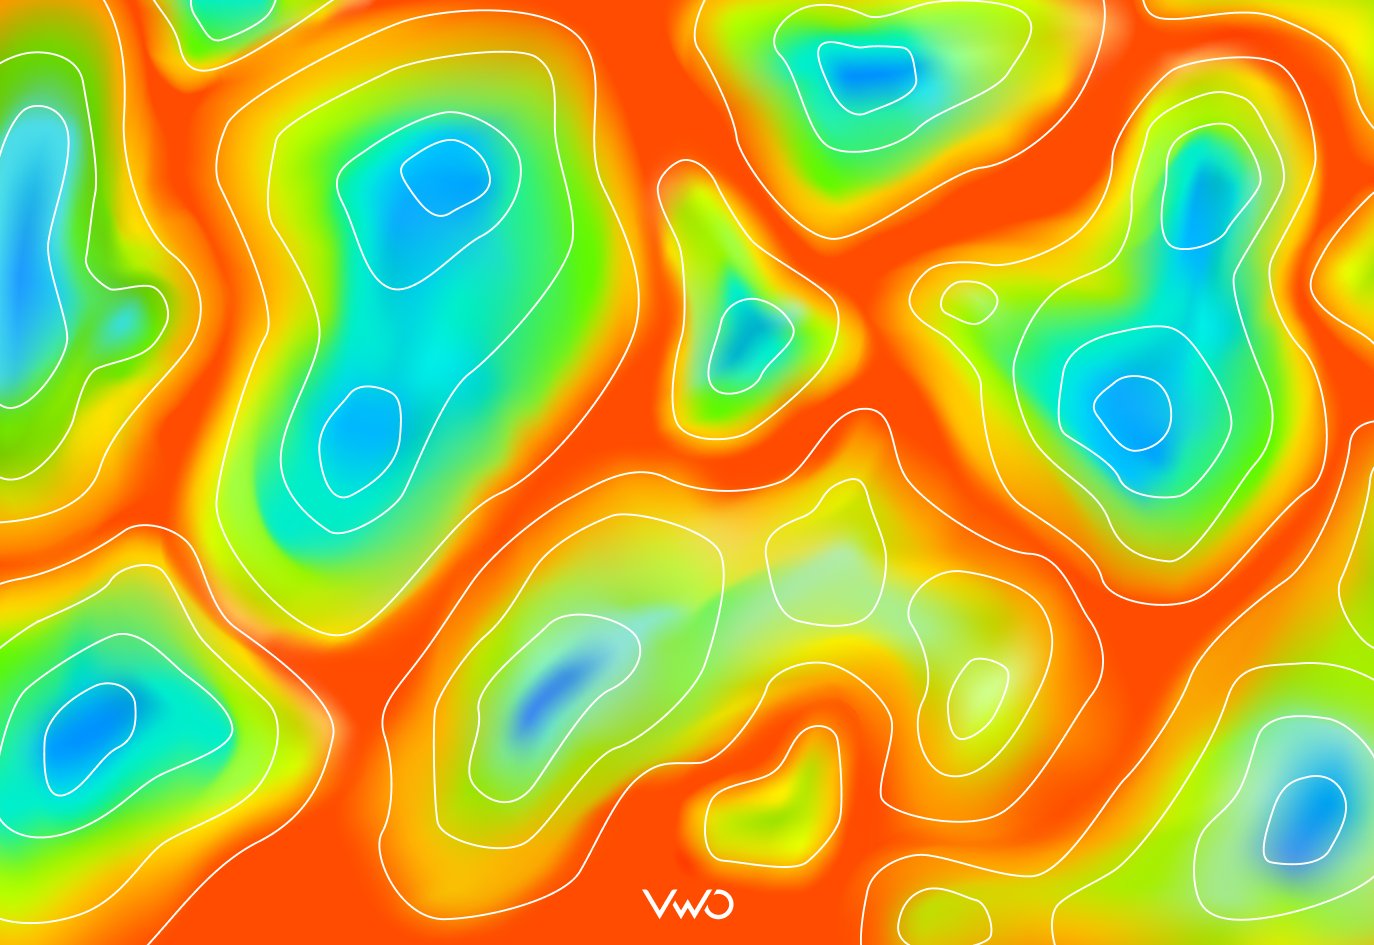
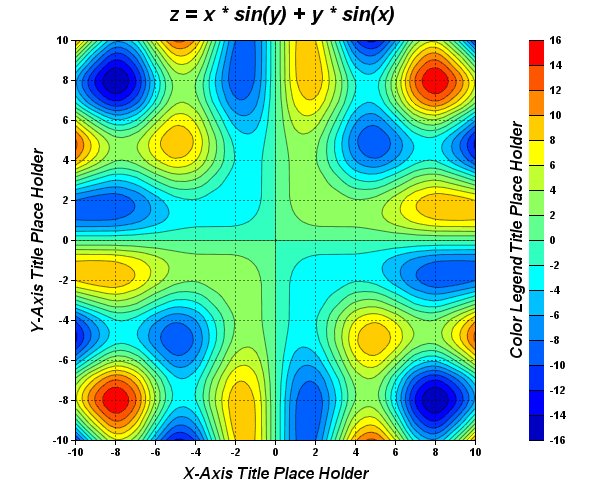
Contour heatmap
It displays the contours or lines that represent levels of a continuous variable. This comes in quite handy while dealing with terrain or elevation data. Example: Visualizing elevation levels on a topographic map.
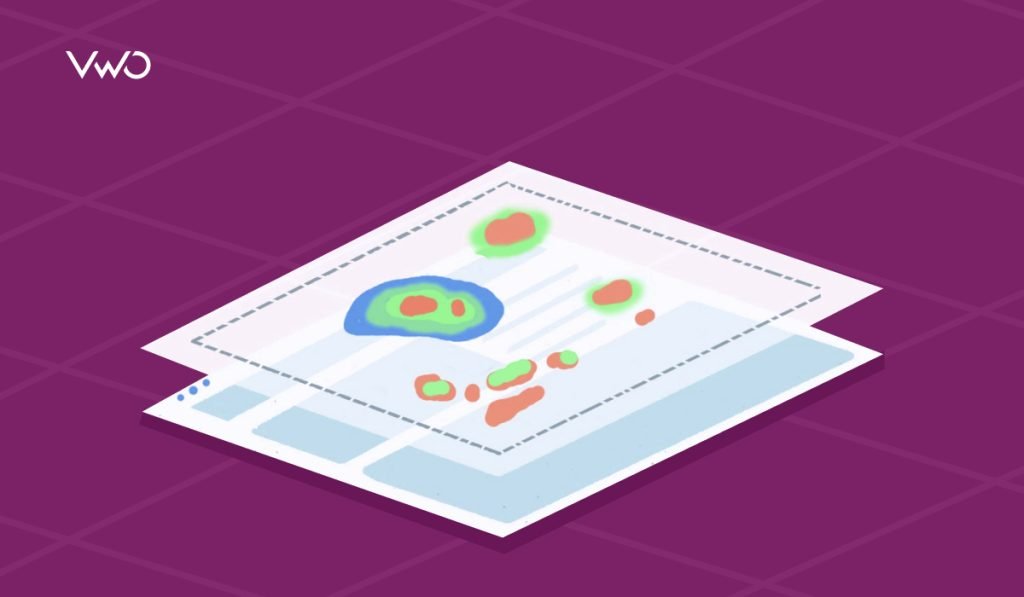
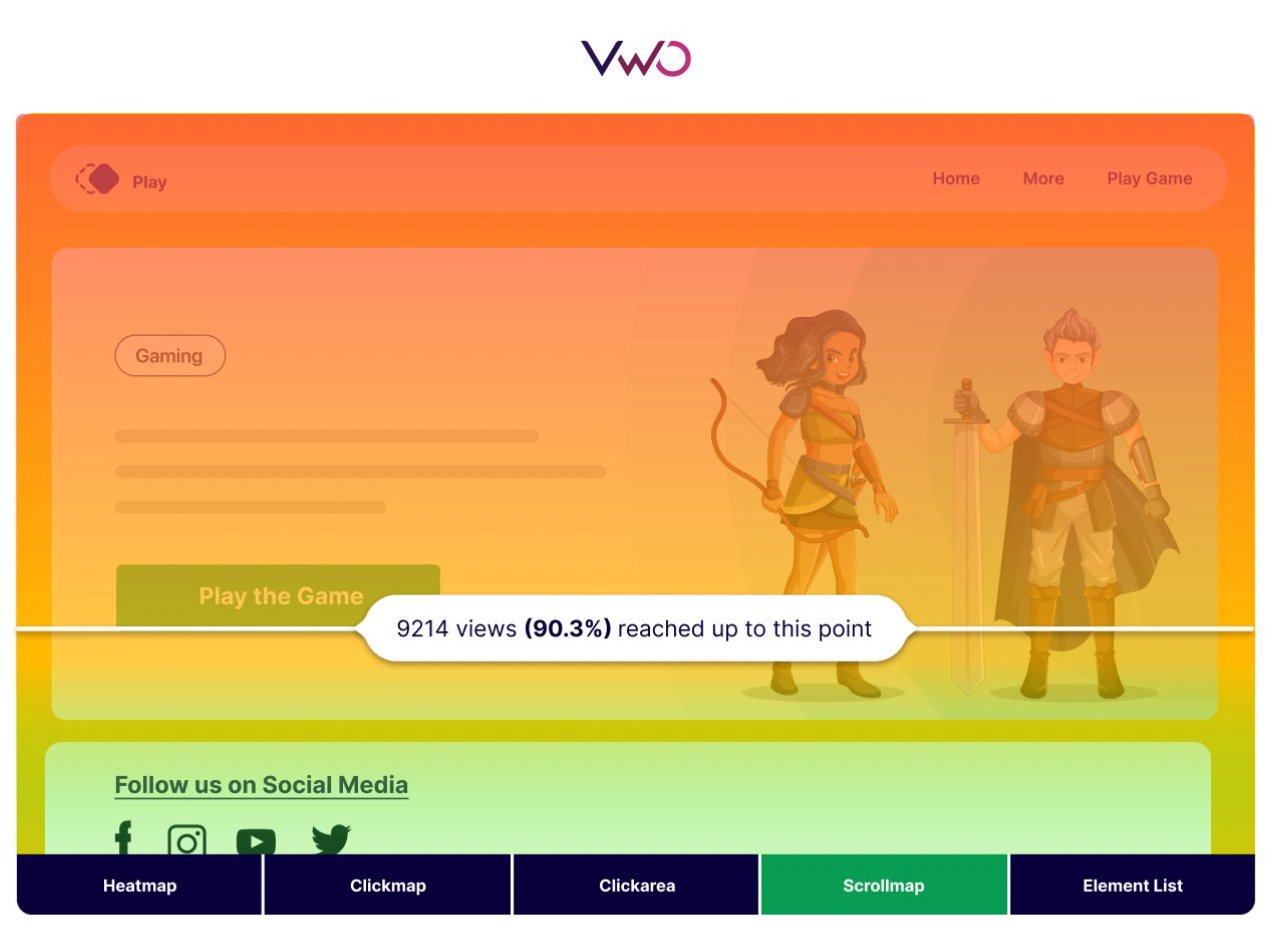
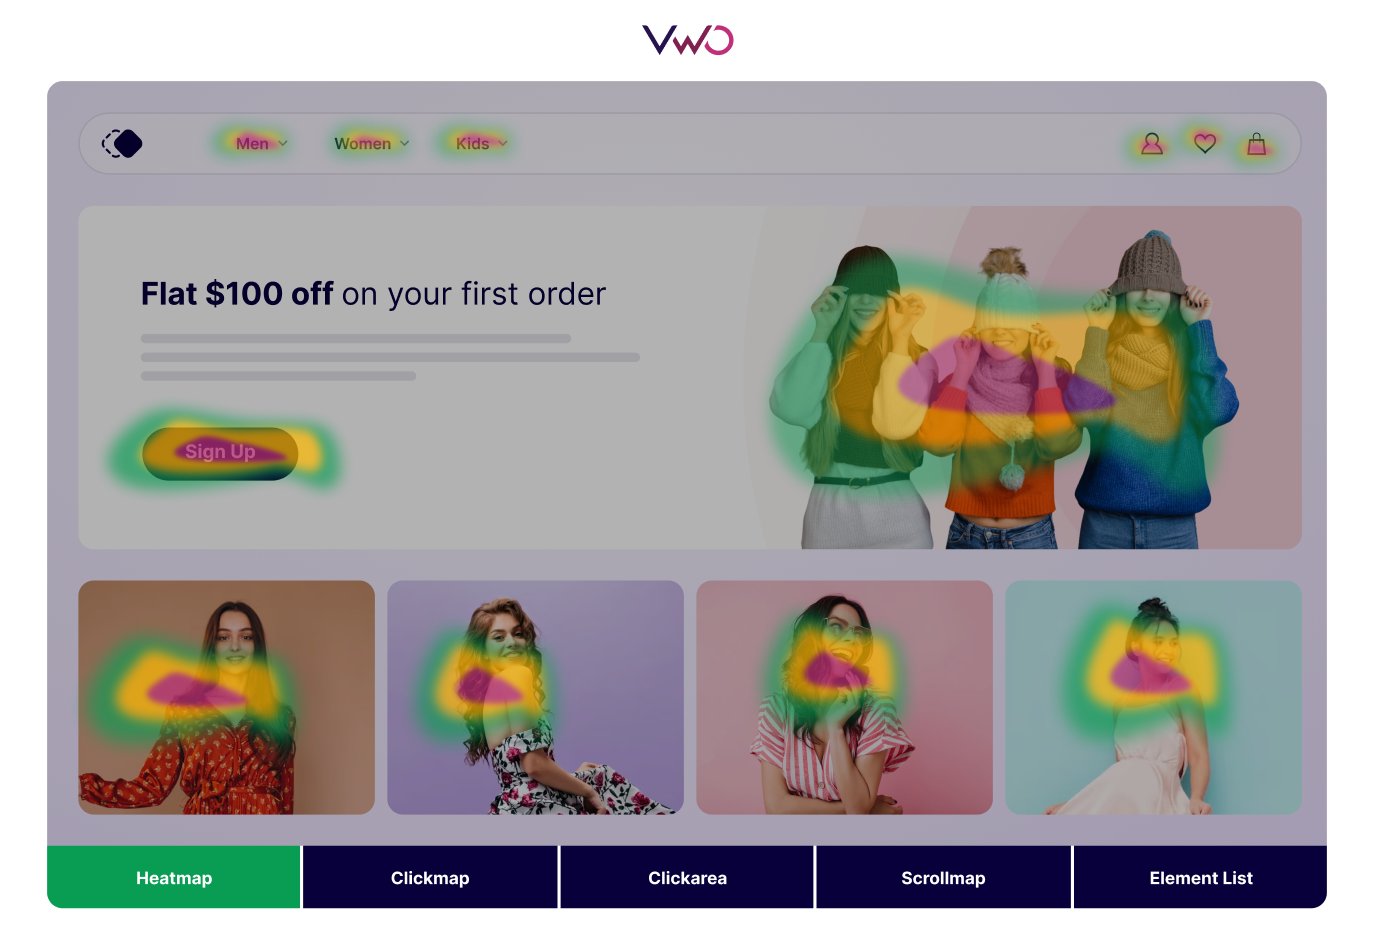
Webpage heatmap
Webpage heatmaps show users’ clicks, scrolling patterns, and mouse movements to help designers optimize website design and usability. For example, scrollmaps and clickmaps reveal user interaction on product pages, highlighting areas of friction to improve user experience.
Create your first heatmap
Since each industry uses different types of heatmap tools and data, the steps in creating heatmaps are bound to differ. Here, we provide a brief overview of the general steps involved in creating a heatmap:
Choose your data
Determine the data set you are going to visualize. It could be geographical data, like population density; numerical data, like sales data; or categorical data, like customer demographics.
Choose a tool or software
Choose an appropriate tool or software that you will use to generate a heatmap to meet your goal. There are many of them, starting with spreadsheet software like Excel or Google Sheets and ending with professional data visualization tools like Tableau, Power BI, or free online heatmap generators.
Prepare your data
Be sure your data is clean and organized, and in a format that can be passed to a heatmap. For geographic data, this most likely means you’re supplying latitude and longitude coordinates or other types of location data. If you have numerical data, ensure your values are prepared to be aggregated or placed into correct categories.
Specify the type of heatmap
Establish what type of heatmap will fit your data and visualization goals. For instance, a density heatmap, choropleth map, or hierarchical heatmap.
Enter your data into the tool or software you have chosen. This might involve importing the dataset from a file or even a database where your data may be stored.
Customize your heatmap
Modify color schemes, the settings of the legend, and other display properties appropriate for clear visualization and communication of insights from your data.
Create heatmap
Generate a heatmap based on your data inputs and customize the way you like it for easy interpretation of data.
Interpret and analyze
After creating the heatmap, interpret the visual patterns and insights presented in it. Analyze high-density areas over low-density backgrounds to make inferences.
Since our platform offers heatmaps for website visitor behavior analysis, we can for ourselves. Watch how seamlessly you can create heatmaps on VWO to understand website visitor behavior:
Heatmaps available in VWO
As discussed, every industry benefits from using heatmaps. However, when it comes to website heatmaps, the process is simplified because you have tools like VWO Heatmaps, which allow you to generate heatmaps easily based on real-time user data.
VWO Insights is a suite of behavioral analytics tools, one of which includes heatmaps. It shows exactly how visitors have responded to the different elements on your website, based on real-time visitor behavior. Colors make it easy to understand—hot colors for high-engagement areas, and cool colors for less-engaging areas.
Take a free trial to explore how it works.
Add an observation on VWO Heatmaps to record unique insights from visitor behavior. It will be saved with the exact state of the heatmap where you saw the behavior. You can also download and share the heatmap with your team for additional brainstorming.
Typically, heatmaps are generated by placing a small piece of the required tracking code of your chosen heatmap tool on your website before letting it collect data for some time.
Moreover, VWO’s AI-powered Free Heatmap Generator provides a predictive visual representation of visitor interaction with your webpage.
Using this free heatmap generator, you can get an instant overview of the clicks on key elements of your page, understand the numeric values for the clicks through a visual approach, and identify bottlenecks of the user experience to get inputs to design an optimized website.
But remember that the heatmap generated is a predictive example. Browsing data from real visitors is not used in this case.
Heatmap generator FAQs
As mentioned earlier, this depends on the type of heatmap software you are using and the industry you operate in. Refer to the section above for general steps.
Heatmaps come as a result of data aggregation, represented by color gradients. This can be done using many available software. These tools transform raw data or points into colored intensities on a grid, mapping density or values across a spatial or categorical dimension.
Tools like Google Maps Heatmap Tool, Datawrapper, or Tableau Public will help you do heatmaps online for free. Upload or just paste your data, change the settings specific to your need with color schemes and overlays, and your heatmap visualization is ready.
Yes, it does. Google has a Heatmap Layer API available with its Google Maps JavaScript API. With this feature, developers are able to create a visualization for spatial data on Google Maps through color gradients. Typically, that will show some measure of density, activity, or geographic trend.
Yes. If location services or GPS is enabled, Google Maps tracks each step that one takes. This location history data can be used to visualize the number of location points and pins visited over some time. Such a heatmap is known as a Google Maps Heatmap. Read more on Google heatmaps in our blog.
Yes, you can definitely do a very basic heatmap in Excel with conditional formatting. Type in your data in a spreadsheet and highlight the input data. Now use Conditional Formatting with Color Scale, and Excel will automatically generate a heatmap after you indicate the values in your dataset to visualize trends or correlations. You can read more about creating a heatmap in Excel in this blog.


