
Follow us and stay on top of everything CRO
Read summarized version with
Behavioral analysis is incomplete without heatmaps.
But, there’s much more to analyzing visitor behavior than just looking at click patterns, mouse movements, and engagement trends.
Relying on just one method like heatmaps can prevent you from seeing the larger picture of why visitors behave the way they do on your website.
Also, it’s essential to use heatmaps in combination with other key analysis methods to get better insights into visitor behavior and make well-informed decisions.
In this blog, we’ll cover each of these heatmap alternatives and understand how you can use them to get a holistic view of visitor behavior.

What is a heatmap?
Heatmaps are used to represent user interactions of your website visitors in a visual format. These interactions include how visitors engage with various elements, where they click, or how much they scroll.
It is an important part of qualitative behavioral analysis, which involves tracking visitor journeys, analyzing their behaviors, and identifying areas where they face challenges or friction.
Marketers, UX researchers, and even web designers use heatmaps to analyze visitor behavior and visualize how visitors interact with a website.
Limitations of heatmapping tools
While heatmaps play an important role in analyzing visitor interactions, they also come with certain limitations that are not spoken about a lot.
Let’s take a closer look at why heatmaps should not be the only method of conducting behavioral analysis on your website.
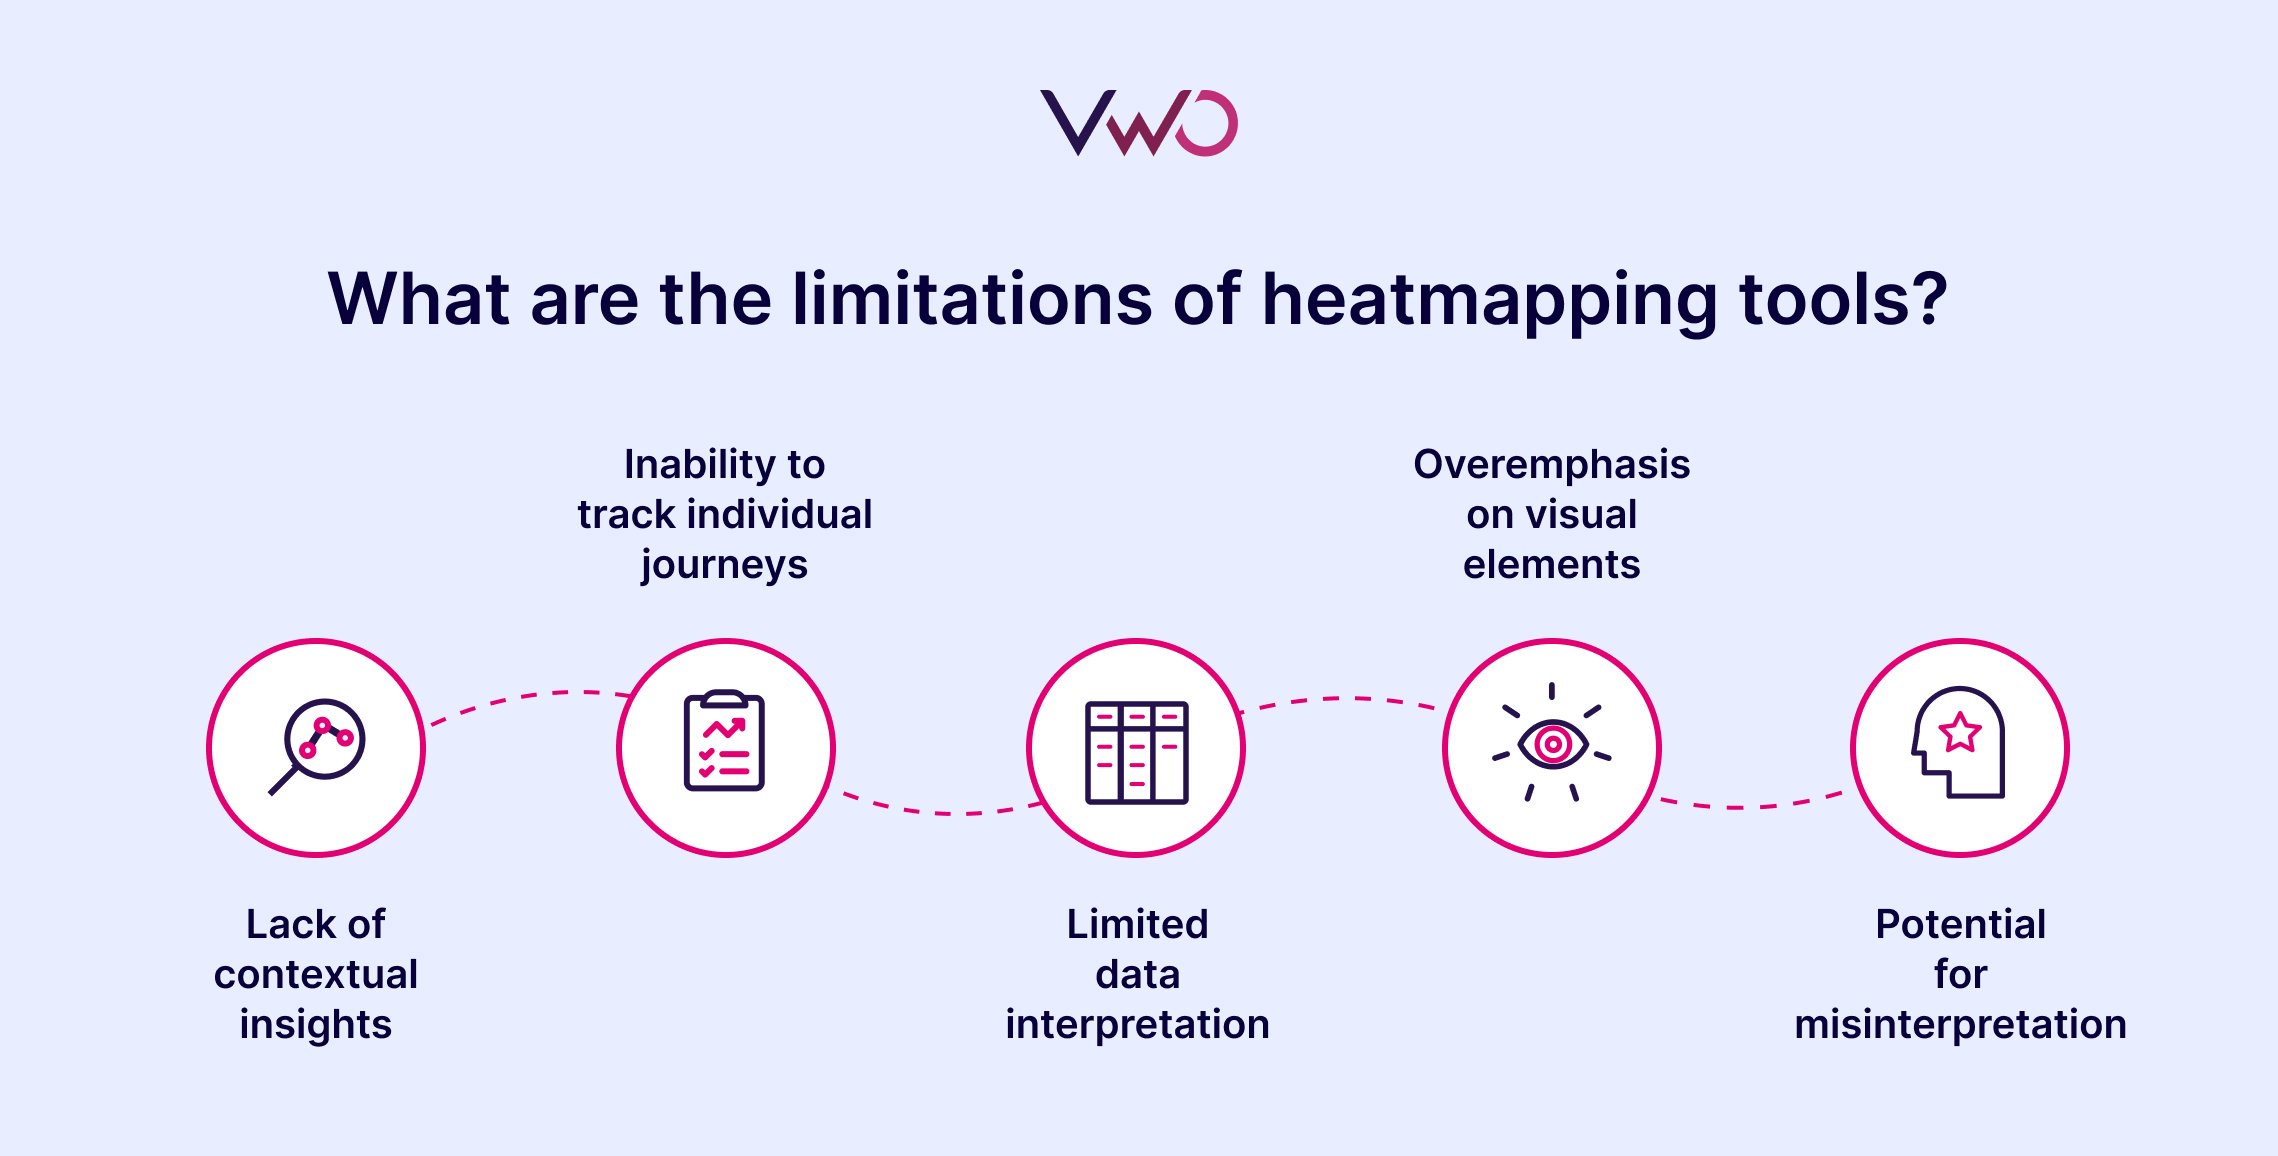
Lack of contextual insights
Heatmaps show where visitors click, scroll, or hover, but they can often fail to reveal the exact reason behind these actions.
For instance, heatmap data shows that a certain section of your page is popular or attracting high user engagement, but it does not explain whether this is due to engaging content, a misleading design element, or even visitor frustration.
Similarly, a lack of clicks in an area doesn’t reveal whether visitors are uninterested or simply didn’t notice it.
It is difficult to make informed decisions about design changes or content adjustments without understanding the underlying motivations and emotions driving these behaviors.
Limited data interpretation
While analyzing heatmaps, you tend to oversimplify complex behaviors by looking at a static view of visitor interactions. However, heatmaps don’t account for crucial factors like visitor intent, repeat visits, or the different paths visitors might take through a website.
For instance, a returning visitor might navigate a page differently than a first-time visitor, but a heatmap does not distinguish between these two experiences unless you use certain filters to focus on the activity of specific audience segments.
This can lead to incorrect conclusions about what’s working and what’s not, particularly when heatmaps are used in isolation without supporting data from other behavior analytics tools like session recordings.
Inability to track individual journeys
While heatmaps are useful in identifying engagement patterns among visitors, it does so by aggregating data from multiple visitors which means they can sometimes mask individual visitor journeys and behaviors.
This can make it difficult to understand how different visitor segments interact with your website. For instance, an existing customer will explore your site differently than a visitor who has arrived at your website for the first time.
This aggregated data can mask these differences, making it difficult to tailor your site to the needs of specific visitor groups.
Without the ability to track individual journeys, you might miss opportunities to optimize your website for key segments, potentially leading to a less personalized visitor experience.
Overemphasis on visual elements
Heatmaps focus primarily on visual elements, potentially ignoring non-visual aspects of visitor experience, such as load times, backend performance, or even the effectiveness of copy.
This can lead to a partial understanding of what influences visitor behavior. For instance, a slow-loading page might discourage visitors from interacting with certain elements, but a heatmap won’t capture this underlying issue.
Similarly, heatmaps don’t consider other key factors like whether the copy is clear, persuasive, or aligned with the visitor’s needs. Focusing solely on where visitors click or scroll can lead to changes or optimization efforts that don’t address the real issues affecting website performance.
Potential for misinterpretation
For those who are not very familiar with heatmaps, the color-coded representation can be easy to misinterpret.
For instance, a ‘hot’ area might not necessarily indicate high user engagement but could signify confusion or an obstacle in the visitor’s journey. Similarly, an area with few clicks might not necessarily be unimportant, visitors may simply not need to interact with it if the rest of the page is well-designed.
Without additional data to clarify the context, it’s easy to misinterpret these visual cues and can lead to poor decisions such as removing elements that are essential to the customer journey.
Heatmap alternatives for better analytics
While heatmaps are great for visualizing where users interact on your site, they provide only part of the picture when it comes to understanding their behavior.
Combining heatmaps with other tools and methods can offer a more comprehensive view of a visitor’s digital journey.
Here are some of the best alternatives that, when used alongside heatmaps, can provide deeper insights and actionable data for improving the overall website experience.
1. Session recordings
Session recordings capture live user interactions on your website, providing a detailed view of how individual users navigate, scroll, and click through pages. Heatmaps can show you which areas get the most attention, but with session recordings, you can see exactly how users interact with those sections.
For example, while analyzing a heatmap, you observe that a lot of visitors are clicking on a non-clickable image. However, you can go a step further with session recordings and observe what action visitors take after that.

Do they exit the site completely or do they just move on to another element on the page?
By watching user sessions, you can spot similar bottlenecks, hesitations, or points of confusion in a visitor’s journey. By pairing it with heatmap analysis, you can identify areas that are engagement hot spots on your pages and also understand what actions visitors are taking at those spots.
2. On-page surveys
The best way to understand the problems of your visitors is to ask them about it.
On-page surveys are a great method to collect feedback directly from your visitors and understand their motivations, frustrations, and overall experience on your website.
While heatmaps tell you where users are clicking or spending time, surveys can answer why they did or didn’t engage with specific elements.
For instance, heatmaps might reveal that a certain area of your page is being ignored. But, you can trigger a simple survey at that very moment to understand more about the problem and get a better picture of user expectations.
You can combine heatmap data and analyze survey responses to gain actionable insights into the actions of your visitors and guide changes that improve their overall experience.
Set up a survey specifically for visitors who show exit intent and try to leave a page. This will help you understand why they are leaving the page, identify patterns or issues that are creating friction on your website, and ask for feedback on how the experience can be improved.
3. Analysis of conversion funnels
Funnels are a series of steps that visitors take on your website to achieve a specific goal. Also known as conversion funnels, they help you track user interactions and visualize where visitors drop off or face roadblocks.
By analyzing conversion funnels, you can get a clear picture of every action that visitors take on your website and understand what led to them dropping off or abandoning their journey.

Based on these valuable insights, you can pinpoint key friction areas and observe the heatmaps of these sections to identify patterns or common trends in visitor engagement.
This approach will help you understand whether low engagement at a particular step correlates with high drop-off rates, enabling you to focus your optimization efforts where they matter most.
4. Goals and events analysis
An event is any action that a visitor takes on your website. A series of actions or events leads to visitors completing a certain goal such as signing up for a newsletter or purchasing a product.
By tracking these events and goals, you get deeper insights into visitor behavior which helps you to understand their intent, mindset, expectations, and challenges.
When used with heatmaps, these behavioral analysis strategies can offer nuanced data on how often users complete key actions and what prevents them from achieving a goal.
Let’s say a heatmap shows users are frequently interacting with a product image, but event tracking indicates few are clicking the “Add to Cart” button. This data suggests that while users are engaging with the image, they are not taking the intended action, prompting you to further analyze the layout or copy.
By combining these behavioral analysis strategies, you can ensure that the areas getting the most interaction are also driving meaningful engagement.
5. Form analysis
Adding forms to your website is one of the best ways to generate leads and convert visitors into prospects. However, brands often fail to optimize these crucial lead generation buckets, which results in the loss of prospects and potential customers.
Analyzing how visitors interact with these forms should therefore be a key part of any UX strategy as it not only impacts your website experience but also provides actionable insights into the minds of your visitors.
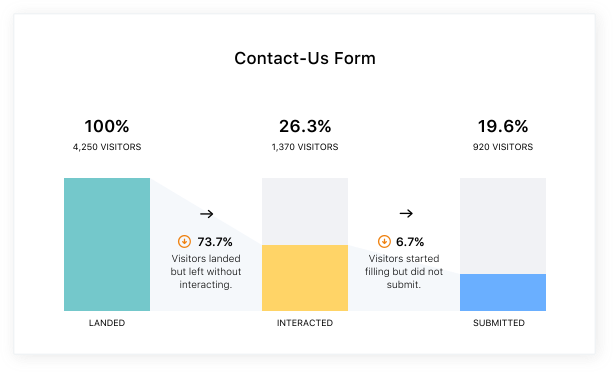
While heatmaps can show you the engagement patterns of a specific form, conducting a detailed analysis of the form will reveal valuable insights like where they are getting stuck or the time they spend on each form field.
This way you can identify the exact issues that prevent visitors from completing a form and fix them before they cause a major dent in your lead-gen pipeline.
How to conduct effective UX research with VWO?
Being one of the leading optimization platforms, VWO offers a combination of key features and capabilities that top brands across the globe leverage to analyze visitor behavior and build an optimized website experience.
For instance, Paltalk is a USA-based video chat service that wanted to reduce cognitive lead on its visitors, increase purchases, and improve the average revenue per user (ARPU).
The company used VWO Insights – Web to observe session recordings and analyze the heatmaps of their subscription page. The analysis revealed that visitors struggled to view the different elements on this page.
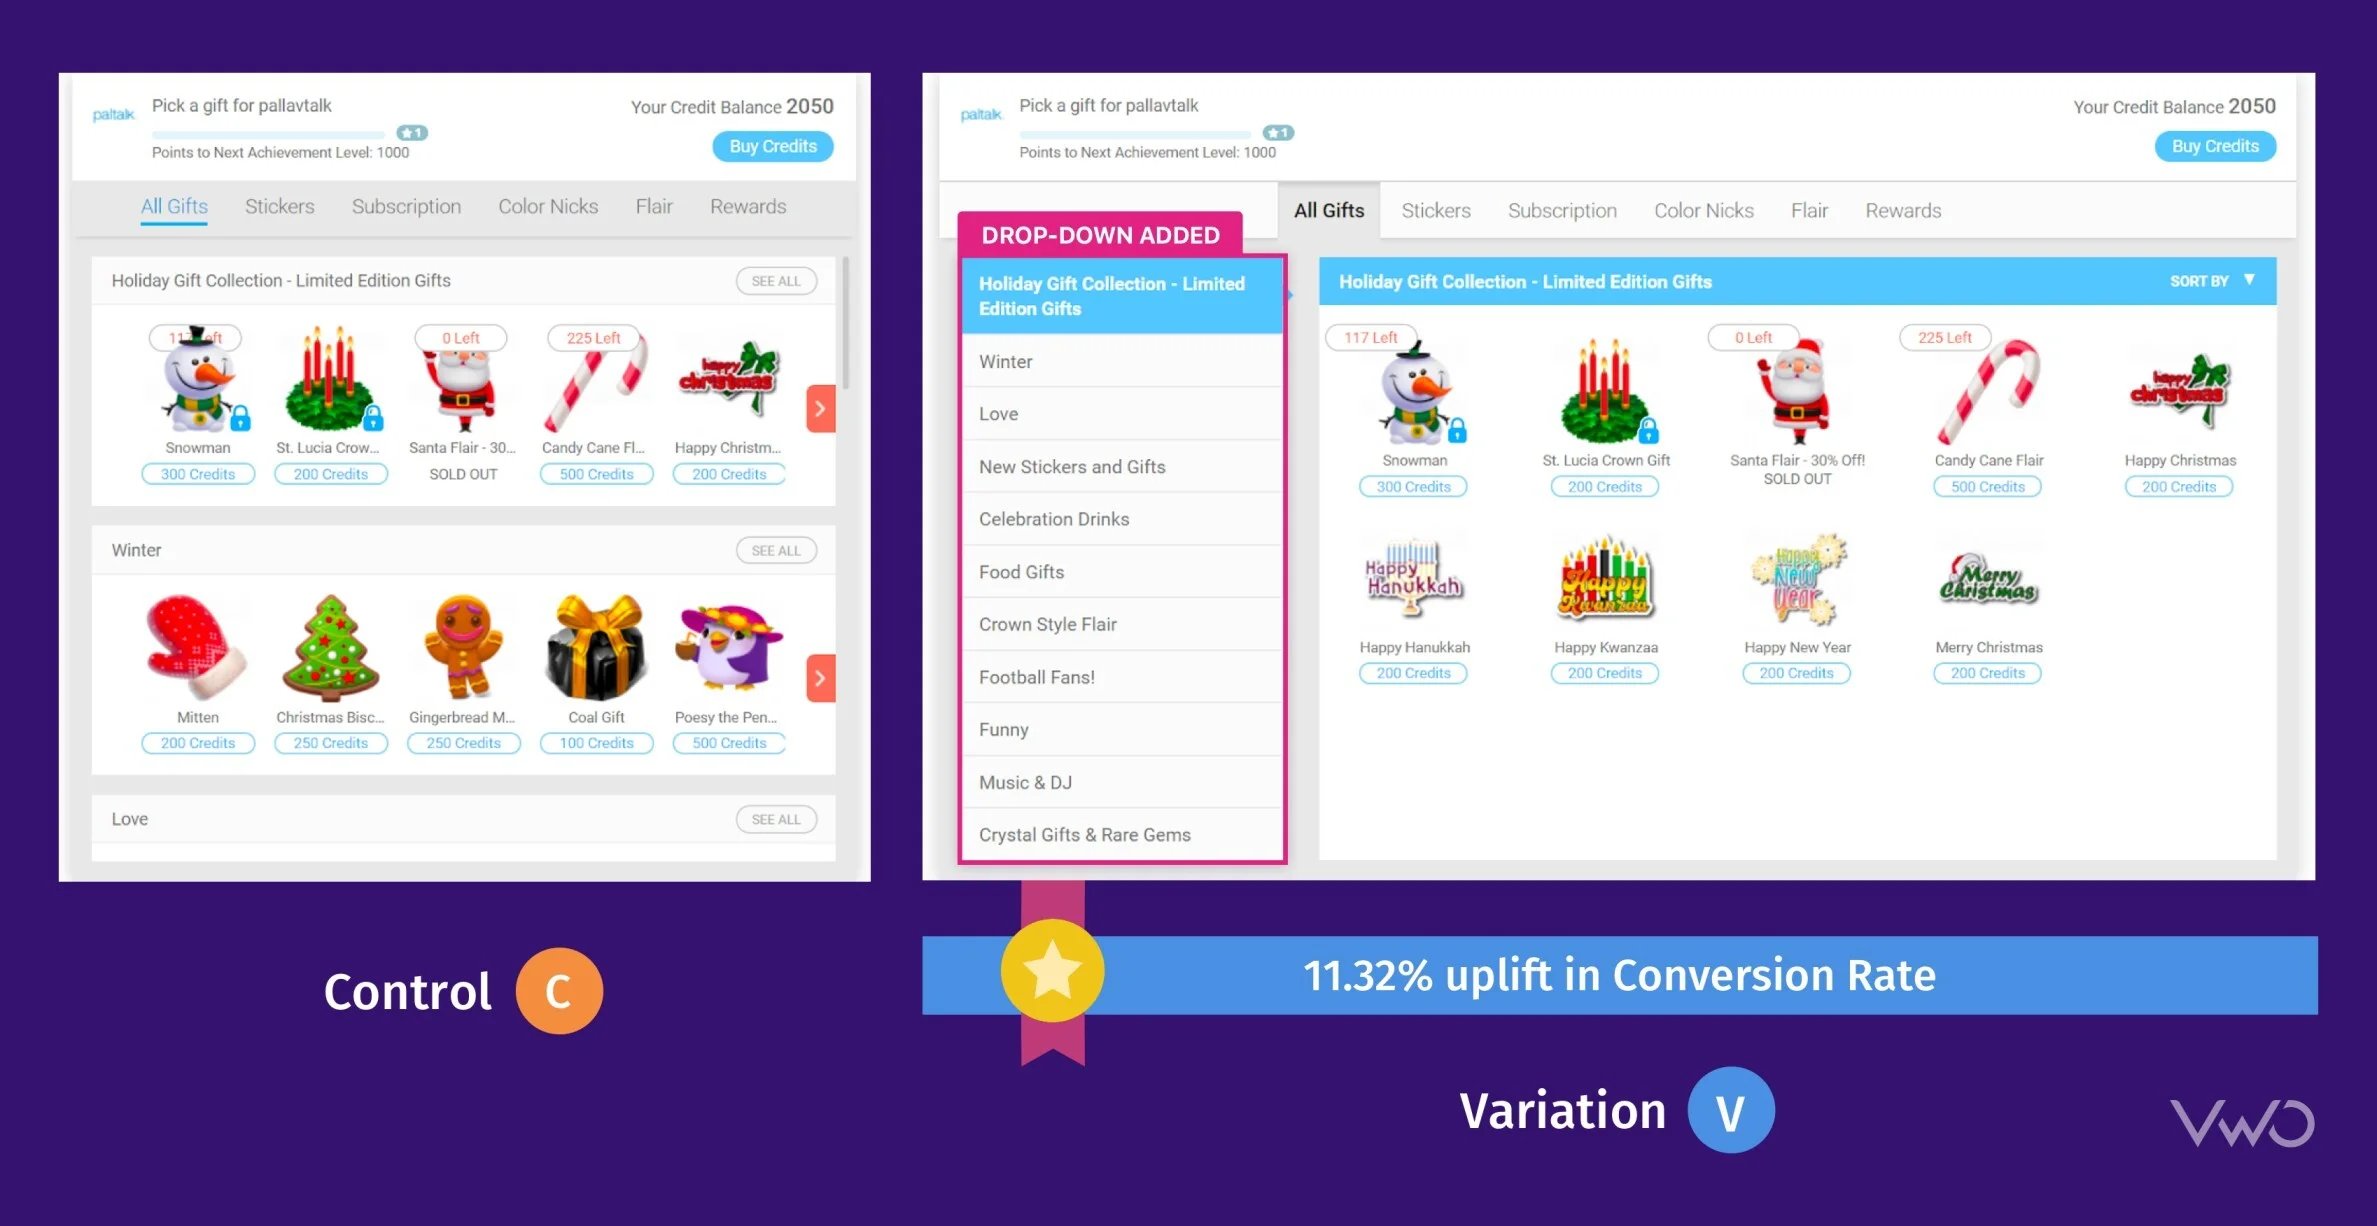
Based on these crucial insights, Paltalk optimized its subscription page and registered a jump of 11.32% in conversion rate.
These changes also saw Paltalk’s ARPU rise by a massive 57.32%, which led to an increase of $21,000 (USD) in revenue.
Similarly, you can also use the wide range of behavioral analysis features offered by VWO to improve visitor experience and drive data-backed optimization.
1. Website heatmaps
Use VWO Heatmaps to visualize visitor journeys and track how they interact with your website. Based on these actionable insights, you can make data-backed improvements that enable your visitors to convert.
VWO offers a wide range of heatmaps like dynamic heatmaps, clickmaps, and scrollmaps so you can see where visitors click, analyze their scrolling patterns, and identify areas that cause friction.
2. Session recordings
Another great way to get relevant context for visitor behavior is to watch session recordings. By doing so, you can see why your users struggle and understand how they experience your website.
With VWO’s Session Recordings, you can see why visitors drop off, spot hidden UX issues, understand how visitors engage, and gather key insights for your experimentation program.
You can use the filters to watch specific session recordings based on location, device type, rage clicks, dead clicks, recording duration, and so on.
3. On-page surveys
Avoid the guesswork and directly ask visitors about their experience, hesitation, frustration, feedback, and much more with VWO’s On-Page Surveys.
Set up surveys for key visitor actions like time spent on a page, scroll depth, or exit intent. You can choose from VWO’s 6 key triggers to deploy a survey when a visitor performs any of the above actions.
Moreover, with VWO’s new AI assistant, you can now generate engaging questions based on your survey goals.
Also, the AI assistant generates actionable summaries from survey reports, so you get crucial insights from multiple survey responses with just one click.
4. Form analytics
Identify key friction points in your forms with VWO’s Form Analytics. Dive into the field-level insights to discover the areas on your form that are causing hesitation on frustration among visitors.
Analyze key metrics like interaction time, hesitation time, ignored fields, and so on to pinpoint the exact reason why visitors are struggling to complete your form.
Based on these valuable insights, you can fix these issues and optimize the entire process so visitors have a seamless experience on your website.
Final thoughts
While heatmap analysis is a key part of behavioral research and UX optimization, you must combine it with other methods like session recordings and on-page surveys to get a 360-degree view of visitor behavior.

These methods complement each other and give you the much-needed context behind every action that visitors take on your website.
Do you want to try your hand at these methods?
Take a free trial of VWO Insights – Web to go beyond the basic analytics numbers and understand why exactly visitors struggle on your website.
Frequently Asked Questions (FAQs)
The best alternatives to heatmaps include session recordings, form analytics, on-page surveys, and funnel analysis. These heatmap alternatives provide detailed insights into a visitor’s journey and give you a complete picture of how visitors experience your website.
VWO is the best heatmapping tool in the industry. It provides a variety of heatmaps like clickmaps, scrollmaps, and clickmaps, while also offering advanced filter options so you can slice and dice heatmap reports to get deeper insights into user behavior. Some of the other popular heatmap tools include Hotjar, Crazy Egg, and Lucky Orange.
Heatmaps can be limited in their scope as they only show where users interact, without explaining why. They also aggregate data, masking individual user journeys, and may lead to misinterpretations if analyzed in isolation. Additionally, they focus primarily on visual elements and ignore backend issues or user intent.
A heatmap visualizes user interaction through color gradients, primarily to analyze and understand user behavior on websites. A treemap, on the other hand, represents hierarchical data as nested rectangles, often used in data visualization for financial analysis or file system usage.
A heatmap is used to show user interaction or engagement on websites through color-coded areas. A correlogram visualizes the correlation between variables in a dataset, also using color gradients to indicate the strength and direction of correlations.
Interpolation is a mathematical technique used to estimate unknown data points between known ones, often used in fields like data science and statistics. A heatmap is a visual representation of data, typically used to display how users interact on websites.
A heatmap simply visualizes data points with color gradients. A cluster map adds hierarchical clustering to the heatmap, grouping similar data points together for better data visualization, often used in genetic or data science analysis.
No, a heatmap is not a multivariate analysis. It typically visualizes one variable (visitor interaction) across a web page. Multivariate analysis involves examining multiple variables to understand relationships between them.


