
What is a confidence interval?
When you make any estimate in statistics, whether it is a summary statistic or a test statistic, there is always uncertainty around that estimate because the number is based on a limited sample of the population you wish to study.
Suppose a research study is performed to determine the average time a medicine takes to perform a recovery effect on a certain disease in a human body. After observing some diseased patients till the time they are recovered, the duration of recoveries will be recorded and the average is estimated. As this estimate is made from limited sample data there will be some uncertainty associated with it. A confidence interval is the degree of uncertainty in a particular metric of interest, typically an average. It tells you how confident you can be that the results from an experiment reflect what you would expect to find if it were possible to obtain data of the entire population.
In statistical terms, what is a confidence interval?
A confidence interval is the estimated value of a metric plus and minus the variation in that estimate. This is the range of values you may expect your estimate to fall within if you redo your test several times. The number of times the estimate will fall into the range depends upon the configured confidence level.
If you construct a confidence interval with a 95% confidence level, you are confident that 95 out of 100 times the estimate will fall between the upper and lower values specified by the confidence interval.
Your desired confidence level is generally related to the Statistical Level(alpha) you use in your hypothesis test. If you set an alpha of 0.05 then your confidence level would be 1 − 0.05 = 0.95 or 95%.
When do you use confidence intervals?
Whenever you make an estimate of any test statistic on sample data, you compute the confidence interval to represent the uncertainty that exists within the limited sample data. This is because sample point estimates alone don’t give any information about the variation around the number due to limited data. Confidence intervals are useful for communicating the possible variation that exists around a point estimate.
Calculating a confidence interval
Confidence interval is the terminology that mostly appears in Frequentist statistics. Most statistical softwares provide the confidence interval of the estimate along with several statistics when you run a statistical test.
To demonstrate how to calculate a confidence interval, let’s imagine that a group of analysts are interested in determining whether or not the apples grown on a particular orchard are large enough to be sold to an online grocery market.
- Find the number of samples (n). The researchers randomly select 46 apples from trees on the farm. Hence, N = 46
- Calculate the mean of the sample data.
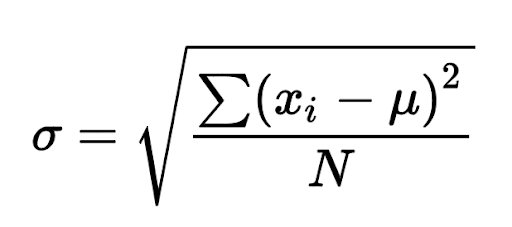
The researchers then found the mean(μ) weight of apples to be 86 grams. - Calculate the standard deviation(σ). It’s advisable to use the standard deviation of the entire population, however, in many scenarios this information is unavailable. If this is the case, the standard deviation can be calculated from the sample using the following formula –
- Decide the confidence level that will be used. Typical market research studies use a confidence level of 95/99 percent. Let’s say the researchers in our example have decided to use a confidence level of 95 percent.
- For the selected confidence level, get the corresponding Z value using the Z table.
| Confidence Level | Z |
| 80% | 1.282 |
| 85% | 1.44 |
| 90% | 1.645 |
| 95% | 1.96 |
| 99% | 2.576 |
| 99.50% | 2.807 |
Z value essentially is the interval that has an area of a standard normal distribution curve equal to the defined confidence level.
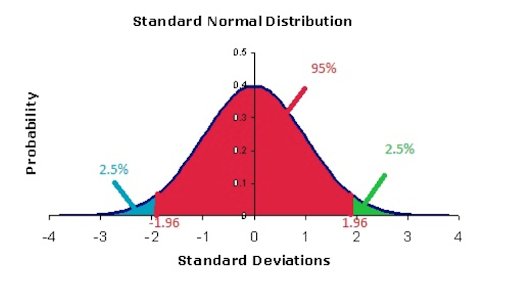
For the selected confidence level of 95 percent, they determine that Z = 1.960.
6. Calculate the confidence interval using the following formula.
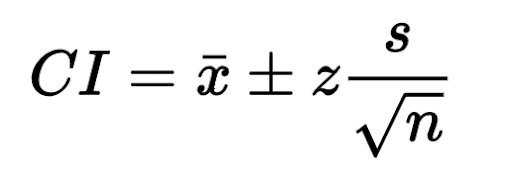
CI = 86 ± 1.960 (6.2/6.782)
When calculated, this formula gives the result of 86 ± 1.79 as the confidence interval.
7. Draw a conclusion
The researchers have now determined that the sample mean(41 apples) is likely (with 95 percent confidence) between 84.21 grams and 87.79 grams. If the weight required for the apples to become eligible to be sold in the online market is less than the lower limit of the estimated confidence interval then they are approved for sale.
Caution when using confidence intervals
Confidence interval isn’t about saying that the ‘true value’ of your estimate lies within the bounds of the confidence interval. The correct interpretation is there is a 95% chance that the confidence interval you calculated contains the range of estimates you are expected to get if you redo the experiment several times. With increasing data, the chance that your confidence interval includes the true value of your estimate increases.
At VWO, we use Bayesian methodology where we use credible intervals to estimate the uncertainty around the estimate. The Bayesian concept of a credible interval is a more practical and interpretable concept than the confidence interval. For a 95% credible interval, the ‘true value’ of the metric you intend to estimate lies with a 95% probability in the interval.
To understand our reporting in detail, you can take a free trial or request a demo with our product experts.


