PriceCharting A/B Tested A More Relevant CTA To Increase Conversions
VWO and PriceCharting
PriceCharting.com provides current and historic prices of new and rare video games and consoles such as Atari 2600 and Super Nintendo. Its users pay a small fee to get a good idea of the fair price for a video game.
As part of his ongoing efforts to optimize the website, JJ Hendricks, the founder of PriceCharting, selected the VWO platform for conducting A/B tests.
Goals
With the objective of increasing clickthroughs on ‘download price guide’, Hendricks kickstarted this test campaign.
Tests run
On its product pages, Pricecharting had a call-to-action (CTA) button that said ‘Download’. Right next to it was the fee the user needed to pay to download the price list.
For example, on the product page for ‘Sega Genesis’ console shown below, a user would see the text ‘Sega Genesis Price List for $2’.
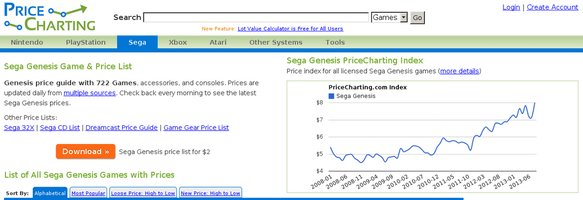
JJ Hendricks believed that the existing CTA caused confusion among visitors, who did not know what they needed to download. As he put it, “The ‘Download’ button and the price made buttons for our price guide service look too much like banner ads. We felt users probably had ad blindness and didn’t click it.”
Hendricks decided to test his hypothesis. Using VWO, he set up a small A/B test. He created a variation in which he changed the text on the CTA button from ‘Download’ to ‘Price Guide’ and removed the price. This is how the variation looked.
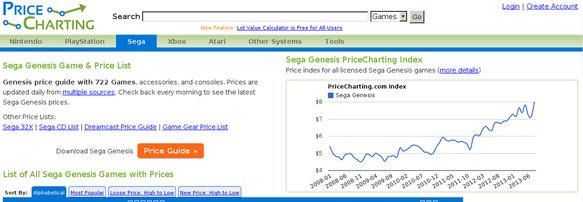
The goal tracked was “CTA clickthroughs”.
Conclusion
Just a week into the test, the variation emerged as the clear winner with 99.9% statistical significance. Changing the CTA text from ‘Download’ to ‘Price Guide’ increased clickthroughs by a jaw-dropping 620.9%!
Needless to say, JJ Hendricks implemented the changes.
So why did these relatively small changes cause such a huge impact? The simple reason is that the new text was more relevant and specific- and hence, made more sense to users.
1) Greater relevance
In the variation, clicking on the ‘Price Guide’ button took users to a page where they could customize your own video game price guide. According to Hendricks, “When people view this (product) page, they are looking for the price guide for a particular type of video game.”
So for visitors to the website who were in fact looking for a Price Guide, ‘Download’ was not a very compelling CTA, but ‘Price Guide’ was much more relevant.
2) More specific
For video game enthusiasts (who constituted the main visitors to the website), the word ‘Download’ possibly came across as rather vague. Visitors were not sure what they could download by clicking on the CTA button. On the other hand, the term ‘Price Guide’ focused attention on the goal of the page. It provided them with a clearly-defined direction and helped speed up decision-making for potential customers.
You may want to read this article to know more about high-converting CTAs.
3) We read from left to right
Our eyes track text from left to right.
The text in the original version read “Download Sega Genesis Price List for $2”, while the text on the variation read “Download Sega Genesis Price Guide”.
The second message begins by informing visitors what is on offer and ends by telling them to click on the button.
The second test
Having experienced the power of A/B testing and its role in optimizing website elements, Hendricks decided to conduct a second A/B test to see how price sensitive his customers were.
This was a preliminary attempt to test customer behaviour before he ran a series of tests on the actual prices. So he cloned the CTA test and tracked the same goal (clickthroughs).
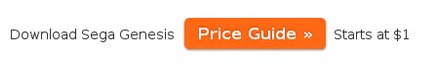
On the previous variation, he added ‘Starts at $4’ next to the ‘Price Guide’ CTA. This is how it looked
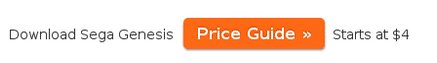
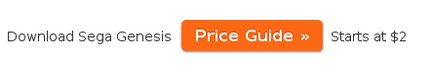
He set this as the Control and tested two variations against it- one with a starting price of $2 and the other with a starting price of $1.
*This was an internal test and the new prices were not reflected on the checkout page.
The results of the second test
Although there was no clear winner, with a 91% statistical significance, the $4 version did much better than the $2 and $1 variations. However, the conversion rate of the $4 version was still less than the conversion rate of the winner in the previous test (0.70% compared to 1.03%).
Based on the results, Hendricks did not add the ‘Starts at $4’ text on his product pages, but he did get valuable pricing insights for future use. The fact that $4 value did better than the $2 and $1 versions meant visitors were willing to pay a higher price- or were indifferent to the $3 range. As he said, “We will probably try some higher priced products on the landing page in the future to see if it will increase revenue.”
Apart from the insights provided by the actual test results, Hendricks’ experience underscores two important takeaways around A/B tests.
1) Always look for the next improvement possibility
Even if you have just got brilliant results in a test, do not stop looking for new ways to optimize your website.
2) Run a dummy test before testing high-impact elements
Making changes to elements like price can be scary because it can impact revenue. Not testing such key elements is not the solution; the key is to run a dummy test (or an “internal test” as Hendricks called it). But do this only if you can carry it off, because a huge difference in prices on the product and checkout pages might confuse users.
You may want to read this blog post to learn more about A/B testing prices.

Location
USA
Industry
Others
Impact
620.9% increase in Conversion