
Follow us and stay on top of everything CRO
Read summarized version with
Anyone involved in shaping digital experiences should have some knowledge of visitor research.
Whether you’re writing copy, designing a page, or working on anything that influences online behavior, understanding how visitors interact with it is crucial.
Why use heatmaps, you might ask? The answer is simple. They are beginner-friendly, making data interpretation easy with colors. Professionals use them all the time to get a quick look at website visitors’ behavior.
In this blog, I’ll break down what heatmap analytics are, their benefits, and how to use them effectively and offer additional tips to leverage them the right way.
How do heatmap analytics work?
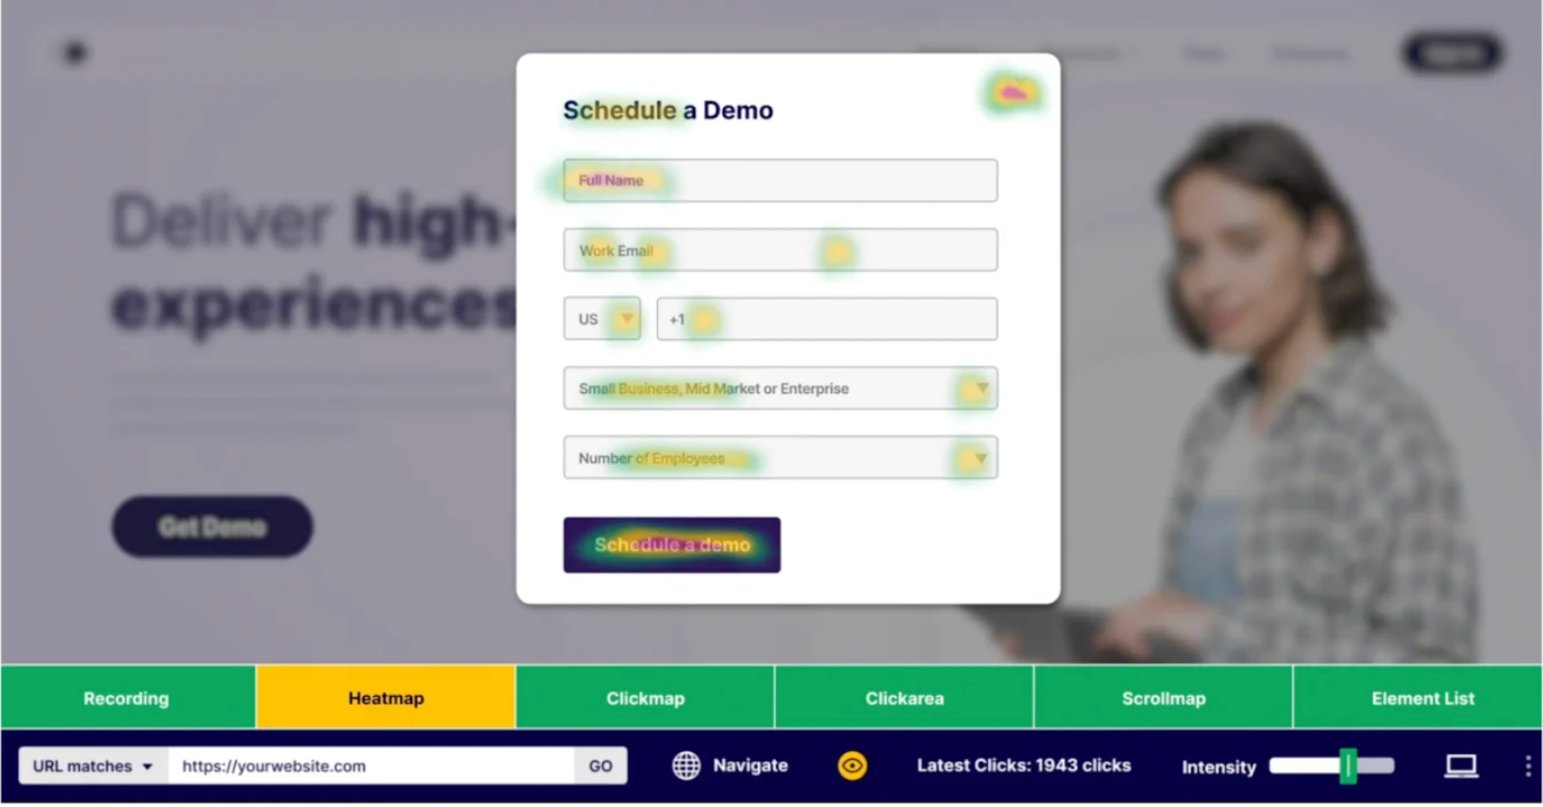
Heatmap analytics make data interpretation effortless by visually representing visitor interactions with website elements through colors. Heatmaps track and record visitor behavior on a web page, including clicks and scrolls. Warmer colors like red and orange, indicate higher levels of interaction, while cooler colors, like blue and green, show lower engagement levels.
Here are some different types of heatmaps:
Click heatmaps
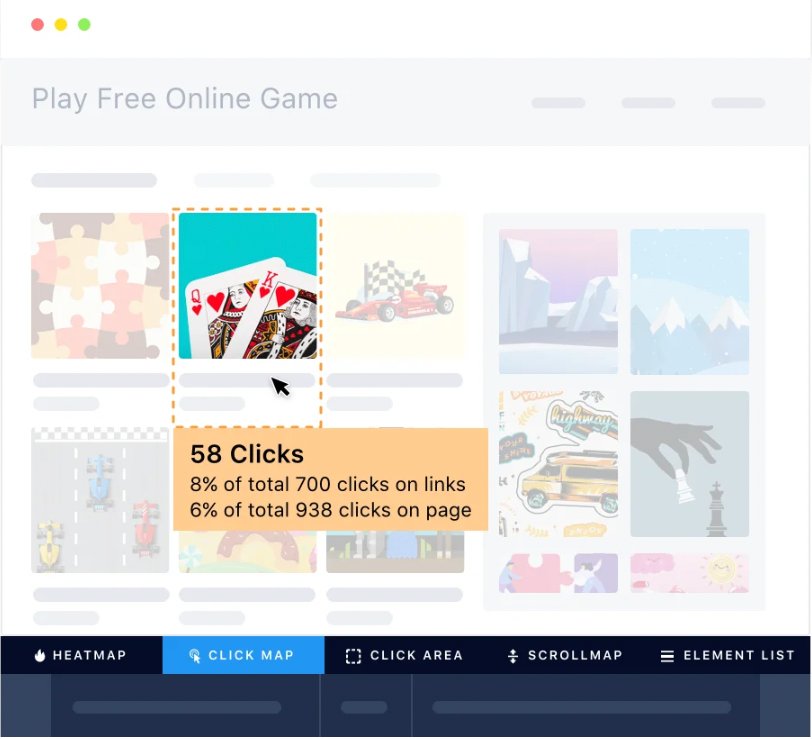
Clickmaps show where visitors click on a webpage. They help identify areas of high and low engagement, allowing you to see which elements attract the most attention and which may need improvement.
Scroll heatmaps
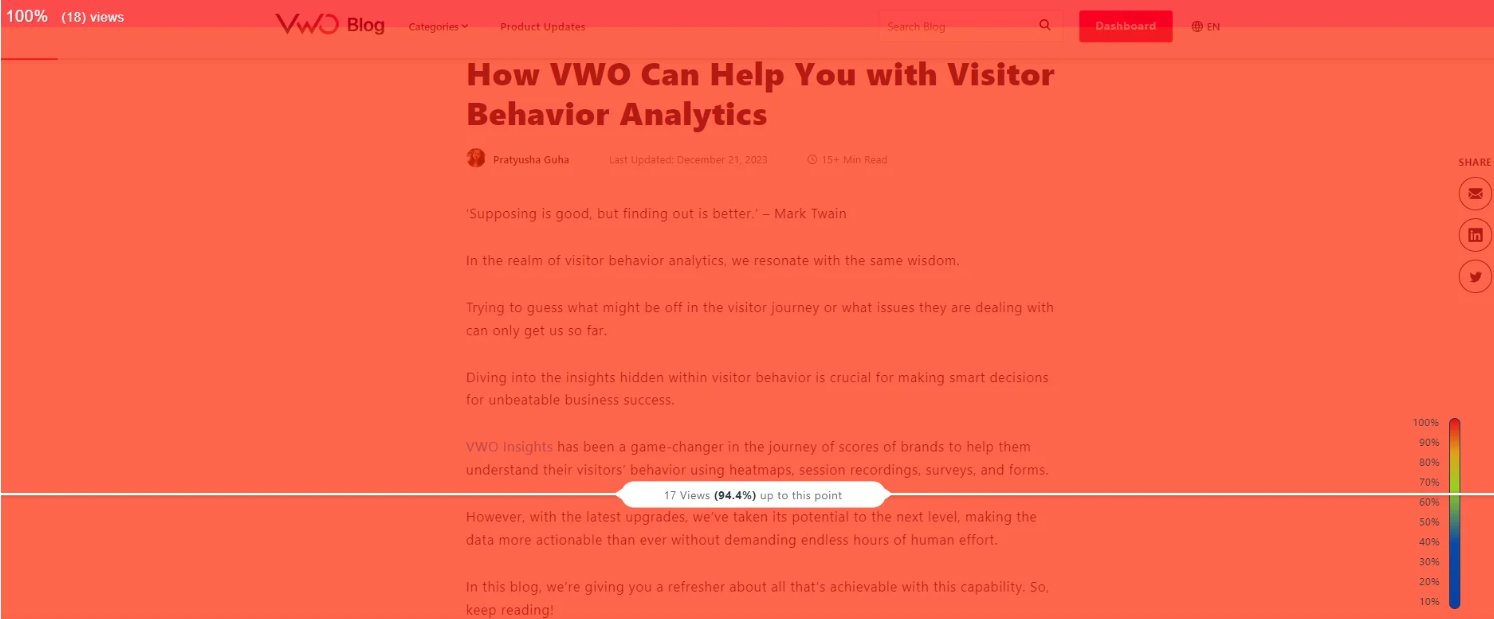
Scrollmaps display how far down a page website visitors scroll. They help identify where visitors lose interest or drop off, providing insights into which parts of the webpage or your content may need to be more engaging.
Browsable heatmaps
This is a more advanced feature that not every heatmap software offers. Dynamic or browsable heatmaps allow you to gain deeper insights by understanding visitor interactions with pages behind logins or situational pages. For example, you can analyze visitor behavior on account pages that require login or on pages that appear after specific visitor actions, like completing a form or subscribing to a service. They offer a more holistic view of interactions by diving into restricted content, beyond the scope of static landing pages.
Compare clicks on different areas of your website using the Click Area feature in VWO Heatmaps. You can also view a list of all elements on the website that have been clicked using the Element List feature.
Importance of heatmap analytics
Whether you use a free heatmap analytics tool or a page analytics extension—the method of obtaining these insights may vary—the growing importance of heatmaps in understanding visitor behavior is clear. Here are the benefits:
Enhance user experience
By visually depicting where your visitors are interacting on a webpage, heatmap analytics point to the friction areas that need immediate attention. For example, if a heatmap reveals that visitors are consistently hovering over and clicking on images that are not interactive, you might redesign those images as clickable elements or move important content to a more visible area. This adjustment ensures visitors have a more intuitive and engaging experience on your site.
Improve crucial metrics
Heatmap insights can help improve your crucial business metrics. Suppose the data collected from heatmaps identifies something wrong in your checkout process (visitors are dropping off or buttons are not at the correct place), you can correct those. A more seamless checkout experience may improve conversion rates and increase sales. These are the places where improvements will directly correlate with enhanced metrics, such as conversion rate and average order value.
A success story: Paltalk, a B2C video chat service, leveraged VWO Heatmaps to optimize their website. The heatmap analysis revealed that visitors had difficulty viewing and navigating Virtual Gifts (VGifts) due to ineffective layout and design. Based on these insights, they redesigned the interface to be cleaner and more intuitive. This led to an 11.32% increase in conversion rates and a 57.32% boost in Average Revenue Per User (ARPU), resulting in a revenue uplift of approximately USD 21,000.
Wish similar results for your business? See how VWO can help. Take a free trial today!
Enhance mobile UX
Since more than 60% of web traffic comes from mobile devices, it becomes very important to optimize mobile user experience. Mobile heatmaps demonstrate precisely how visitors on your website are engaging with it on their smartphones or tablets—to single out frustration areas or hotspots of engagement. With this information, you can make data-driven decisions to resize buttons, refine navigation, or even improve load times on the mobile interface—all to ensure that your website will be just as usable on mobile devices as on a desktop.
See how visitors interact with your website on any device—desktop, mobile, or tablet—using cross-platform tracking in VWO Heatmaps. You can also add notes, and download, and share heatmaps with your team.
Data-driven improvements
By studying visitor interaction with various elements on your site, you can make informed decisions about design changes and content adjustments. This data-driven approach ensures that your improvements are based on real visitors’ pain points and preferences, rather than your own perspectives, thus minimizing personal biases. This allows you to proactively refine the user experience while keeping your site aligned with continuously evolving visitor expectations.
Limitations of heatmap analytics
There’s no denying the benefits of heatmaps, but they do have some inherent drawbacks.
Inconsistent data across devices
Most heatmaps use fixed dimensions to denote visitor interactions. This is invariably going to lead to false data, as different visitors are sure to use different screen sizes and resolutions. For example, the heatmap data of where they click might prove irrelevant if they use differently sized devices since the “click position” on one type of screen will not align perfectly with that of another. This can be misleading and may lead you to believe that visitors are engaging with your site when they’re really not.
Ambiguous data visualization
Heatmaps condense visitor interactions into colored areas, making it difficult to define what exact element visitors were interacting with. Very frequently, these “splotches” of colors obscure single elements, for example, buttons or links. You might see a large red zone of high engagement but won’t know which particular element in the area is really attracting the most attention. It visualizes click data, giving an aesthetic feeling, while providing little actionable insight on their own without further interpretation.
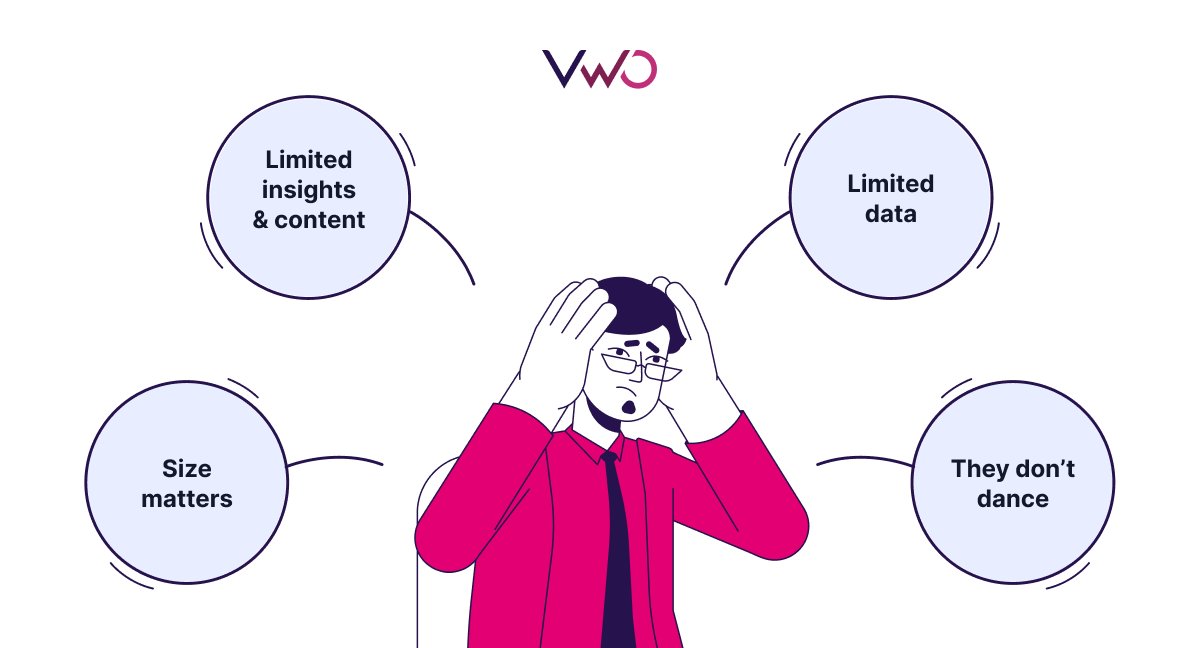
Unclear user intent
Heatmaps may indicate colors to denote interaction data or the number of clicks on a webpage element, but they never give information about what the visitor intended while clicking. For instance, if the visitors click a link many times due to frustration or confusion, then the resultant heat map will only indicate where they have clicked the most but will not tell that too many visitors are frustrated in finding information. This can lend itself to misinterpretation. For example, the fact that they are clicking a lot on some element could be taken as a good sign in terms of interest or success when it may well mean frustration or confusion on the part of the visitor.
Not suitable for detailed analysis
Heatmaps provide a high-level view of visitor interactions but may not offer the granularity needed for detailed analysis. Suppose you need to understand the specific sequence of visitor actions or detailed behavior while engaging with a web form. In that case, heatmaps alone may not provide enough detail. As your research requirements scale with CRO maturity, simply relying on heatmap tracking will not be sufficient.
Leveraging heatmap analytics the right way
You have a camera and want to take great pictures. But if you don’t know the techniques or use the features correctly, how will you achieve your goal? Similarly, with heatmaps, you need to know how to use them the right way to get the desired results.
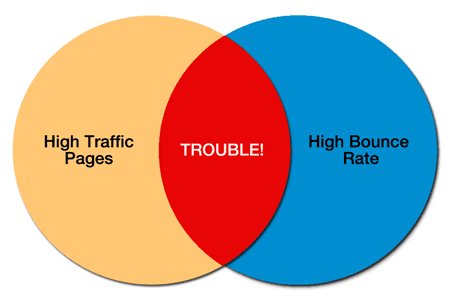
Focus on key pages first
Randomly checking heatmaps of any pages might not be the most effective approach. Instead, start by checking the quantitative analytics to see which pages get the most traffic, and then check the heatmaps for those pages first—whether it’s a product page, checkout page, or new landing page.
By analyzing heatmaps for these high-traffic pages, you can identify and address potential issues that affect a large number of visitors, ensuring that the user experience is optimized where it matters most. This targeted approach helps maximize the impact of your improvements.
In addition to overall observations, scrutinize if there is something specific you are looking for. Are you examining visitor engagement with a CTA? Or how far they are scrolling down? Focus on their interactions with certain key elements, along with overall observations.
Combine all types of heatmaps
When gathering insights, it’s crucial to analyze all types of heatmaps to gain a comprehensive understanding of visitor behavior. Clickmaps let you see the number of clicks each area of your website receives, providing a clear view of interaction patterns. Scroll heatmaps provide insight into how far down visitors scroll on your pages, allowing you to place important content and CTA in more visible areas.
Additionally, for more dynamic elements of content like modal dialogs or expanding menus, specialized heatmap analytics tools are necessary to accurately capture interactions with these changing elements. By examining these various heatmaps, you ensure a thorough analysis of both static and dynamic website content, leading to more informed and effective website improvements.
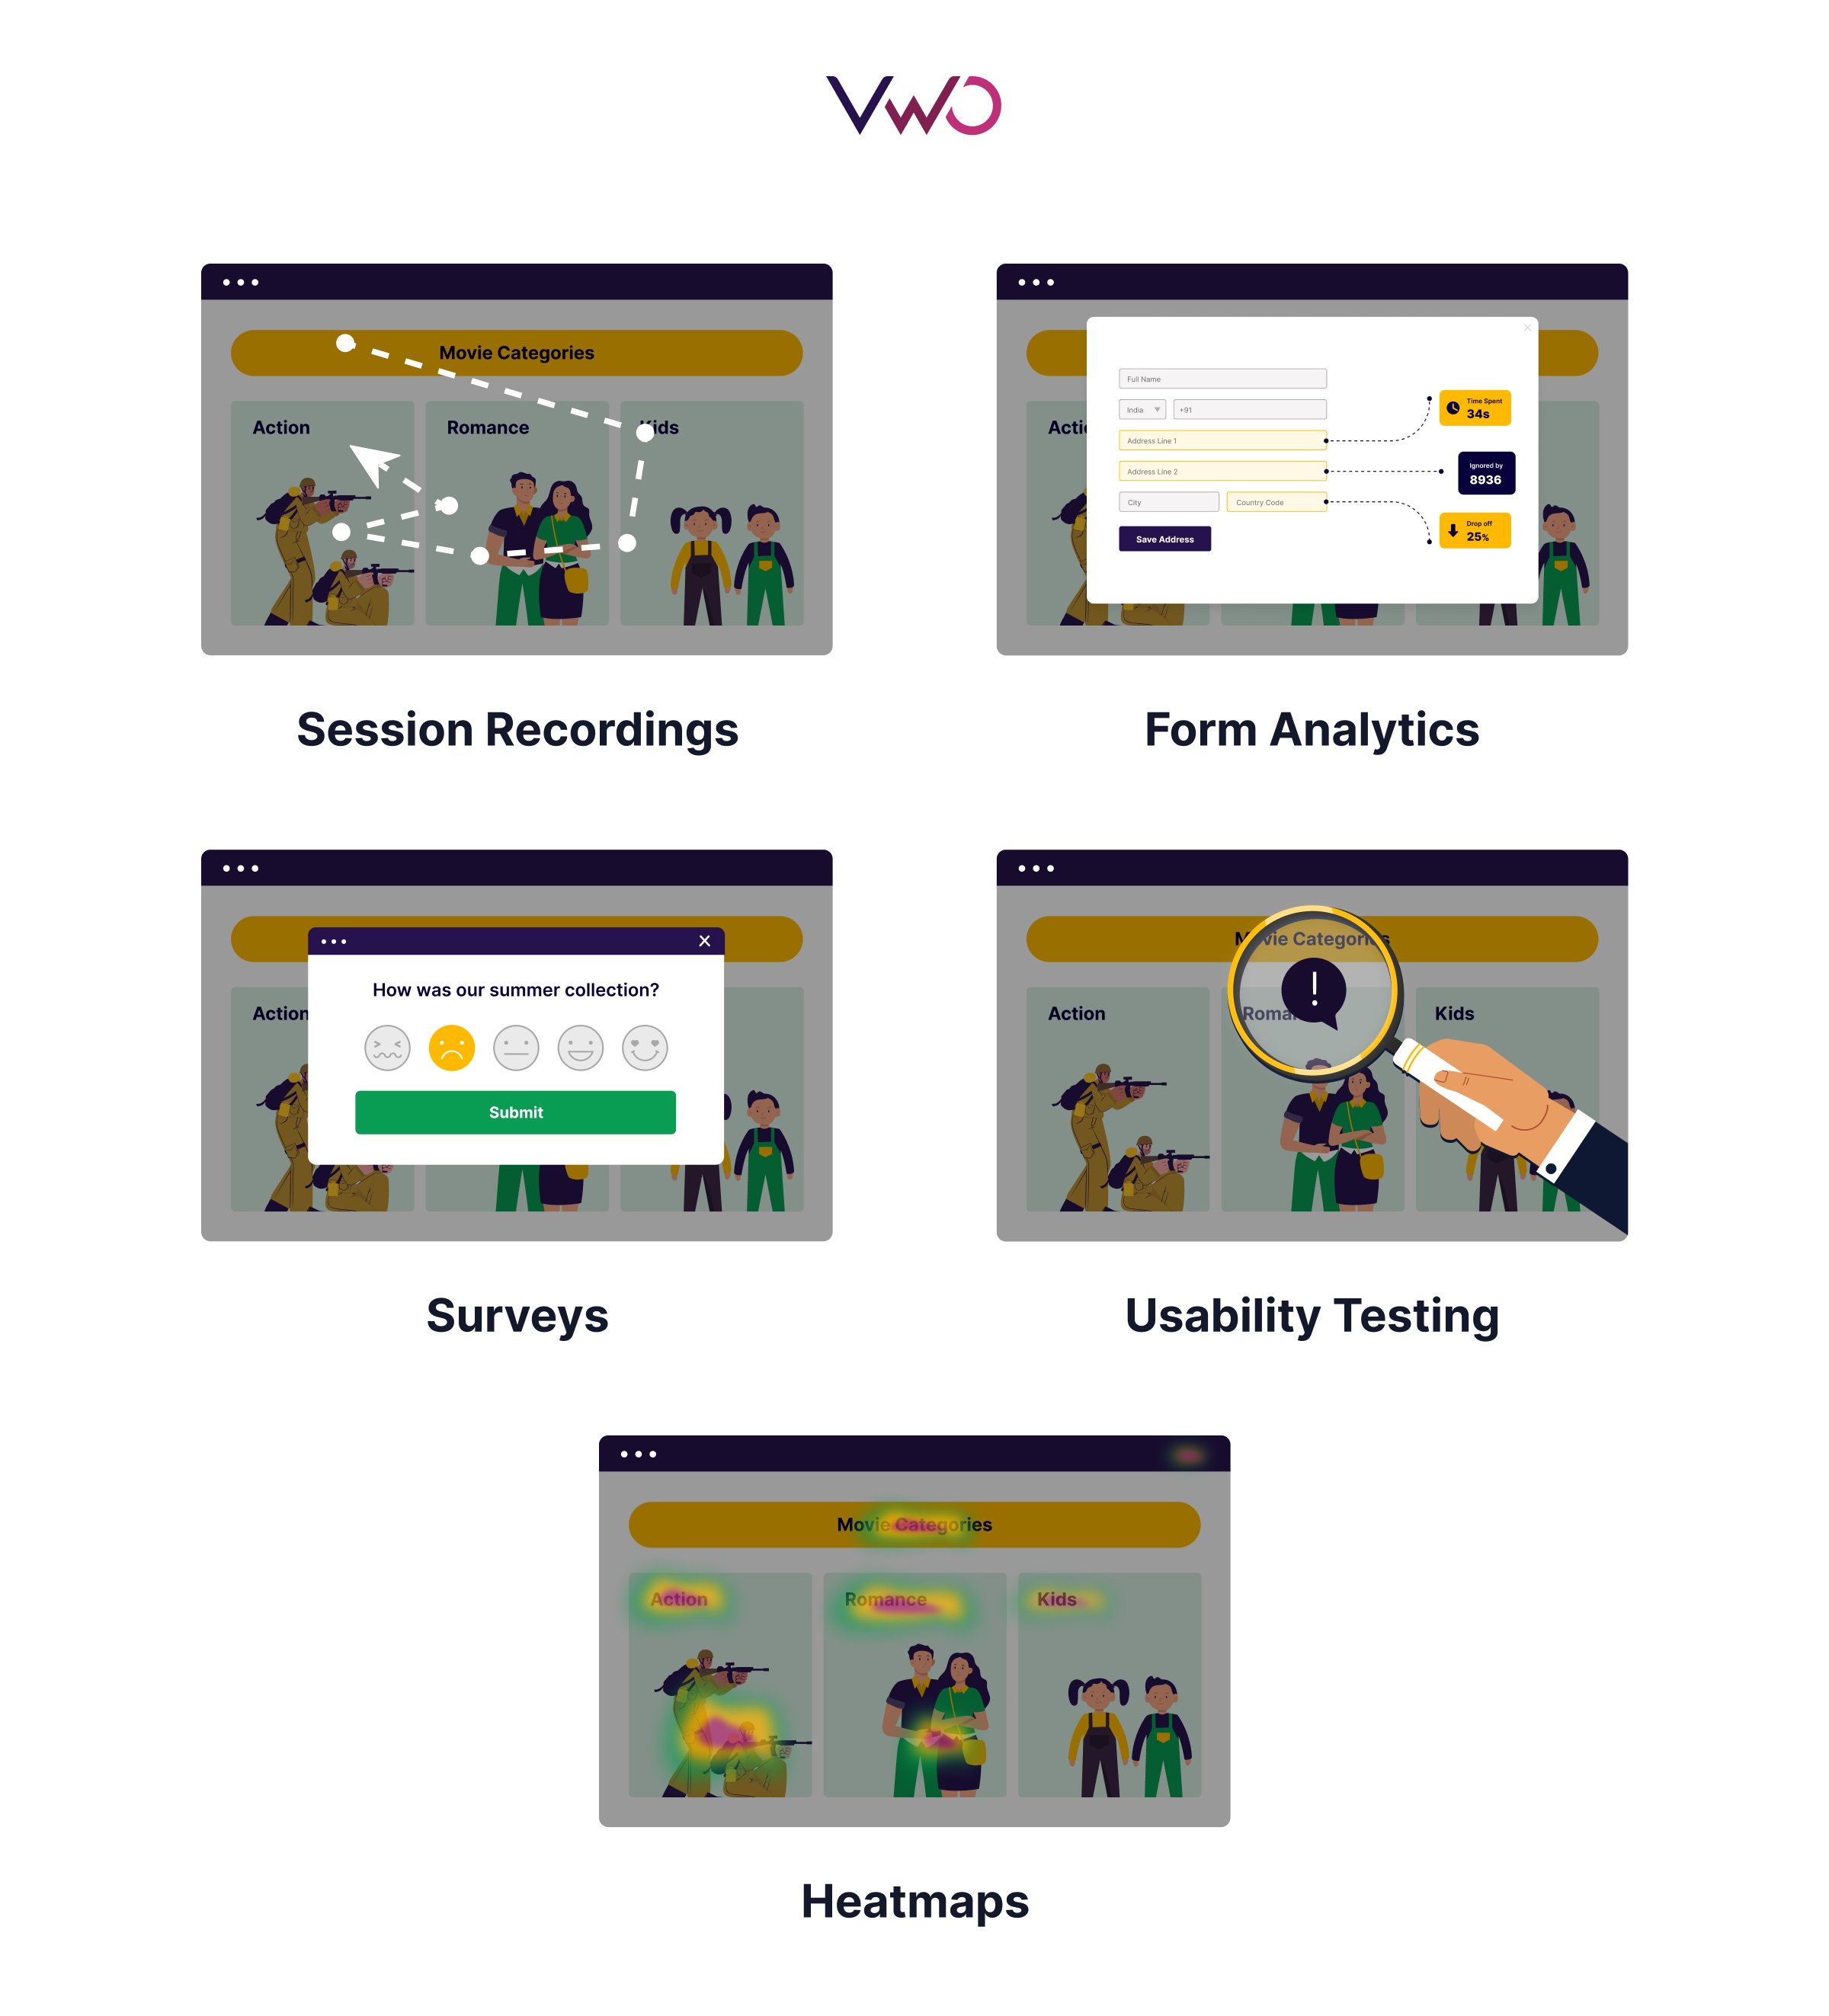
Integrate with other analytics tools
Website heatmap data is helpful but not complete; there is a lot to know about visitor behavior aside from just seeing their interactions through colors. The best way to approach this is to combine website heatmap data with insights gathered through other tools like session recordings, form analytics, and surveys.
Recordings will show where visitors click, how they navigate, and where they pause, highlighting moments of hesitation. Similarly, form analytics lets you dive into the field-level performance of your forms. This will reveal which fields are ignored and if visitors are hesitating while filling out a field. Surveys, as you know, will allow you to collect feedback directly from visitors. When you combine all these tools, you get comprehensive insights that website heatmap analytics alone cannot provide.
Segment heatmap data
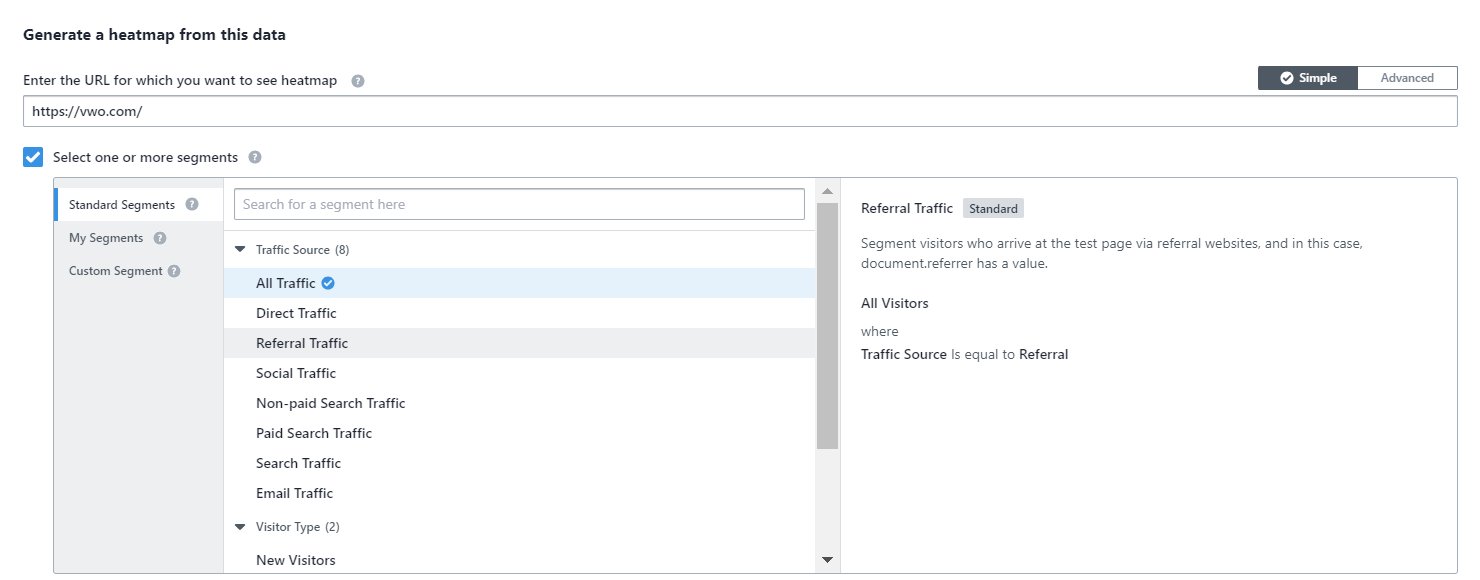
Whether by device, demographics, or traffic sources, segment visitors to look beyond the blanket data and understand specific behaviors and preferences of different visitor groups.
An example: By segmenting heatmap data on a product page by traffic source, you might find that visitors coming from social media channels interact more with promotional banners and sales offers, while visitors arriving organically through the homepage from direct Google search focus on product descriptions and reviews.
This insight allows you to tailor your content and design to cater to each audience segment and enhance conversion rates.
Get a holistic understanding of using combined research tools for your CRO program by watching our VWO Webcast with CRO veteran Craig Sullivan.
Conclusion
Heatmaps are an excellent starting point for qualitative research, providing a clear snapshot of visitor behavior with minimal complexity. Ideal for beginners and busy professionals, they offer quick insights when time is limited. Just remember, for deeper, more nuanced understanding, you’ll need to use heatmaps in combination with more analytics tools and follow best practices.
We just mentioned how integrating various tools can be crucial. If you’re convinced, VWO Web Insights is your go-to solution, combining heatmaps with recordings, surveys, and form analytics for a complete research package. Take a free trial to see how it works and benefits you!
FAQs
Yes, a heatmap is a type of analytics tool that visualizes visitor interactions on a webpage through color-coded data. It helps you understand where visitors click, scroll, and spend time, offering insights into their behavior and engagement patterns.
When it comes to website heatmaps, the process is simplified because you have tools like VWO Heatmaps, which allow you to generate heatmaps easily based on real-time visitor data.
VWO Insights is a suite of behavioral analytics tools, one of which includes heatmaps. It shows exactly how visitors have responded to the different elements on your website, based on real-time visitor behavior.
Heatmap tracking can be done alongside other Google Analytics data. After finding the page analytics data on Google Analytics, you will know what’s wrong and which metrics you must improve. Next, you can turn to heatmaps to see a visual representation of visitor behavior on your website. This will tell you where the problem is and which elements have to be improved.
Are you interested in learning how to make a Google Analytics heatmap? Well, that’s a bit complex, but you can find all the relevant details on the page about Google Analytics heatmap & chrome extensions in this blog.
Few clicks on your heatmap may indicate that visitors are not engaging heavily with the page elements or that the page layout isn’t effectively driving interactions. These data points might also reflect that visitors are spending more time reading rather than clicking.
Heatmaps typically show click data, scroll depth, and engagement, but they generally do not track mouse movement. For mouse movement tracking, you would need to use additional tools like session recordings or visitor behavior-tracking software.
Yes, heatmaps can help increase conversions by revealing how users interact with your site and highlighting areas of high or low engagement. By addressing issues and optimizing key elements based on these insights, you can enhance user experience and improve conversion rates.


