

Google Analytics (GA) is one of the many services that Google offers to help you measure your website’s performance by tracking and collecting metrics on your website visitors, their conversion rate, bounce rate, average session duration, page views, and so on.
Despite tracking every data point that marketers need to gauge their website’s performance, Google Analytics lacks one crucial element—the visualization of collected data, particularly website heatmaps analytics. This has always been a major cause of concern for its users because it means they invariably have to invest in other visualization tools.
Download Free: Website Heatmap Guide
Google Analytics and heatmaps
A quick SERP analysis of the query ‘Google Analytics heatmaps’ on Google highlights the existence of two contrasting intents behind raising this query. The first is that readers want to learn how to create a website click map using their Google Analytics data with a Google Chrome extension, and the second is how they can analyze data using different heatmaps.
This blog attempts to address both these queries so readers can gauge every aspect of Google Analytics-related heatmap.
To tackle the gap between numerical data and data visualization, Google released its In-Page Analytics feature, which now works through a Page Analytics Chrome Extension. This way, Google Analytics bridged the gap between quantitative and qualitative data to a great extent.
Google Analytics heatmap extension on Chrome
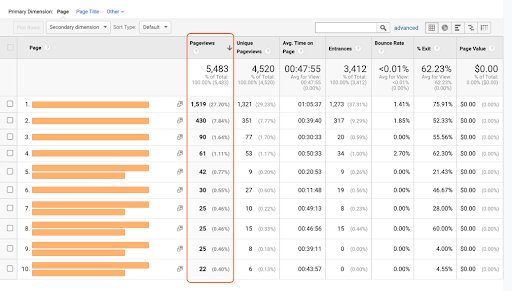
When it was first introduced, the In-Page Analytics feature looked like this on the Google Analytics dashboard:
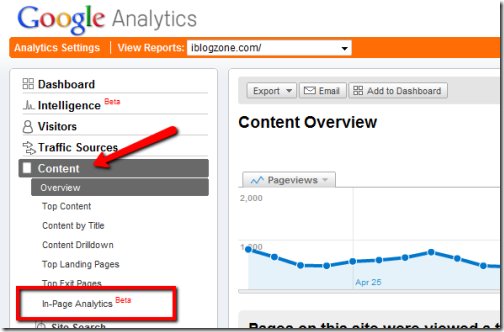
The heatmap generated using this feature showed user clicks on links on a page in percentages (aka a click map).
The only prerequisite for this was that you must be logged into your website’s Google analytics account, and then you can configure your Google Analytics settings and view data on your web pages as you navigate through them.
However, Google Analytics soon removed this from In-Page Analytics and introduced a Page Analytics Chrome Extension for the same. Once you install the extension, you can view click data in the form of click maps. The video (GIF) below elucidates how this extension works and adds a heatmap to the website (click map):
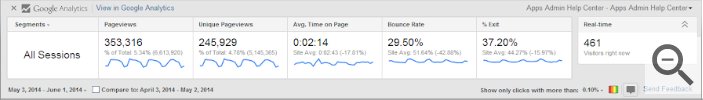
The Page Analytics extension once turned on for a page, gives an overview of different metrics. The default metrics—page views, unique page views, average time on page, bounce rate, exit percentage, and real-time page visitors—are present when the extension turns on. However, you can always replace them with the metrics you want to see on the page.
More importantly, it gives you the option to change the segment whose data you want to see on the page itself.
Here’s how the extension on Page Analytics by Google works and how you can configure the data displayed in the above-shown reporting tab:
1. Set up your Google Analytics account: The only condition that needs to be met for using the Page Analytics extension is to have a GA account set up for the website/URL on which you want to use the plug-in. Once you have an account set up, you can download the Page Analytics extension, and your GA account will supply it with all the captured and configured data like segment, geography, and so on.
2. Segment visitors: Google Analytics comes with built-in segments on top of which you can create custom segments based on the target audience. These segments are then automatically fed into the extension’s segment drop-down so you can easily change them on the page while you are browsing through it.
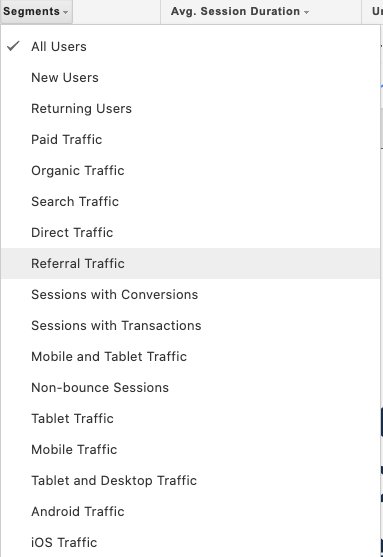
You can add up to 4 segments, and for each segment, Page Analytics displays an individual reporting tab.
Download Free: Website Heatmap Guide
3. Modify configurations: If you look at the extension’s reporting dashboard above, you will see that it displays data on metrics like page views, unique page views, average time on page, bounce rate, and so on. For each one of these, there is a drop-down from where you can choose the metric you want to track.
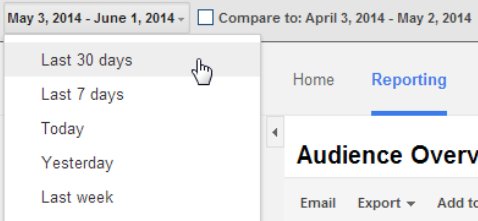
Once you configure these elements, you will be able to see some numbers reflected against each of them. Now, the best part about this particular extension is its versatility and how much room it gives for you to configure the settings on the page itself. You can select if you want to see data on all website visitors or real-time visitors, or you can modify the date range, add a date range for the data to be compared, customize the clicks threshold, and more.
With the configurations being taken care of, the Page Analytics extension allows a Google Analytics heat mapping in real-time that visualizes click data on the web pages. You can either choose to simply see the data through colors or a small bubble displaying percentages, or both.

4. Analyze the plotted heatmap: Using the two visualization types mentioned above, alongside diving deep into Google Analytics data, you can discover trends in user behavior on your pages, their click pattern on links and come up with data-backed solutions to fix user experience compromising elements.
However, even after offering so much, the Page Analytics extension by Google Analytics has one significant flaw: it only creates click maps, and that too for the links on the web pages alone. Hence, if you plan on using website heatmaps as a primary tool for data visualization and data analysis, you will have to invest in a full-blown heatmap tool such as VWO.
VWO heatmaps is a robust tool you can use to comprehensively visualize visitors’ behavior and their interaction with your site. Learn more about VWO heatmaps in the section below.
Other heat maps powered by Google Analytics
The second query intent on how to create heatmaps using the data collected through Google Analytics has been answered in detail by Seer Interactive. Their web analytics team built a Google sheet. This sheet basically behaves like a dashboard that lets you heatmap certain metrics and enables you to identify major trends over time. For instance, look at the heatmap they created using Google Analytics data to identify when visitors are landing on the website organically to pinpoint the best time to push content pieces live and when to promote them:
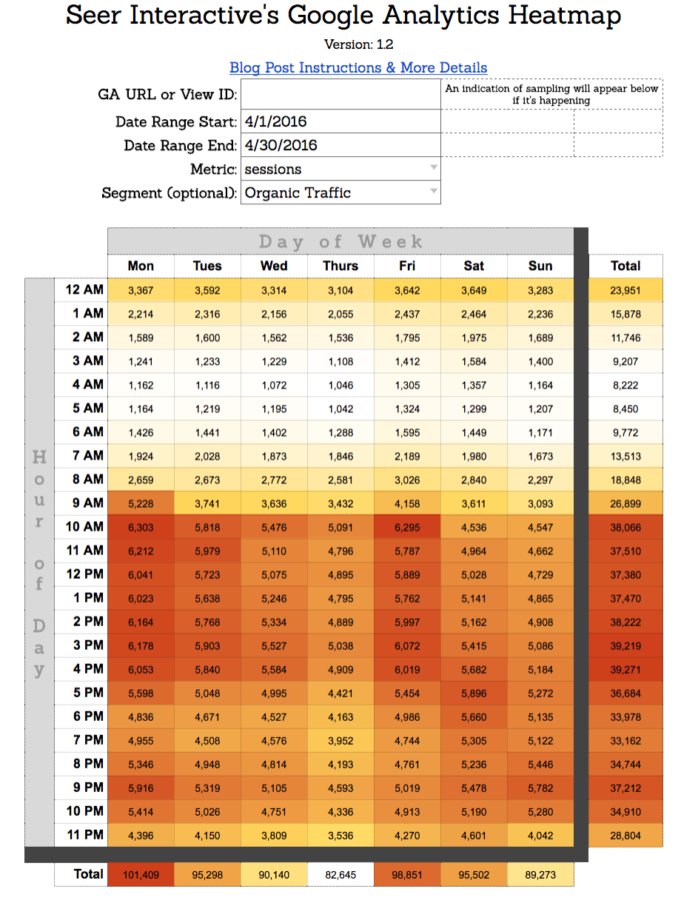
To get started, you can refer to Seer Interactive’s Google Analytics heat map sheet and see how they help their clients by leveraging the power of Google Analytics.
Now that both the questions about Google Analytics heat map have been addressed, put on your analytics glasses and see for yourself how it can help you collect and visualize data in a way that was not possible before when Google Analytics offered only numerical information on how visitors interacted with your website.
How to view Google Tag Manager data in GA4
With Google Tag Manager, you can set up, maintain, and manage all your GA4 events in one place. You can send data from Google Tag Manager to GA4 with the help of two tags:
Google tag – This tag enables the transfer of data from your website to Google Analytics and any other destinations.
Google Analytics: GA4 Event – This tag enables you to set up events on your website without writing code. Data from these events can be viewed in your GA4 reports.
Step 1: Create a GA4 account and set up Google Tag Manager.
Step 2: Create a Google tag in your GTM account, set up a trigger to load the tag, and verify it works as intended.
Step 3: Next, you must configure a Google Analytics: GA4 Event tag and create a trigger that specifies when the event should be sent.
Step 4: Now, you can view your events and the corresponding parameters by using the Realtime and DebugView reports. These two GA4 reports present the events that users trigger on your website as they are triggered.
Integrating your GTM account with VWO
The VWO <> GTM integration enables easier integration of certain third-party applications with your VWO account. Here’s how you can do it:
Step 1: Log in to your VWO account.
Step 2: Go to the main menu panel and navigate to Configurations > Integrations.
Step 3: Search for “Google Tag Manager” and select the Google Tag Manager tile.
Step 4: Go to the Info tab, and click on Enable Now. Your VWO account is now integrated with Google Tag Manager.
Go beyond click maps with VWO heatmaps
VWO Heatmaps converts raw visitor data into visual insights that help in making impactful optimization decisions. Instead of drowning in spreadsheets, you’ll see exactly how visitors interact with your pages, what captures their attention, what they ignore, and where they struggle.
VWO Heatmap features
Click insights
- Clickmaps – Track clicks on specific elements and compare engagement across page areas
- Element List – View all page elements (visible and hidden) ranked by click volume
- Click Area – Select and compare engagement across multiple page zones instantly
- Click Filters – Analyze visitors’ first actions to understand initial intent
Scroll & engagement tracking
- Scrollmaps – Discover how deep visitors scroll and where they lose interest
- Zonalmaps – Break pages into distinct zones to identify conversion drivers
Friction detection
- Frictionmaps – Spot user frustration through rage clicks, dead clicks, and error patterns
- Experience Score – Monitor user satisfaction trends and connect friction to recent changes
Smart automation
- AI-powered Heatmap Analysis – Automatically identifies engagement patterns and surfaces actionable recommendations
- Schedule Heatmap Views – Scheduled heatmap views for automated data collection
Watch this brief demo to see how VWO’s generative AI feature (VWO Copilot) automates heatmap analysis, making it faster, simpler, and more scalable than ever.
Seamless integration with other VWO capabilities
- A/B Test Variation Heatmap – View heatmaps for specific A/B test variations*
- Funnel Drop-off Filters – Use funnel-based filtering to understand why visitors abandon conversions
- Testing Roadmap Integration – Connect insights directly to your testing roadmap
Collaborative analysis
- Observations – Add observations with automatic heatmap screenshots for team collaboration
- Heatmap Views – Create saved views for quick access to specific segments without reconfiguration
- Browsable Heatmap – Navigate naturally through pages, popups, and gated content while viewing heatmaps
- Multi-Device Heatmaps – Compare behavior across desktop, tablet, and mobile experiences
VWO Insights Dashboard
With VWO’s Insights Dashboard, you can access:
- Quick Action Links – Access direct links from insights to optimization actions
- Friction Trend Chart – Monitor real-time friction trends to catch UX issues immediately
- Experience Score Widget – Track proactive surfacing of visitor experience metrics
Here’s a quick comparison of features offered by VWO heatmaps versus Google Analytics heatmaps:
| Feature | VWO | Google Analytics Heatmaps |
| Core Visualization | ||
| Clickmaps | ✓ | ✓ |
| Scrollmaps | ✓ | ✗ |
| Frictionmaps (rage clicks, dead clicks, errors) | ✓ | ✗ |
| Zonalmaps | ✓ | ✗ |
| Click Analysis | ||
| Tracking clicks on non-clickable elements | ✓ | ✗ |
| Click Area selection tool | ✓ | ✗ |
| Click Filters (first <n> clicks) | ✓ | ✗ |
| Element List (ranked by engagement) | ✓ | ✗ |
| Advanced Features | ||
| One-click view | ✓ | ✗ |
| Multi-Device Heatmaps | ✓ | ✗ |
| Browsable Heatmap (navigate while viewing) | ✓ | ✗ |
| A/B Test Variation Heatmap* | ✓ | ✗ |
| Funnel Drop-off Filters | ✓ | ✗ |
| Automation & Intelligence | ||
| AI-powered Automated Analysis (VWO Copilot) | ✓ | ✗ |
| Heatmap Views (saved configurations) | ✓ | ✗ |
| Schedule Heatmap Views | ✓ | ✗ |
| Experience Score tracking | ✓ | ✗ |
| Friction Trend monitoring | ✓ | ✗ |
| Collaboration | ||
| Recording observations | ✓ | ✗ |
| Heatmap Screenshots with observations | ✓ | ✗ |
Ready to discover what’s really happening on your website? VWO Heatmaps turns every click, scroll, and struggle into an optimization opportunity. Start your free trial and see the insights you’ve been missing.
FAQs on Google Analytics heatmaps
The Google Analytics in-page feature shows users clicks on links on a particular page in percentages, i.e., a click map. It is no longer a feature of Google Analytics, however, you can still create the click map through Google Analytics, using the Page Analytics Chrome extension.
The heatmaps created on the website data extracted from Google Analytics can help you easily identify and visualize trends within your important Google Analytics metrics such as the number of new website visitors, pages/user sessions, etc. We have shared a template where you can easily set up Google Analytics-powered heatmaps. Get the template in the post.
It is a visualization tool that displays the density of data points through colors. The color becomes darker as the density of data points increases.
No, there is no built-in heat map on Google Tag Manager. However, you can set up the tag manager with a single tracking code and integrate third-party tools like VWO to visualize the data.
Categories:


![Top 10 Shopify Heatmap Apps [With Features – 2026]](https://static.wingify.com/gcp/uploads/sites/3/2020/04/Feature-image_Shopify-Heatmaps-All-you-need-to-know.png?tr=w-300,h-150)


