Conversion Rate Optimization for a website starts with tracking website performance and identifying areas of improvement.
This task is best done using a web analytics tool.
Although there are innumerable web analytics tools available, Google Analytics (GA) is the most widely used tool across all websites — owing to its comprehensive reporting system, and free availability.
Google Analytics offers a ton of metrics and dimensions based on which you can evaluate your website (and its individual pages).
Download Free: Conversion Rate Optimization Guide
However, not all of those Google Analytics metrics and dimensions will necessarily relate to your website. Hence, it’s imperative that you recognize the metrics and dimensions pertaining to your business and end goals.
This post will help you know the key Google Analytics metrics and dimensions better, and offer you actionable tips to effectively use them in your CRO strategy.
Tracking Website Audience
You can find the following metrics in GA here: Audience > Overview.
Sessions
In simplest terms, sessions give the number of times users have stayed on a website (for a specific amount of time).
A user’s GA session ends in 30 minutes if the user is inactive on a website. So if you’ve visited a website twice — with 30 minutes of inactivity in between — the session count will be two. Google explains it with more examples here.
Usually, the more the number of sessions, the greater is the popularity of a website.
Increasing the number of sessions for your website is important. However, there is a catch. Since a single user can have multiple sessions for a website, the total number of sessions can increase even with a decrease in the number of individual users.
Along with tracking sessions for your website, you should also look at the number of individual users contributing to those sessions.
Users
This metric provides the number of unique visitors for a website. These unique visitors account for the total number of sessions.
While your website sessions are increasing, make sure that the users’ metric is also growing.
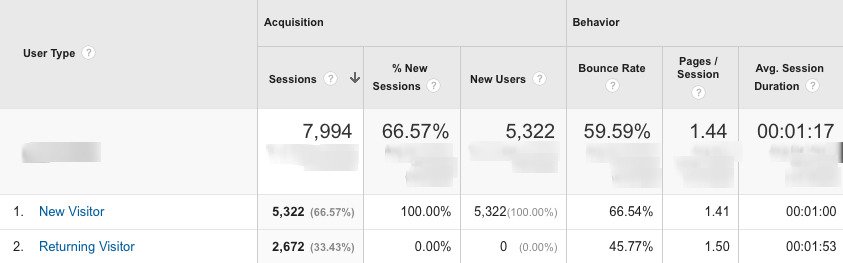
New Visitors
This metric shows the number of visitors that have arrived on a website for the first time, in a selected date range.
Consider this: You’re tracking your website data in Google Analytics for the past 30 days. Users who visited your website for the first time in these 30 days will be counted as new visitors – even if they visited your website before this date range.
A growing number of new visitors indicates that a website is able to reach more users than it previously did.
For websites like eCommerce, this metric is of great importance. With more new visitors, eCommerce websites have the opportunity of converting a greater number of users into customers. However, one should check whether the revenue figure, too, is going up along with the number of new visitors.
In addition, it’s also important to check whether new visitors are coming to your website organically or through online ads. With online ads, it’s easier to receive new visitors as the ads reach out to a large audience. But if your website receives a big chunk of new visitors organically, it implies that you have a strong presence across search engines.
Returning Visitors
Returning visitors metric gives the number of users who have visited a website more than once, in a selected date range.
A growing number of returning visitors normally indicates that more users are liking the content of a website and are returning to browse again. Returning visitors can be considered a website’s loyal audience.
Sometimes, returning visitors can hold greater importance than new visitors to websites. The reason is that returning visitors are more prone to convert in comparison to new visitors. An increase in returning visitors can imply that more users are coming back to browse the site content, building greater trust and recall with the website.
Tip: A blog site can find outposts that have a huge number of returning visitors. This shows that the post is possibly a great information resource. The post can then be re-purposed into a quick-read pdf or a slide deck. Next, these downloadable resources can be made available to users after they provide their email addresses, generating subscribers or leads.
Traffic Channels
You can find traffic for your website here: Acquisition > All Traffic > Channels.
Going through the traffic channels data for your website, you can find the better-performing channels and promote them for your future campaigns.
Organic Traffic
Organic traffic refers to users who land on a website through a search engine results page (SERP).
Growing organic traffic reflects improving the visibility of a website across search engines. It’s an effective dimension to see whether your SEO efforts are fruitful or not.
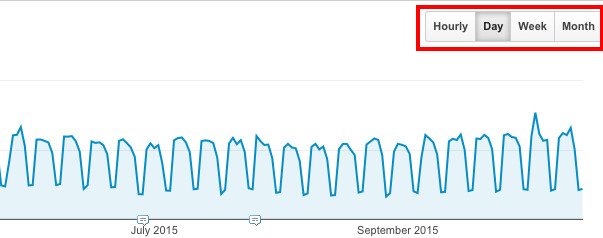
Nevertheless, since SEO strategies can take time in delivering results, you should study your organic traffic for a long stretch of time (weeks or months).
To find trends in website data, Google Analytics lets you create graphs on the basis of hours, days, weeks, and months. When looking at organic traffic data on a graph for a long stretch of time, you can toggle between day, week and month to find micro-trends and macro-trends.
Paid Search Traffic
This channel includes users that visit a website by clicking on its ad on a search engine.
Ensure that your paid search traffic is seasoned well on the landing page.
The landing page of your search ads should be optimized so that it’s able to push users deeper into the conversion funnel. As per best practices, a landing page should be succinct, targeted, and conversion-oriented. A good practice is to A/B test variations of your landing page and finds out which one is liked more by visitors.
Referral Traffic
When users arrive on a website by clicking on hyperlinks from other websites, they are counted as referral traffic.
With referral traffic, you can know if backlinks are contributing to your audience or not. Further, you can find the top sources that direct traffic to your website.
Referral traffic on GA can reveal the admirers of your website.
If you’re planning to have partnerships or affiliate programs with other websites, you can look at sources of referral traffic and decide on the kind of websites to approach.
Furthermore, you can also identify spammy referral sources that you don’t want your website to be linked with and disavow them.
Email Traffic
Email traffic is simply the users coming to a website by clicking links included in emails.
You can use this dimension to learn about the performance of your email campaigns — more than just open rates and click rates.
Even if an email has a great click rate, you can confirm if users actually engaged with the linked page. You can take the help of metrics like average time on page, bounce rate, conversions, etc., and find whether users actually stayed on the page and converted. At the end of the day, opens and clicks don’t set the registers ringing; actual conversions do.
Social Traffic
Social traffic includes users who visit a website through links on social media.
Social traffic can be used to determine which social media platform works best for a website. You can find social channels that are directing the most number of users to your website (having high time on page and low bounce rate), and concentrate on them more.
You can also find out if a particular social media channel — on which you’re investing time and effort — isn’t bringing the expected amount of traffic. Next, you can plan to resolve the issues with the social channel (or minimize your efforts on the channel).
Direct Traffic
When users arrive at a web page by typing in its URL on a browser, by clicking on a bookmarked link, or by clicking on links from email or social media that are not tagged, they constitute direct traffic.
Caveat: There can be instances when social, referral or any other form of traffic is shown as direct traffic in Google Analytics. Avinash Kaushik explains how this can happen (and how to avoid it).
Download Free: Conversion Rate Optimization Guide
Tracking Website Performance
These metrics will let you evaluate individual pages of your website.
Pageviews
It simply shows the number of times a web page has been viewed by users.
Pageviews tell you which web pages are visited most by your audience. And with this information at hand, you can know where to put up content on your website to grab the maximum eyeballs.
Pageviews metric lets you compare the popularity of individual pages of your website.
Average Time on Page
This metric shows how long users are spending time on a web page (or web pages).
You can find the average time users spend on the popular web pages (based on high pageviews) of your website. By doing so, you can find pages that have a large audience but where users don’t spend much time. Such web pages can be optimized to make the users stay a little longer.
You can also use the average time on the page to compare the effectiveness of your online campaigns. Suppose you are directing users to a particular web page on your website using different channels such as email, social media, online ads, etc. You can identify the channels, coming through which, users spend the highest and the least amount of time on the web page. Building on this further, you can identify page and channel combos that hold the most promise and combinations that need the most optimization. This insight can help you determine the medium for your future campaigns.
Bounce Rate
When a user arrives on a website and leaves without going through other pages of the website, it is counted as a bounce. All single-page visits to a website are considered bounces.
Bounce rate of a web page is the percentage of visitors that bounce from that web page.
A high bounce rate might suggest that a web page doesn’t have an inviting call-to-action or links to other pages of the website. It can also mean that a web page lacks quality content, failing to convince users to stay.
Bounce rate can tell you whether your online campaigns are working fine or not. If there is a high bounce rate for traffic coming through search ads, there is possibly a disconnect between the ad copy and the web page it leads to.
When your ad copies relate well with landing pages, your bounce rate shrinks.
Additionally, to reduce the bounce rate on your web pages, you can incorporate more links (or more pertaining links) to other web pages. A blog, for example, can include “related posts” links to its pages and reduce bounce.
That being said, a high bounce rate isn’t always bad news for websites. Some of the knowledge-sharing websites can have a sky-high bounce rate, and it still might not hurt them. For instance, users on a dictionary website would come, look for the meaning of the word they need, and leave.
Caveat: Google Analytics doesn’t let you know the time spent by “bounced” users on web pages.
Related Post: 14 Ways to Reduce Bounce and Increase Engagement on Your eCommerce Site
Exit Rate
The exit rate is the percentage of visitors that land on a web page and leave.
Unlike bounces, exits are counted whenever users leave a web page, regardless of whether they browsed other web pages earlier.
All bounces are exits, but not all exits are bounces.
The exit rate (and bounce rate) is associated with a web page and not a website. For example, if there’s a website with five web pages, each of the five pages will have its individual exit rate.
The exit rate is a great way to identify the web pages of a conversion funnel (eCommerce funnel, SaaS funnel, Subscription funnel, etc.) that are leaking out users. The web pages with a high exit rate in a conversion funnel require immediate optimization.
Example: Suppose the payment page of an eCommerce site has an alarmingly-high exit rate. The website should look for reasons for this high exit rate (Is it a lengthy form? Is it a lack of specific payment methods?), and fix them.
Related Post: [Infographic] The Anatomy of a Perfect Checkout Page
Understanding Audience Segments
These dimensions will help you know your audience demographics better.
Mobile
The dimension gives you the number of users that visit your website through desktops, mobile devices, and tablets. You can find it here: Audience > Mobile > Overview.
When the data shows that a significant portion of your audience is mobile, you can consider investing more in the mobile version of your website. For instance, you can start developing a responsive design for your website (if you don’t have one yet).
And if the majority of your web traffic is coming from mobile devices, you can even consider developing a mobile app.
Related Post: 10 Reasons Why Mobile Apps are Better Than Mobile Websites
Screen Resolution
By selecting the secondary metric “Screen Resolution,” you can find the different screen sizes that your visitors use.
You can find the most-used screen resolutions for your website, and check if your website is optimized for all of them.
In addition, you can identify the most-used mobile screen resolutions for your website, and develop responsive versions of the website around them.
Location
Location tells you the number of website visitors from different geographic locations across the world.
You can identify locations having the highest level of engagement — based on sessions, time spent on a page, bounce rate, etc., and target your next ad campaigns or email marketing campaign accordingly.
Using Time Intervals
All the above metrics and dimensions provide data for a selected date range. In Google Analytics, it’s the last month by default.
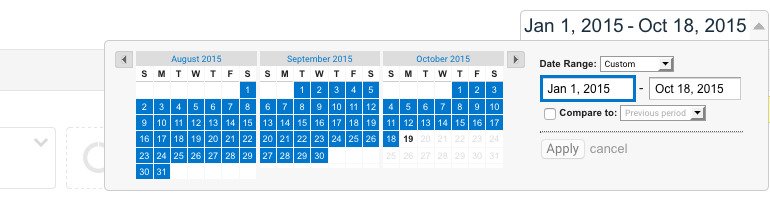
To get a broader perspective on your website performance and user acquisition, you can observe the data on GA for a longer interval. You can look to evaluate your website based on data trends in months.
This can further provide useful insights such as “which day of the week has the highest level of engagement” and “which month’s ad campaigns brought in the highest traffic.” Such kind of information can help you plan more targeted and effective marketing strategies in the future.
It’s advisable that you track data for a long stretch of time before taking any action based on it.
Using heatmaps in Google Analytics, you can also do a qualitative analysis of your website. Once you’ve decided to make changes, find out if the changes would work or not using A/B testing.
Analytics: You Already Use it, Start Using it Better
With the daunting number of metrics and dimensions offered by Google Analytics, it’s essential to identify the ones that pertain to your website goals. Once identified, those metrics and dimensions can provide invaluable actionable insights to optimize your website.
Categories: