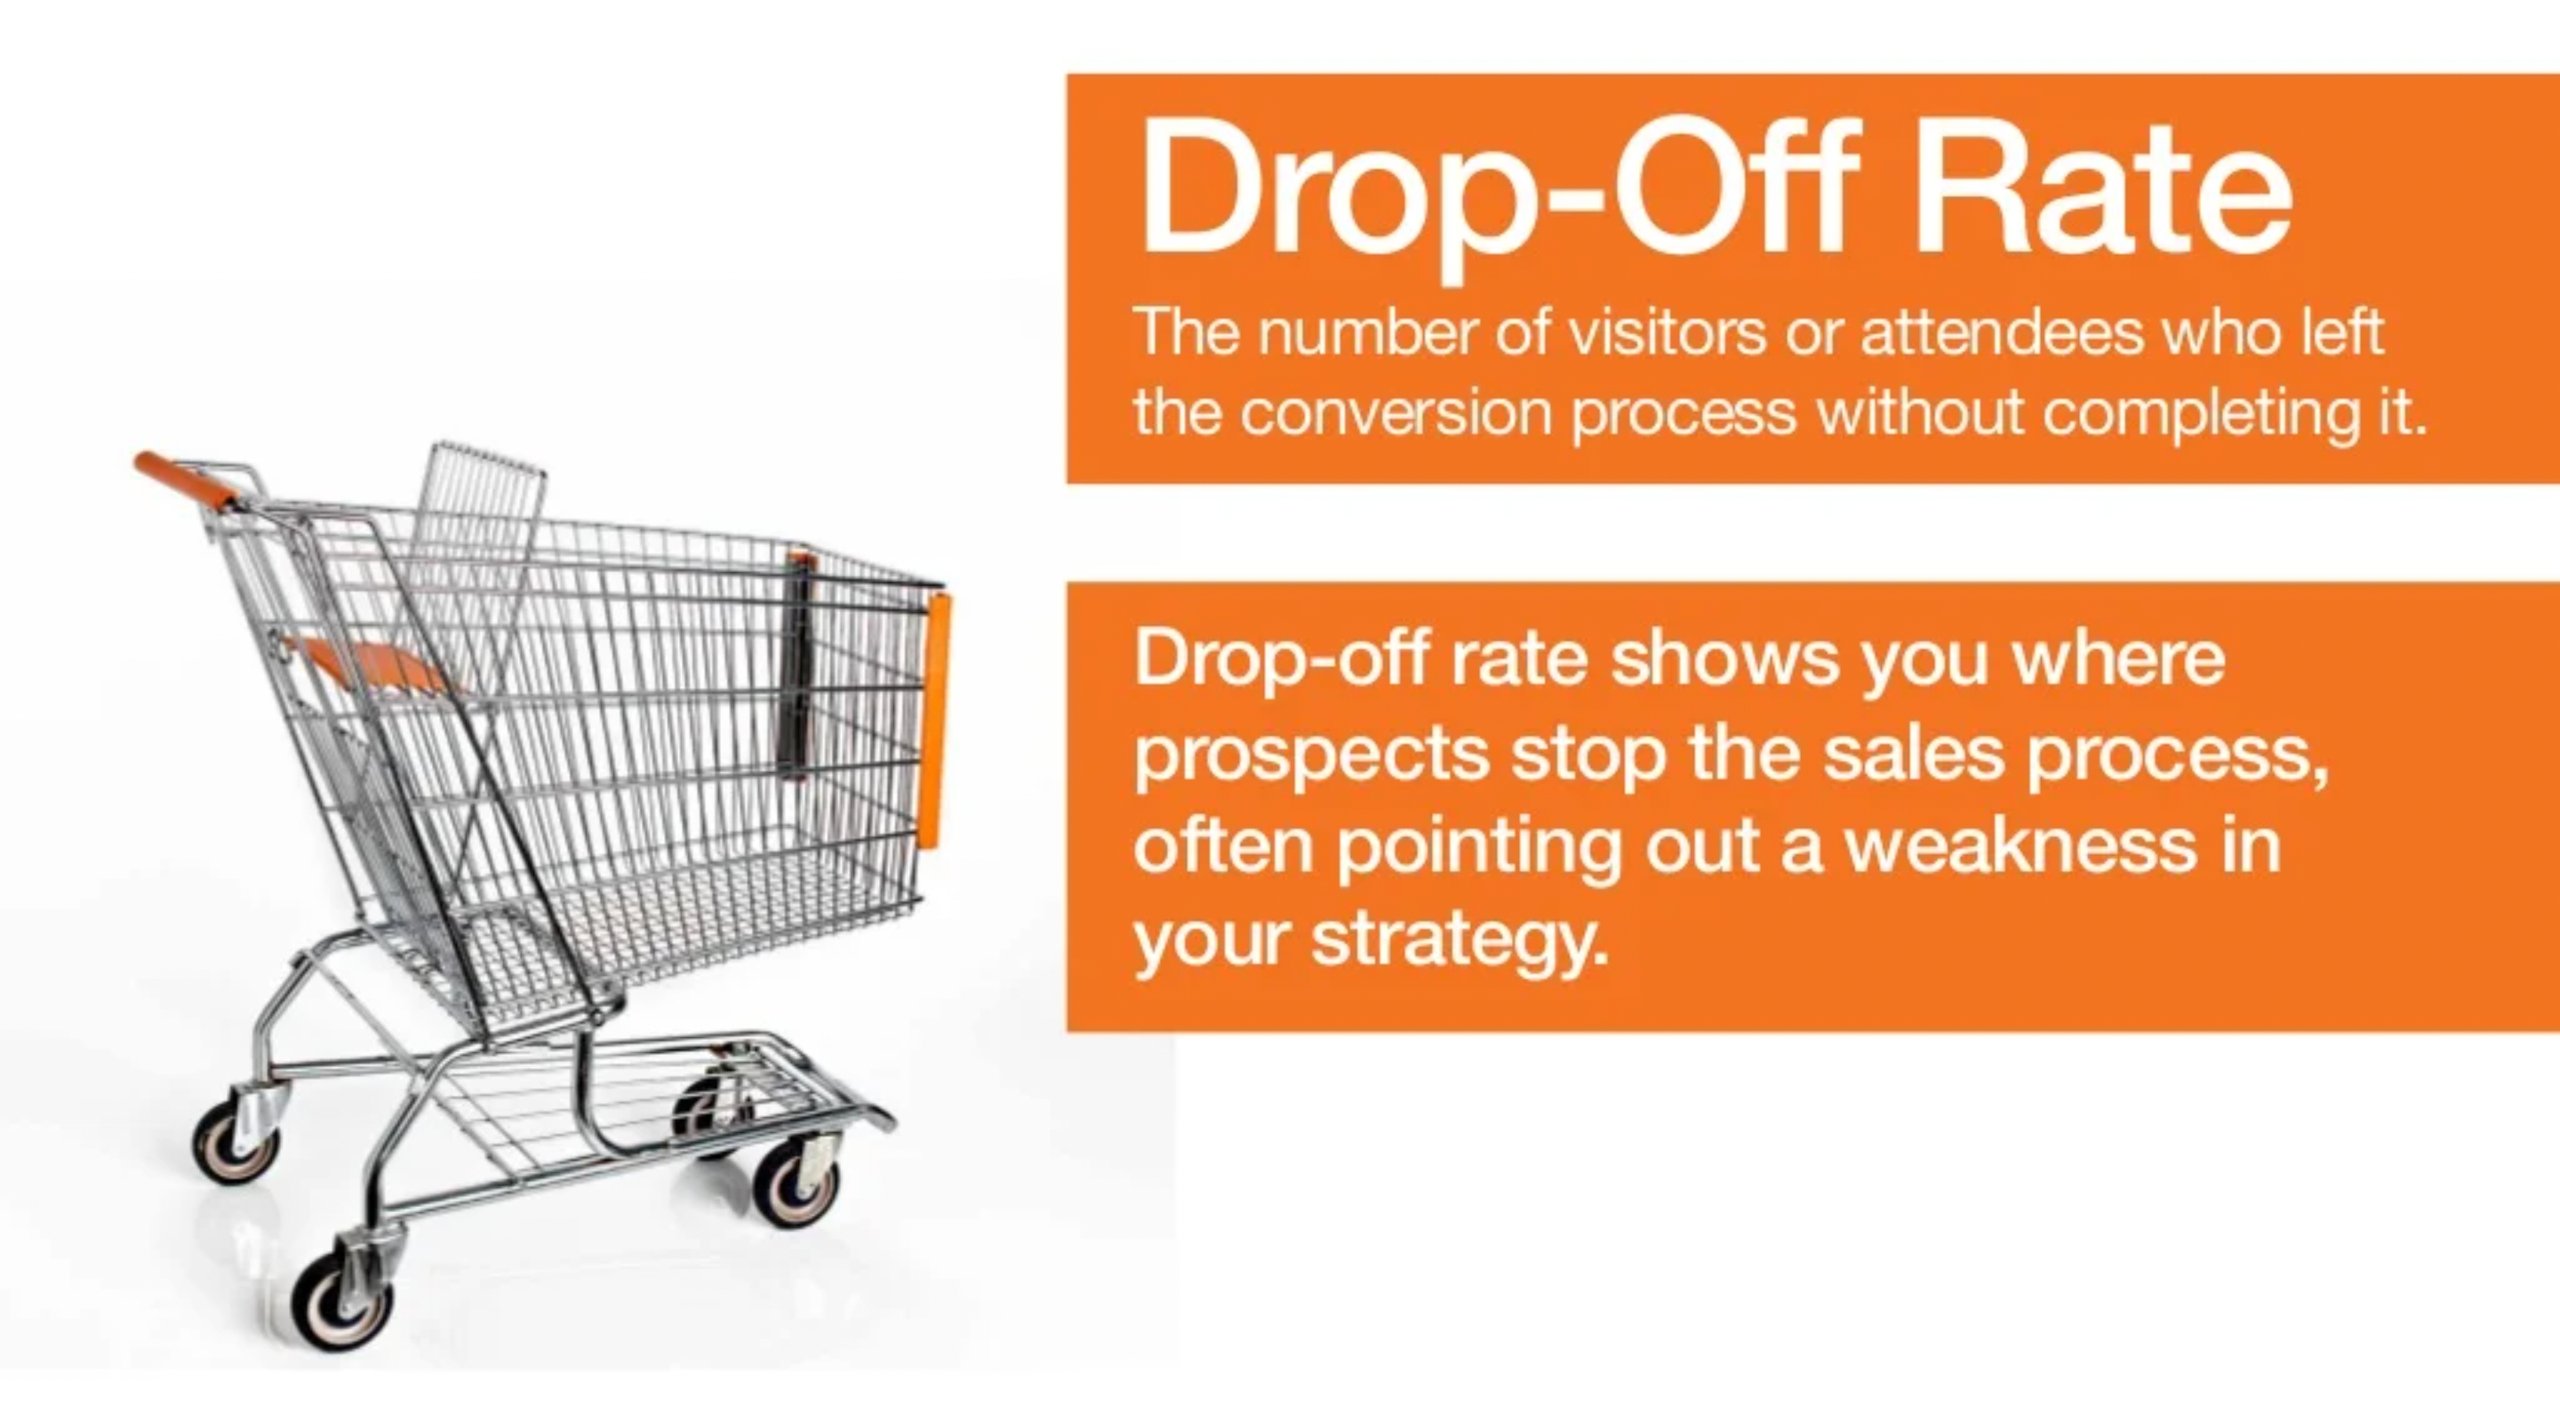
What is the drop-off rate?
The drop-off rate, sometimes referred to as the abandonment rate, is the percentage of visitors who visit the website and enter the conversion process (the funnel) but do not proceed further or take the desired action.

Drop-off Rate Calculation:
The drop-off rate is calculated as:
Number of people abandoning action/ total number of people who initiated it * 100
Example:
If,
Number of people visiting the website – 2000
Visitors making purchases – 200
Drop-off rate = 1800/2000*100 = 90%
The benefit of knowing the drop-off rate:
Assessing this rate can help with website optimization through experimentation and testing. At the heart of everything we do at VWO is experimentation, which allows us to improve client experiences and boost conversion rates.
Sort and prioritize drop-off rates by importance
To pinpoint the areas where you need to concentrate your efforts and determine which components have the most significant impact, you should measure the drop-off rate at each stage of the funnel separately. You are better equipped to enhance and optimize these portions, which will improve the route to conversion if you are aware of the precise locations where the drop alters.
For example,
A homepage can have a 60% drop off if it receives 1000 hits but only 400 of those visitors click the “learn more” CTA.
Out of those 400 visitors, only 120 stay on the website, resulting in a 70% drop-off.
Should you concentrate initially on the second one since the drop-off rate is higher? Given that 600 people are lost on the first step compared to 280 on the second, the first screen is more crucial to users as a whole and has to be fixed immediately.
How you can identify the reasons for drop-offs
Even though your website may receive a lot of traffic, the point at which users quit a conversion process typically reveals areas where customers are having issues with your product, service, or website. Finding these drop-offs and addressing the issues that lead to them will help you increase your conversion rates.
You may create more compelling calls to action at each stage of your sales funnel by first examining the “where” before the “why” of prospect drop-offs.
VWO Insights enables you to spot both opportunities and challenges in the purchasing processes of your website’s users. These behavioural insights are closely linked to experimentation, enabling you to see how consumers are responding to your studies. Some of the features on offer are:
- Funnels: With the use of funnels, you can pinpoint conversion leaks, determine where visitors are losing interest, and delve deeply into the causes of visitor drop-off. You may further filter your funnel data with powerful segmentation features, find new visitor segments, and create complicated segments using bracketing logic.
- Session recordings: The always-available VWO recordings allow you to quickly see session recordings for only those visitors who left at a specific point. Having a better understanding of the sources of friction in a particular customer’s or buyer’s journey makes it simpler to spot chances for testing and growth within that category.
- Heatmaps: VWO heatmaps provide visual representations of visitor behaviour and interaction with your website in real-time. A heatmap is an accurate depiction of all visitor actions, including clicking on items, choosing an option from a modal box, perusing the content of pages, and leaving the website.
- On-page surveys: The answers to why your visitors are acting a specific way can be found in abundance by conducting on-page surveys. Simply ask the correct questions to elicit responses from your visitors.
- Form analytics: With form analytics, you can learn how users interact with your forms and what leads to form abandonment. Additionally, you can discover which fields required the most filling out, time, or confusion from users. You may look at field-level statistics using VWO to get a wider perspective than just your average submission rate.
What are the reasons for drop-offs?
Visitors may drop off or leave websites for a variety of reasons, including:
- Problems with the website design:
- Poor CTAs
- Confusing navigational structure
- Improperly placed content
- Inefficient contact forms
- Slow page load speed
- Huge shipping costs
- A complex checkout process
- Unavailable contact information
Solutions to reduce the drop-off rate
For organizations, lowering the drop-off rate is crucial because it might result in increased sales and clientele. There are several approaches to lower the drop-off rate, including:
- Enhancing website design
- Reducing the steps a client must take to complete the desired action
- A/B testing the complete website experience
- Using compelling copy and imagery to keep viewers interested
- Engaging and educating the customers
Increased conversions may be achieved through drop-off rate analysis and minimization. More visitors who stay on your website longer, go further in the data collection process, and so forth increase the likelihood that they will convert. Keep the customer intrigued and the momentum going by taking this into account when analyzing your marketing statistics.


