
Follow us and stay on top of everything CRO
Read summarized version with
Are you ready to elevate your web analytics and boost user engagement on your website? Understanding your website’s performance and user behavior is crucial for online success in today’s digital landscape. Clickmaps offer valuable insights into user behavior, visually highlighting areas that attract attention and those that might be overlooked.
Clickmaps reveal audience preferences and pain points, enabling you to optimize your website’s design and content. This leads to better user experience, increased engagement, and improved conversion rates.
Whether you’re a seasoned digital marketer or business owner, this post will equip you to harness clickmaps effectively. Learn to make data-driven decisions that will elevate your online presence and boost user engagement.
What are clickmaps?
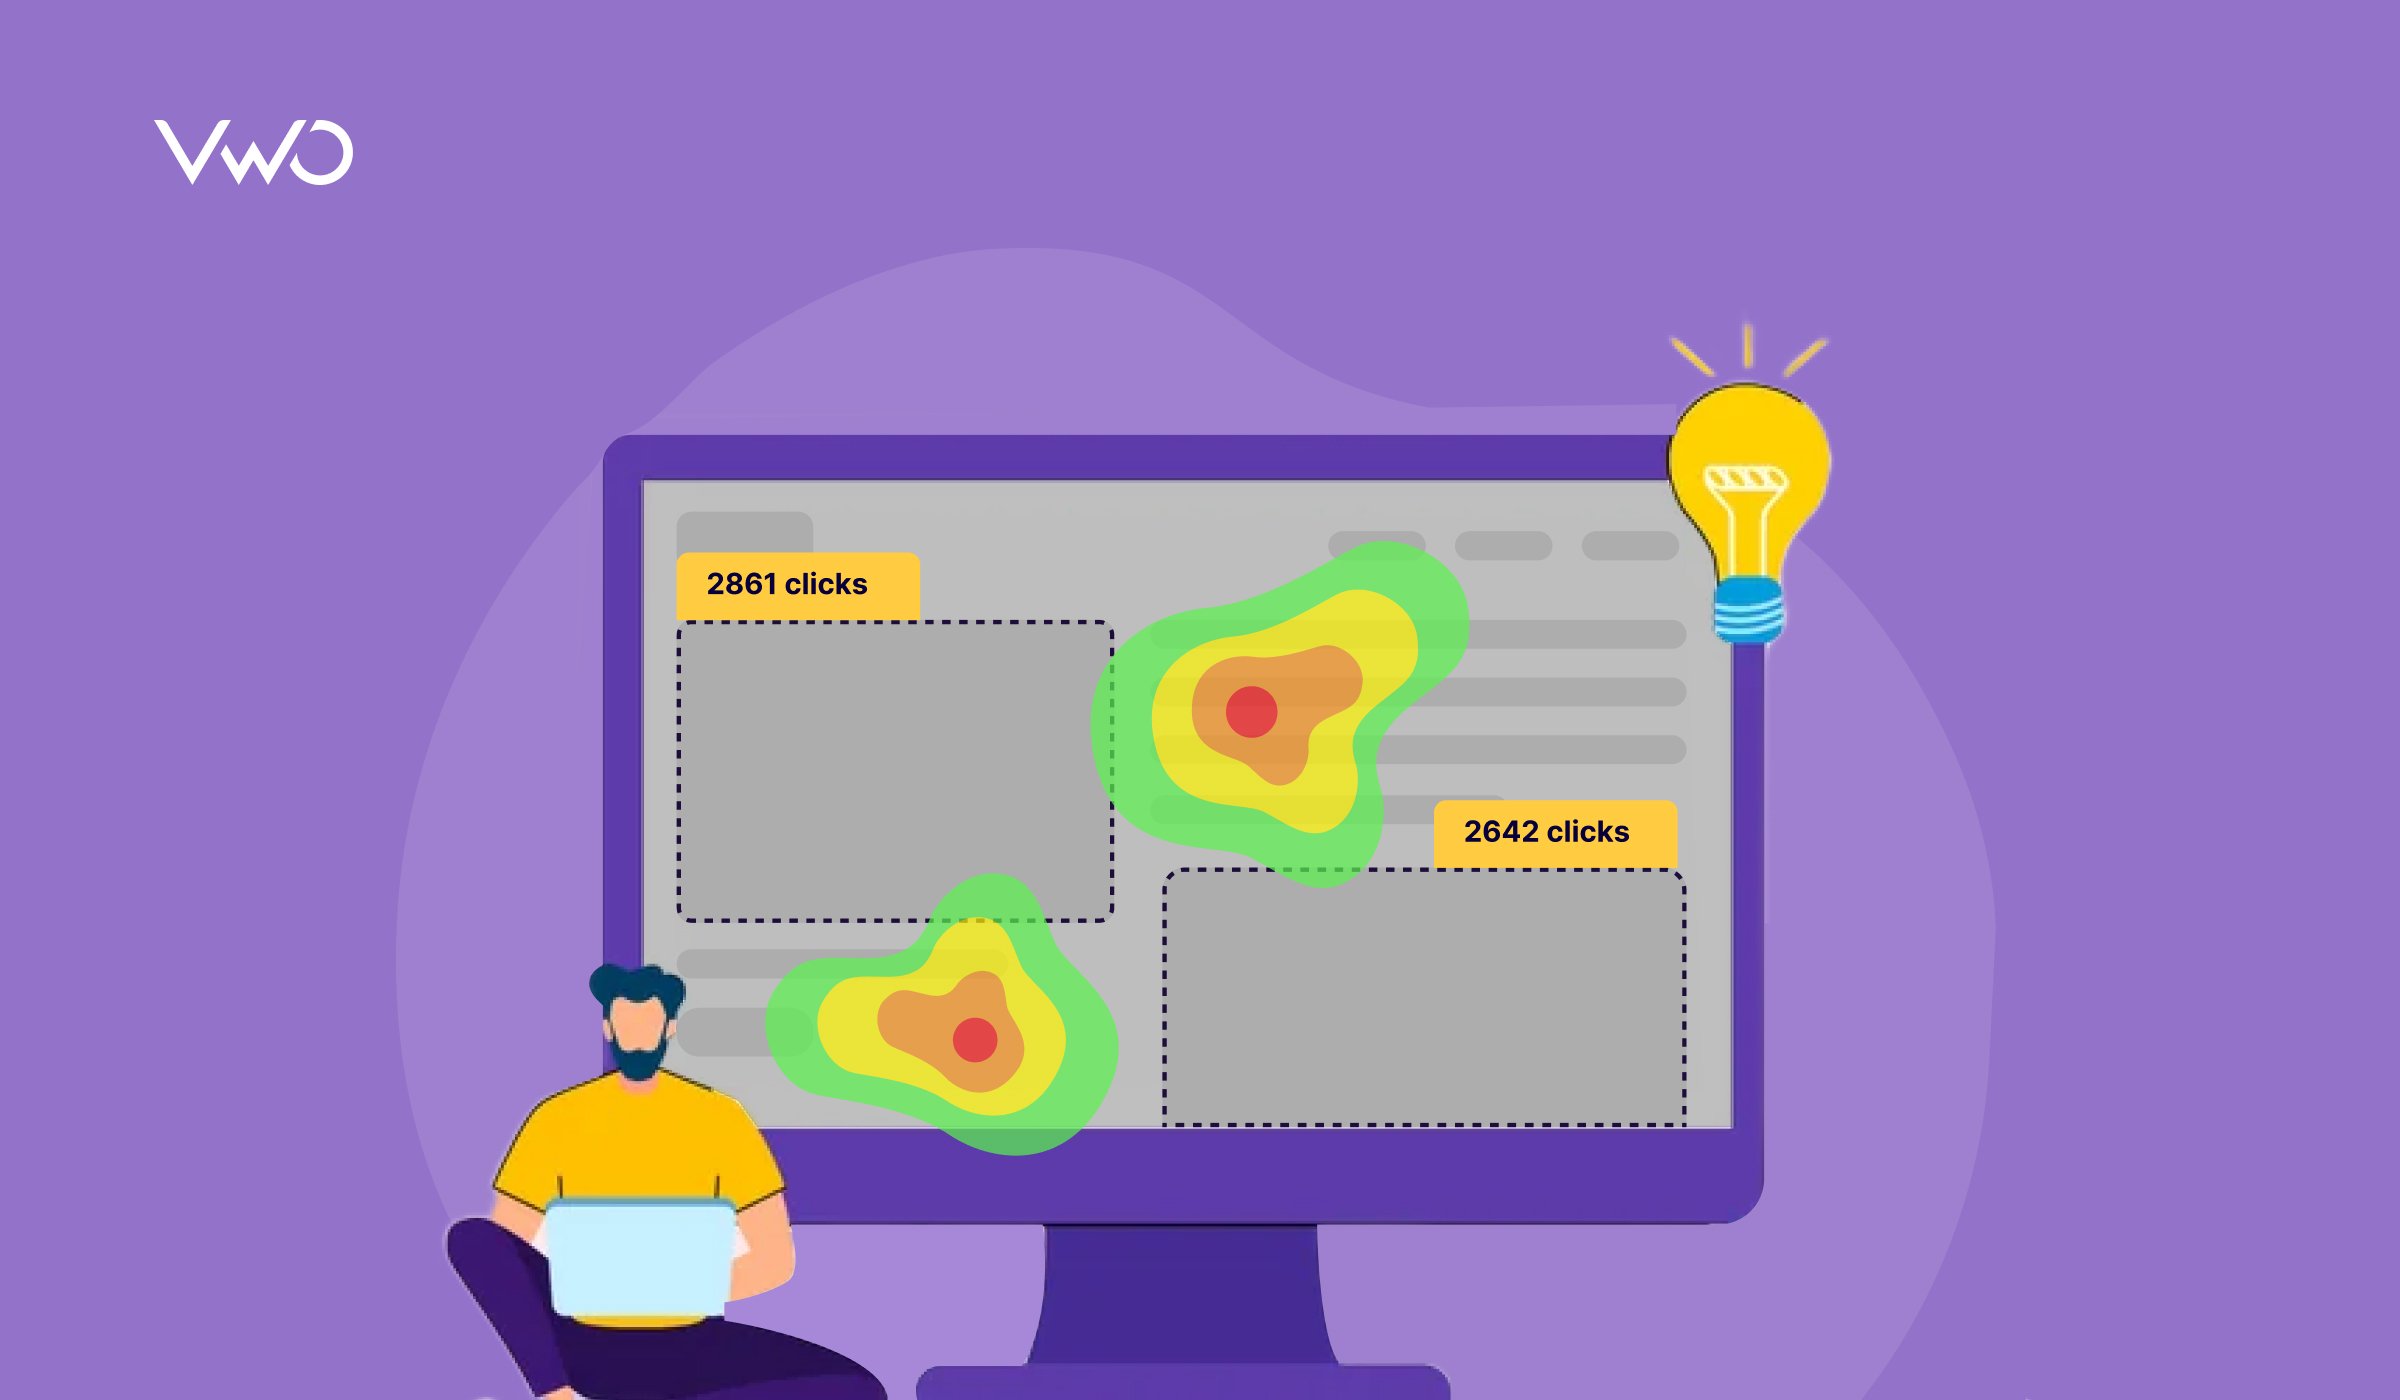
Clickmaps are a type of website heatmap specifically designed to show where users have clicked on a page. This visual tool allows you to see which elements on your site are attracting the most attention and which are being ignored.
You gain insights into visitor behavior and preferences by analyzing the areas with high and low click activity, represented in warm and cool colors. This data is crucial for identifying navigational issues, enhancing user interface design, and, ultimately, improving the effectiveness of your website.
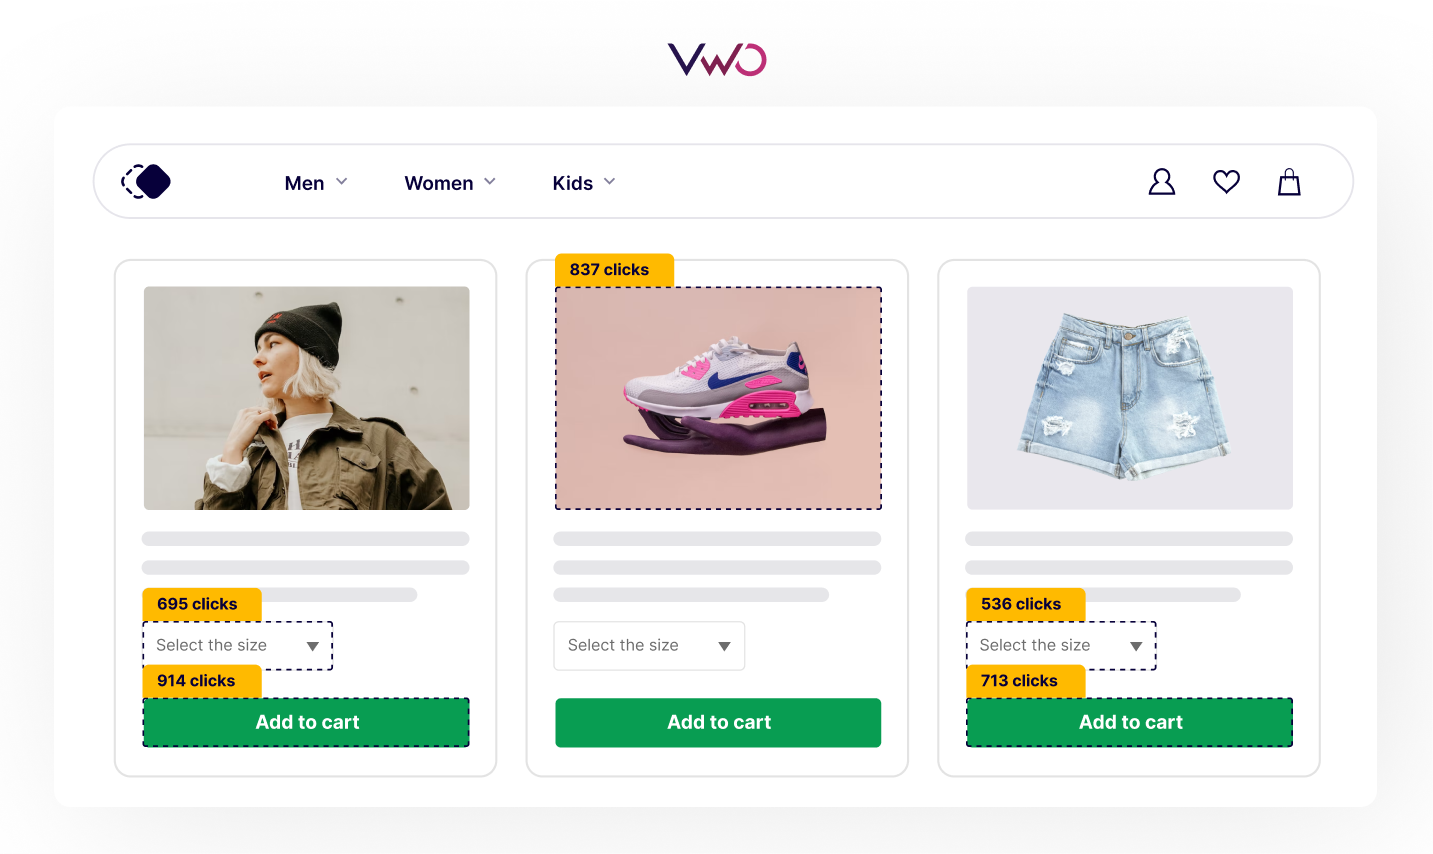
For example, a clickmap on a new eCommerce site might reveal that users frequently click product images but rarely interact with “Add to Cart” buttons. This insight could prompt you to redesign the buttons to be more prominent and compelling, potentially boosting conversions.
Download Free: Website Heatmap Guide
Clickmaps vs heatmaps
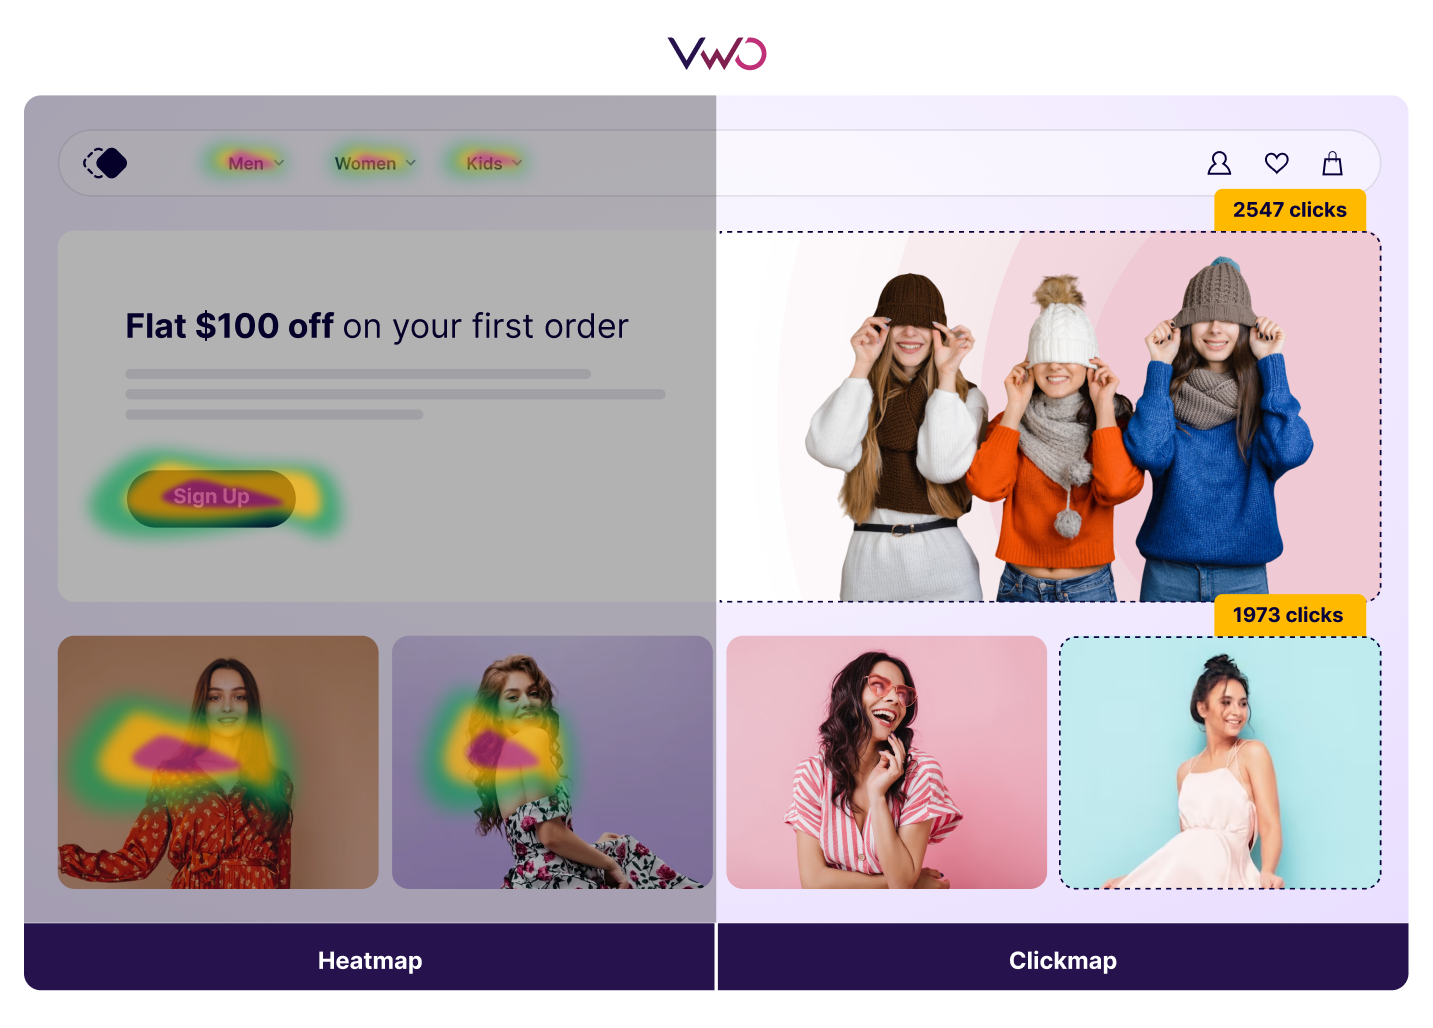
While clickmaps and heatmaps are often mentioned in the same breath, they are distinct tools with unique features and applications. Understanding the difference between these visualization methods is crucial for effectively leveraging them in your web analytics strategy.
Clickmaps
- Focus specifically on click events
- Show exact click locations as individual data points
- Often use color coding to indicate click frequency
- Provide precise data on which page elements users engage with
Heatmaps
- Can visualize various types of user interactions (clicks, mouse movement, scrolling)
- Use color gradients to show areas of high and low activity
- Offer a broader view of overall user engagement across the page
- Can include data from non-click interactions like hover events
Both tools have their place in a comprehensive web analytics strategy. Clickmaps excel at pinpointing specific interaction points, while heatmaps provide a more holistic view of user engagement across web pages.
For instance, on a news website homepage, a clickmap might reveal frequent clicks on headline links and the search bar and fewer clicks on sidebar elements. In contrast, a heatmap may provide an overall sense of visitor engagement without showing precise clicks.
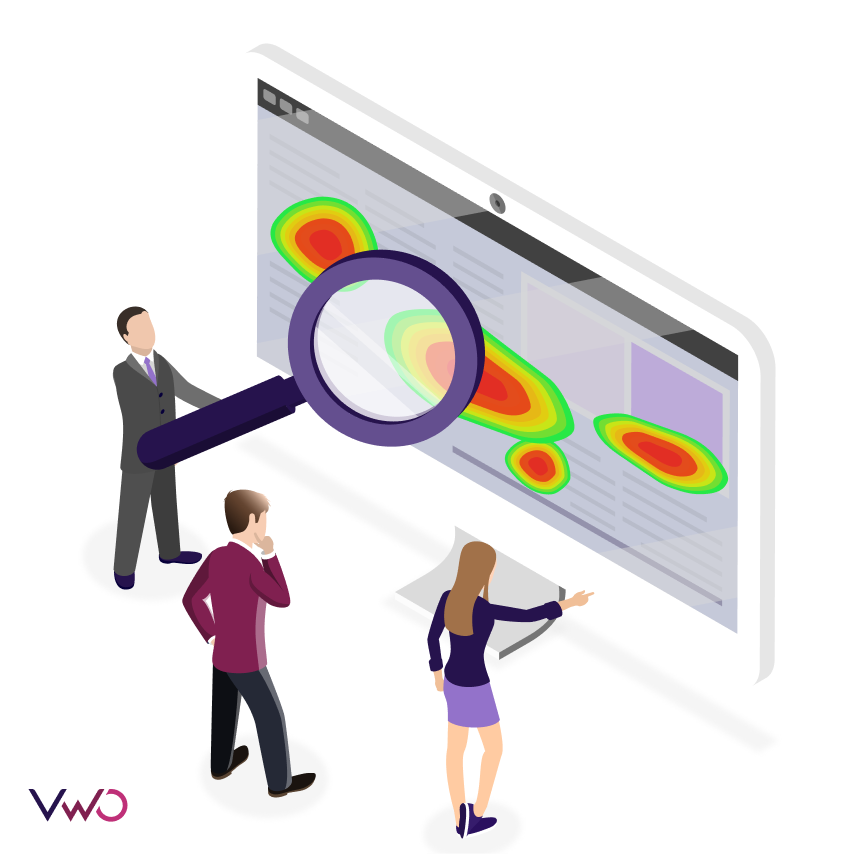
Benefits of using clickmaps
Clickmaps present numerous benefits for technical, marketing, and digital experience teams striving to enhance the customer journey. They deliver a vital layer of customer engagement insights that surpass the capabilities of other heatmaps, offering unparalleled business intelligence. Here are some key benefits:
1. Identify high engagement areas
Clickmaps highlight the sections of your website that receive the most user interaction. By identifying these high-engagement areas, you can understand which content, buttons, or links most appeal to your visitors.
2. Optimize page layout
By analyzing click distribution, you can rearrange elements on your page to improve visibility and accessibility. Placing important elements like call-to-action buttons or key information in areas with higher click rates can boost engagement and conversions.
3. Enhance call-to-action (CTA) performance
Monitor interactions with CTAs to assess their effectiveness. If a CTA is not receiving enough clicks, you may need to adjust its placement, design, or wording to make it more appealing and visible.
4. Detect usability issues
Clickmaps can identify areas where users click on non-interactive elements out of confusion or frustration. This information can help you address usability issues and improve the overall user experience.
5. A/B testing insights
Clickmaps provide data that can be used to formulate hypotheses for A/B testing. Understanding user behavior allows you to design more effective tests and make data-driven decisions to optimize your website.
6. Mobile optimization
Analyzing how click patterns differ between desktop and mobile users to optimize your site for mobile devices, ensuring a seamless experience across all platforms.
7. Reduce bounce rates
Identifying low-engagement areas can help you understand why users leave your site. Addressing these issues can keep visitors on your site longer and reduce bounce rates.
8. Validate design changes
Before and after implementing design changes, use clickmaps to compare user interactions. This validation process ensures your changes have the desired effect and improve the user experience.
9. Enhance content strategy
Clickmaps can show which types of content are most engaging to your audience. Use this information to refine your content strategy, focusing on topics and formats that resonate with your visitors.
10. Simplify communication with stakeholders
Clickmaps offer a clear visual representation that can be easily understood and shared with stakeholders, regardless of their technical expertise.
For example, an online retailer might use clickmaps to discover that users frequently click on product images, expecting them to enlarge. This insight could lead to the implementation of a zoom feature, enhancing the shopping experience and potentially increasing conversions.
Key metrics and data captured by clickmaps
Clickmaps provide invaluable metrics that help you understand user behavior on your website. By analyzing these metrics, you can identify what attracts users’ attention and what might be causing them frustration. Here are some of the key metrics captured by clickmaps:
Conversion clicks
Conversion clicks lead users towards completing a goal on your site, such as signing up, purchasing, or filling out a form. These clicks are critical as they directly relate to the effectiveness of your call-to-action (CTA) placements and overall website design. You can optimize your site by analyzing these clicks to enhance the user journey and increase conversion rates.
Rage clicks
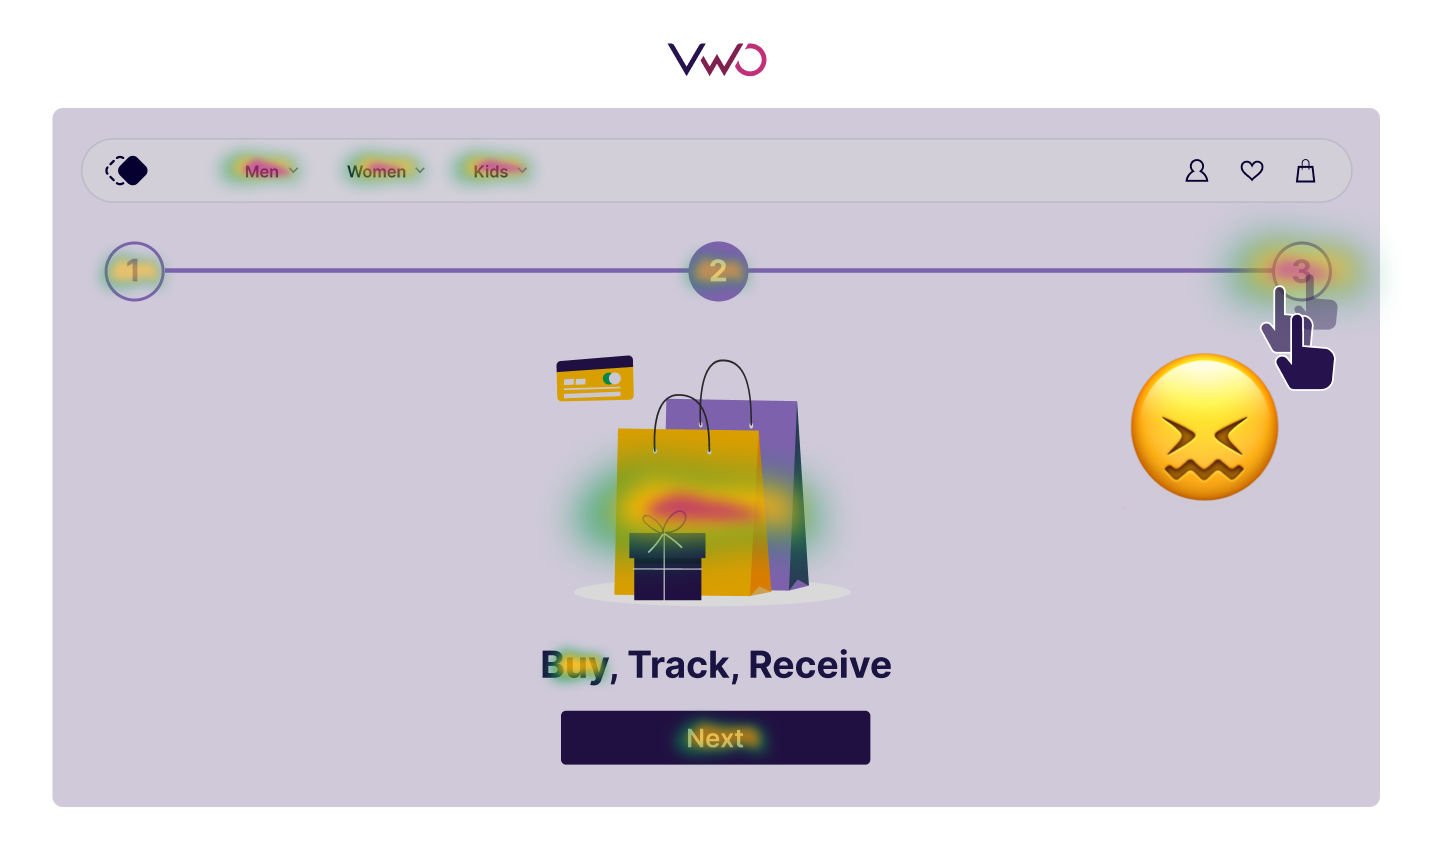
Rage clicks occur when frustrated users repeatedly click on an element. This usually happens when something on the page is not working as expected or the user perceives that it should behave differently. Tracking these clicks can reveal significant insights into user experience issues and help you identify areas where your website may need improvements to make it more intuitive and user-friendly.
Error clicks
Error clicks are interactions that result in errors, such as JavaScript failures or broken links. These clicks are necessary to monitor because they directly impact the user experience by interrupting their journey on your site. By identifying and resolving these issues, you can prevent frustration and ensure a smoother experience for your website visitors.
Dead clicks

Dead clicks are clicks that have no effect—such as clicking on a non-interactive image or whitespace. These clicks often indicate a misunderstanding of the page layout or elements that users mistakenly believe should provide interaction. Monitoring dead clicks can help you understand if certain items on your page are misleading users, allowing you to make necessary adjustments to your design.
Analyzing these metrics can reveal key insights into user behavior, highlighting opportunities to enhance your site’s interface and experience. This data-driven approach can boost user satisfaction and drive higher conversion rates.
How to read a clickmap?
Reading clickmaps varies between tools because each has unique features. On our platform, VWO, it’s straightforward. You can switch from heatmaps to clickmaps with one click and see the number of clicks on each element by hovering over them. Our ‘Click Area’ feature lets you compare clicks between different areas. The Element List provides a tabular view of the clickmap, offering a detailed breakdown of user engagement for each page element. All these features make interpreting clickmaps intuitive and self-explanatory, providing easy access to all click-related data.
Here are further steps to read clickmap data effectively, providing in-depth analysis and insights:
1. Identify click hotspots
Look for areas with the highest concentration of clicks in your heatmaps. These are your most engaging components.
2. Analyze click distribution
Switching to clickmaps, observe how clicks are spread across the page. Are the clicks scattered or concentrated in specific areas?
3. Compare to page goals
Assess whether the most-clicked elements align with your page objectives. Are users clicking key CTAs and important content?
4. Look for unexpected patterns
Pay attention to clicks on non-interactive items or areas with surprisingly low click rates.
5. Consider the context
Interpret clicks in relation to the page layout and content. A high click rate is only sometimes positive if it distracts from the main conversion goals.
6. Compare across devices
Analyze how click patterns differ between desktop and mobile versions of your site.
7. Examine click sequence
If available, look at the order in which elements are typically clicked to understand user journeys.
8. Check for missed opportunities
Identify important sections with low click rates that need optimization.
9. Cross-reference with other data
Combine clickmap insights with other analytics data for a more comprehensive understanding.
Download and share clickmaps from VWO to uncover more insights and explore optimization opportunities with your teammates.
How to use clickmaps?
Clickmaps are indispensable for optimizing your website’s visitor experience and conversion rates. You can uncover insights that drive strategic changes and enhance site performance by analyzing where users are clicking. Below, explore how to leverage clickmaps through A/B testing, usability testing, and conversion rate optimization (CRO).
A/B testing
A/B testing is a powerful method to test changes to your website against the current design to see which performs better. Using clickmaps, you can identify areas where users frequently interact and test variations of these components to determine which version achieves the highest engagement or conversion rate.
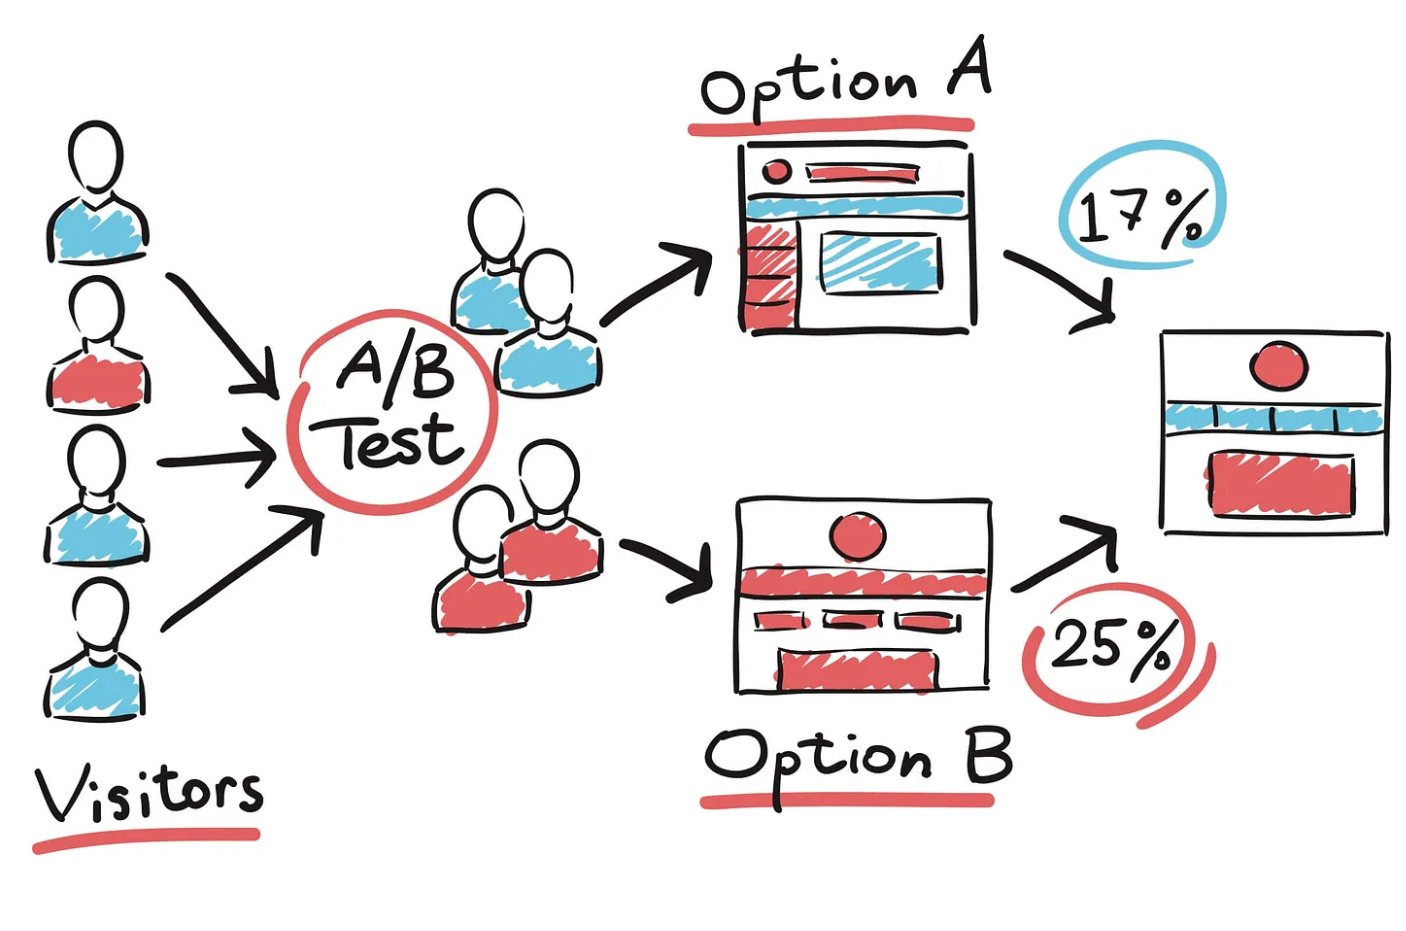
For instance, if you notice that a “Buy Now” button receives many clicks, you might test different colors, positions, or sizes to see which maximizes conversions. Remember, it’s essential to define clear conversion goals at the start of your A/B testing to measure the effectiveness of the changes accurately.
Usability testing
Clickmaps enhance usability testing by revealing user friction points and unexpected behaviors. You can spot design flaws and improve website navigability by identifying where users click, including non-interactive elements. Combining clickmaps with session replays offers deeper insights into user interactions, guiding targeted enhancements.
Conversion rate optimization
Conversion rate optimization (CRO) involves making informed decisions based on data to enhance your website’s user journey. clickmaps
contribute by showing which on-page elements drive conversions and which may cause users to drop off.
For instance, test new placements or wording if your clickmap reveals little interaction with the main CTA. Feedback tools triggered by user interactions can provide deeper insights into preferences and guide targeted optimizations.
Advanced clickmap tools offer various heatmap types, including attention and geo heatmaps. These provide insights into how different demographic segments interact with your site, enabling targeted optimizations for specific user groups.
Regular analysis of clickmap data drives continuous website optimization, improving usability and conversion rates over time.
Practical applications of clickmaps
Clickmaps have proven instrumental in ROI tracking, providing clear metrics on the return for every dollar invested in advertising campaigns. They are easy to implement into existing digital infrastructures, making them an accessible tool for businesses of all sizes.
Clickmaps have found valuable applications across diverse industries, helping businesses optimize their digital strategies. Here’s how different sectors leverage this powerful tool:
E-commerce
Online retailers use clickmaps to optimize product page layouts, improve category navigation, and enhance checkout processes. For example, clothing retailers might use clickmaps’s insights to determine the most effective placement of size charts or “Add to Cart” buttons based on how visitors interact with these elements.
Media and publishing
News websites and digital magazines utilize clickmaps to understand which headlines, images, or article placements attract the most attention. This insight helps in content prioritization and layout optimization to maximize reader engagement.
Travel and hospitality
Hotels and travel booking sites employ clickmaps to improve the booking process. They can identify which room features or travel package elements users click on most, helping to refine offerings and improve conversion rates.
Financial services
Banks and investment firms use clickmaps to streamline complex processes like loan applications or account openings. By analyzing user interactions, they can simplify forms and improve the placement of important information.
Healthcare
Medical websites leverage clickmaps to ensure critical information is easily accessible. They can optimize the placement of appointment booking buttons or prioritize the most sought-after health information based on user clicks.
Education
eLearning platforms use clickmaps to enhance course navigation and improve student engagement. They can identify which learning resources are most accessible and optimize the placement of quizzes or discussion forums.
Software as a Service (SaaS)
SaaS companies utilize clickmaps to refine their product pages and improve user onboarding. They can optimize feature highlights and call-to-action placements to boost trial sign-ups or conversions.
Success stories with VWO Insights
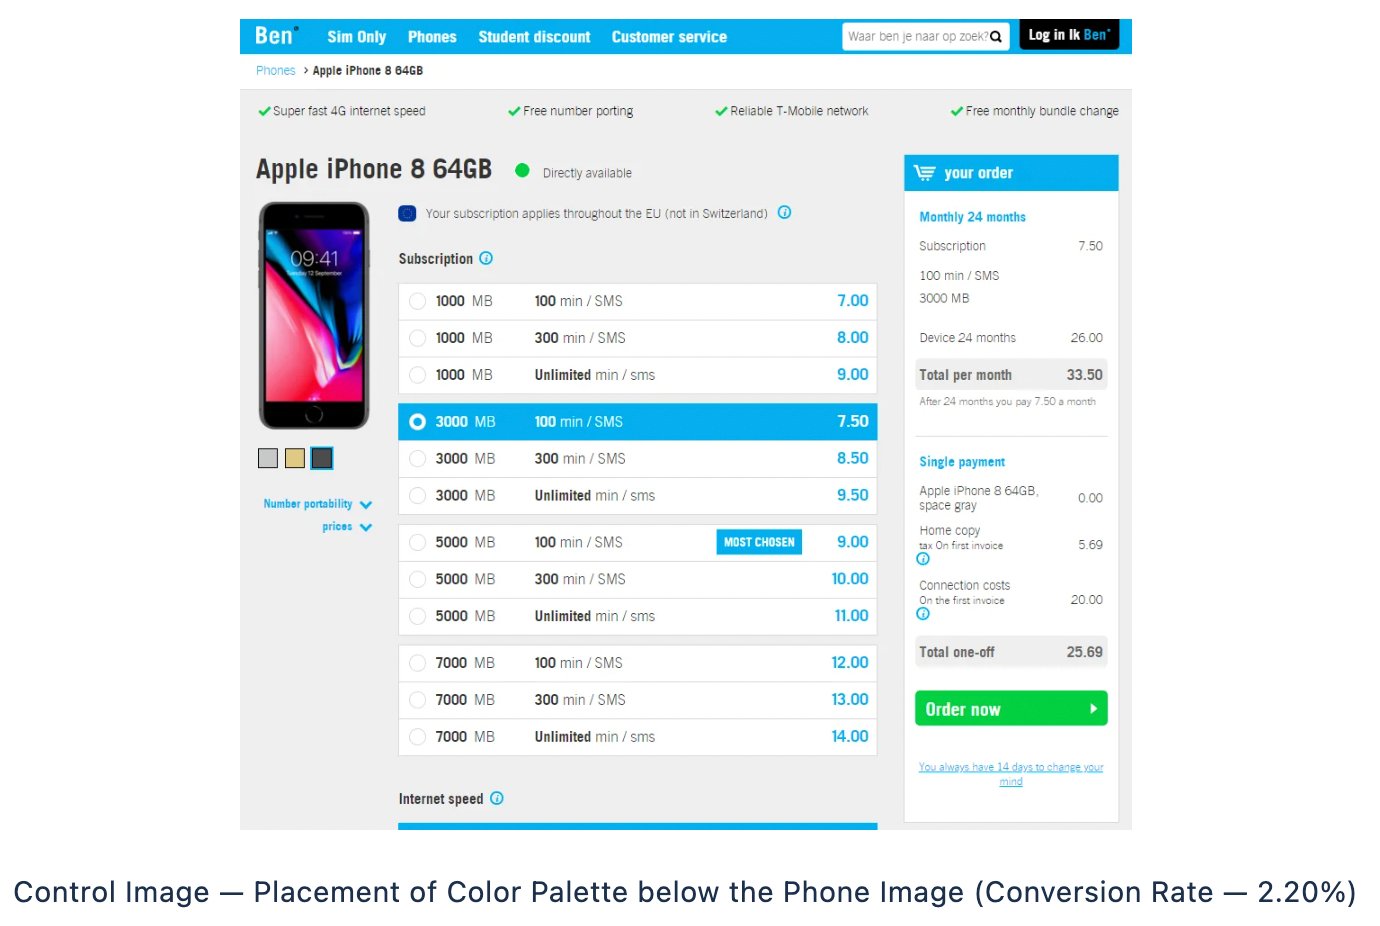
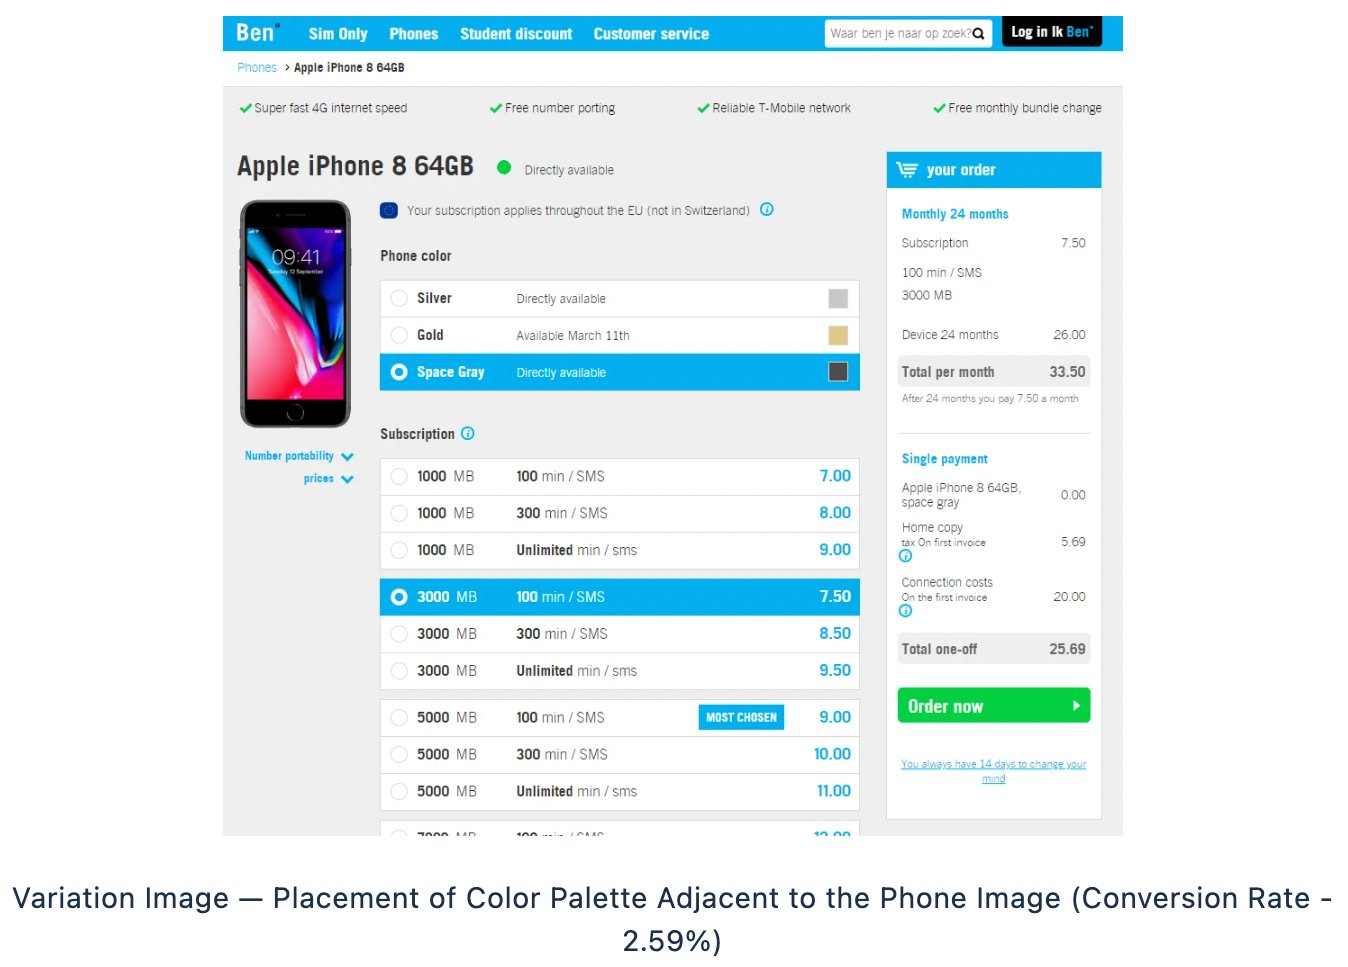
Ben NL saw a 17.63% increase in conversions
Company: Ben NL is a prominent player in the Dutch telecom market. It offers competitive sim-only and mobile phone subscription plans that maximize customer budget value.
Objective: Ben aimed to enhance customer experience on their product pages by making the phone color palette more prominent and intuitive. This aimed to reduce customer confusion and increase direct online conversions without needing post-order customer service calls.
Research-driven changes: Partnering with the consultancy agency de Nieuwe Zaak, Ben utilized VWO’s tools like heatmaps and clickmaps to analyze visitor interactions and identify drop-off points, particularly around the color palette section. They redesigned the product page, moving the color palette next to the phone image for clearer visibility and functionality.
Results: The A/B test, conducted over two weeks with 40,347 users, significantly improved. The variation, with the color palette adjacent to the phone image, increased conversions by 17.63%. This adjustment improved understanding of the palette’s purpose and reduced customer support inquiries regarding color changes post-purchase. Read the full success story for more insights.
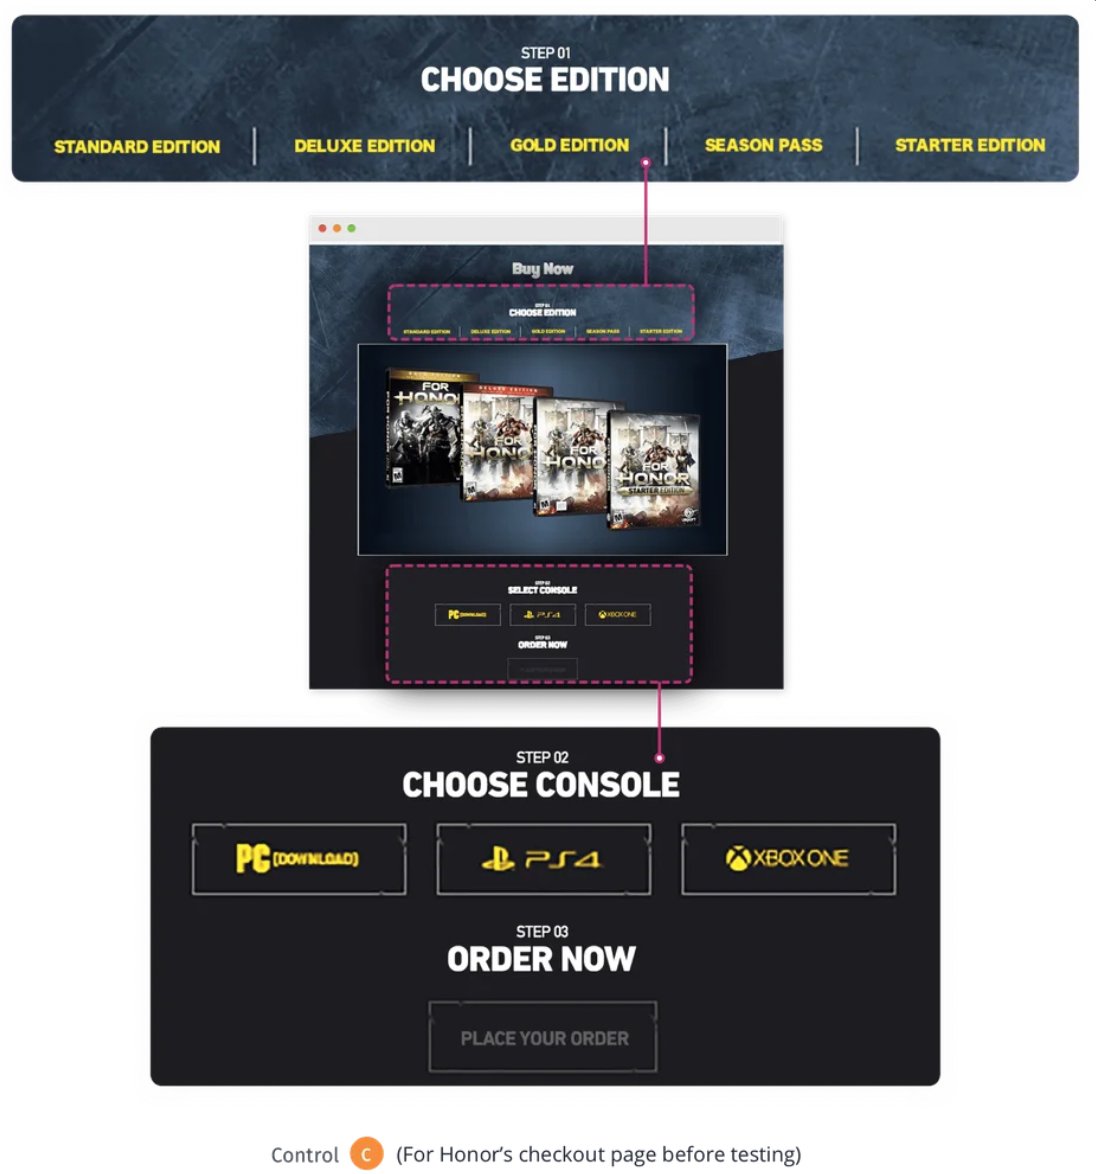
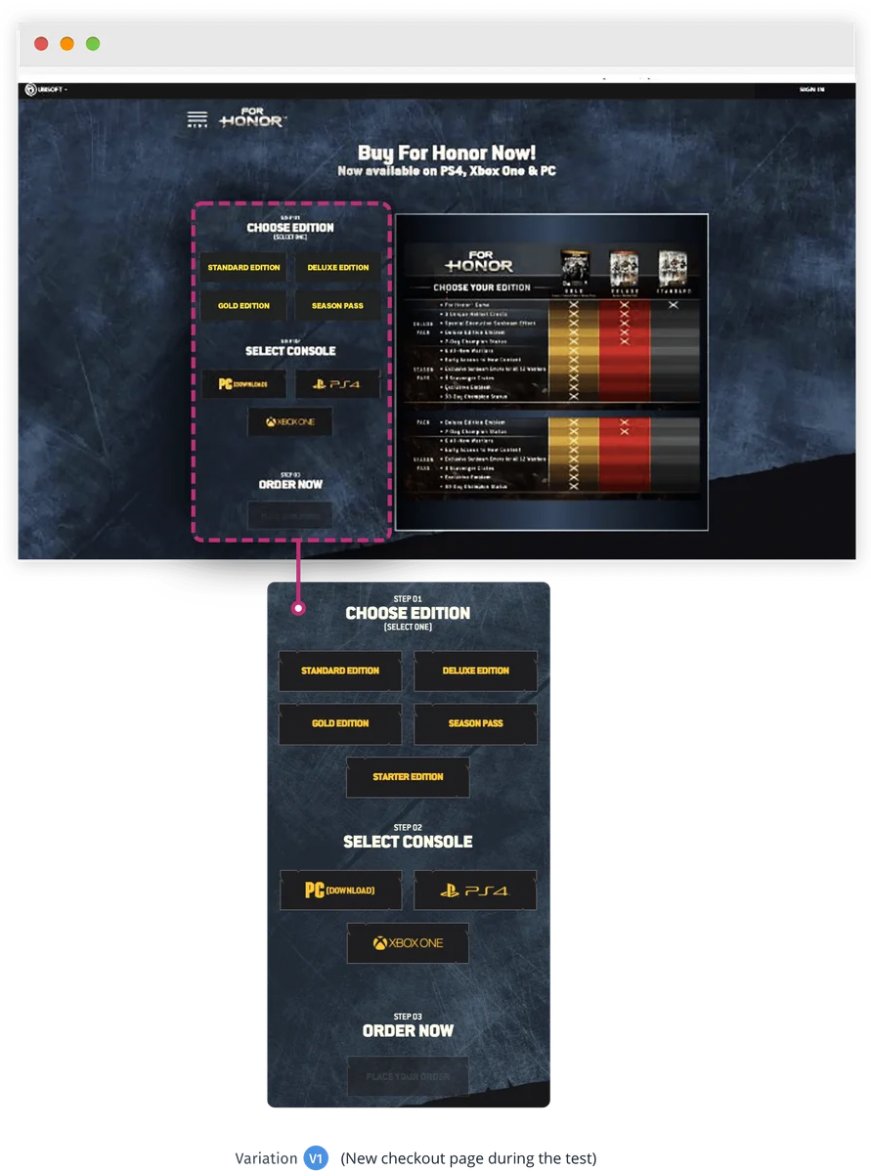
Ubisoft increased its lead generation by 12%
Company: Ubisoft Entertainment, based in Paris, France, is a prominent video game publisher known for franchises like Assassin’s Creed and Far Cry. It operates globally and has over 13,000 employees.
Objective: Ubisoft sought to enhance lead generation on the Buy Now page for its game For Honor by improving user experience and conversion rates.
Research-driven changes: Using VWO’s tools (heatmaps, scroll maps, clickmaps, and on-page surveys), Ubisoft analyzed visitor behavior to streamline the purchasing process and reduce scrolling on the Buy Now page. During the holiday season, the team redesigned the Buy Now page, relocating key elements to improve accessibility.
Results: This improvement increased lead generation and conversions by 12%, from 38% to 50%. Check out the detailed success story for additional perspectives.
Clickmap analysis – best practices
Interpreting clickmaps effectively is more than just observing colorful patterns—it’s about extracting meaningful insights to drive real improvements to your website. While clickmaps provide valuable data, turning that information into actionable strategies requires a thoughtful, systematic approach. Follow the below best practices to transform raw click data into a powerful catalyst for website optimization and user experience enhancement:
Pick the optimal tool
Choose a clickmap solution that aligns with your digital experience (DX) requirements. Opt for tools that offer more than just aggregate data, allowing you to see individual user experiences and integrate with session replay functionality. For instance, VWO Insights goes beyond heatmaps to include session recordings and form analytics, offering a complete picture of user behavior.
Integrate with other tools
Combine clickmap data with analytics tools such as session replay, on-page surveys, and other heatmap types (scroll maps, attention maps) for a comprehensive view of user behavior.
Tap into digital experience intelligence (DXI)
Utilize DXI platforms to gain a 360-degree view of the customer journey. This approach helps uncover customer behavior and the underlying reasons driving it.
Pair with user testing
Supplementing clickmap data with user testing provides a more granular view of the user journey by combining quantitative insights from clickmaps with qualitative feedback from real users, effectively optimizing website performance.
Analyze across devices
Consider desktop and mobile users in your click heatmap analysis to ensure comprehensive device coverage.
Examine user journeys comprehensively
Assess how users navigate between pages and interact on each, pinpointing and resolving potential bottlenecks to streamline the user experience.
Segment your analysis
Break down clickmap data by visitor segments, traffic sources, and demographics for more nuanced insights.
Iterate and test
Use clickmap insights to form hypotheses, then validate them through A/B testing. Continuously refine your site based on these results.
Monitor trends over time
Don’t rely on a single snapshot. Track click patterns over time to identify trends and measure the impact of site changes.
Focus on actionable insights
Remember, the goal is not just data collection but driving tangible improvements. Prioritize insights that align with key business objectives and lead to enhanced user experiences.
VWO clickmaps – at a glance
VWO excels in conversion optimization with its advanced clickmap solution. This robust tool seamlessly integrates into websites, providing real-time insights across various devices. VWO’s clickmaps offer interactive visualizations, sophisticated segmentation options, and historical data analysis, empowering marketers to uncover intricate user behaviors. When combined with VWO’s other behavioral analytics tools, experimentation capabilities, and personalization features, they offer a comprehensive approach to enhancing user experience and boosting conversion rates.
Experience the benefits firsthand – take a free trial today!
FAQs
A click heatmap (aka clickmap) is a type of heatmap that provides a visual representation of where users click on a webpage, using color coding to show the frequency of clicks in different areas. Click heatmaps help businesses understand user behavior, identify popular web page areas, and optimize layout and content to improve user experience and conversion rates.
While both visualize user interactions, a clickmap specifically shows individual click locations, often as dots or circles, offering richer insights and granular data. A heatmap uses color gradients to represent interaction intensity across the entire page, including clicks, mouse movements, and scrolling behavior.
Clickmaps collect data on user clicks through JavaScript code embedded in your website. This code tracks the coordinates of each click, along with other relevant data like the clicked element and timestamp. The collected data is then processed and overlaid on an image of your webpage, creating a visual representation of click activity.
A clickmap provides insights into:
a. Which on-page elements are attracting the most attention.
b. How users navigate through your site.
c. Which calls-to-action are most effective.
d. Areas of potential confusion or frustration (e.g., non-clickable items receiving many clicks).
e. The effectiveness of your page layout and content hierarchy.
f. Differences in user behavior across devices.
Key benefits include:
a. Improved user experience through data-driven design decisions.
b. Increased conversion rates by optimizing the placement of key features.
c. Better understanding of user intent and behavior.
d. Detect and resolve bugs, broken links, and other usability issues.
e. Informed A/B testing hypotheses.
f. Enhanced content strategy based on user engagement patterns.
g. Present UX insights visually, making them easily understandable for non-technical team members.
Use clickmap results to:
a. Optimize element placement by leveraging high-click areas.
b. Address design and layout issues to enhance usability.
c. Streamline navigation pathways for improved user experience.
d. Validate changes through A/B testing informed by clickmap insights.
e. Monitor performance trends to sustain ongoing optimization efforts.
To track clicks on your website, utilize a dedicated tracking tool such as VWO, Hotjar, Crazy Egg, Google Analytics, etc. These tools provide comprehensive click-tracking features by simply adding a small piece of JavaScript code to your website. Once installed, they automatically collect click data and present it in easy-to-understand visual formats, allowing you to analyze how users engage and make informed design decisions.
You can determine if someone has clicked on your link by using various tracking methods:
Google Analytics event tracking: Set up event tracking in Google Analytics to monitor clicks on specific links. You must add JavaScript code to your links or use Google Tag Manager for easier management.
URL shorteners: Use URL shortening services like Bitly or TinyURL, which often provide click-tracking statistics to see how often your link has been clicked.
Link tracking tools: Utilize specialized link tracking tools such as ClickMeter, LinkTrackr, or similar services. These tools generate unique tracking links that record click data and provide analytics on link performance.
Email marketing platforms: If the link was included in an email campaign, email marketing platforms like Mailchimp or Constant Contact usually offer click-tracking features to monitor link engagement.
Server-side tracking: Analyze server logs or use server-side scripts to track clicks on links directly from your web server. This method is more technical and requires access to server logs for analysis.


