
What is variance?
Variance measures the spread of a dataset by quantifying how much a set of values differs from the mean. A higher variance indicates a more spread-out dataset, while a lower variance indicates values are closer to the mean.
Variance helps in understanding the consistency of the dataset and its spread, which helps in making better decisions.
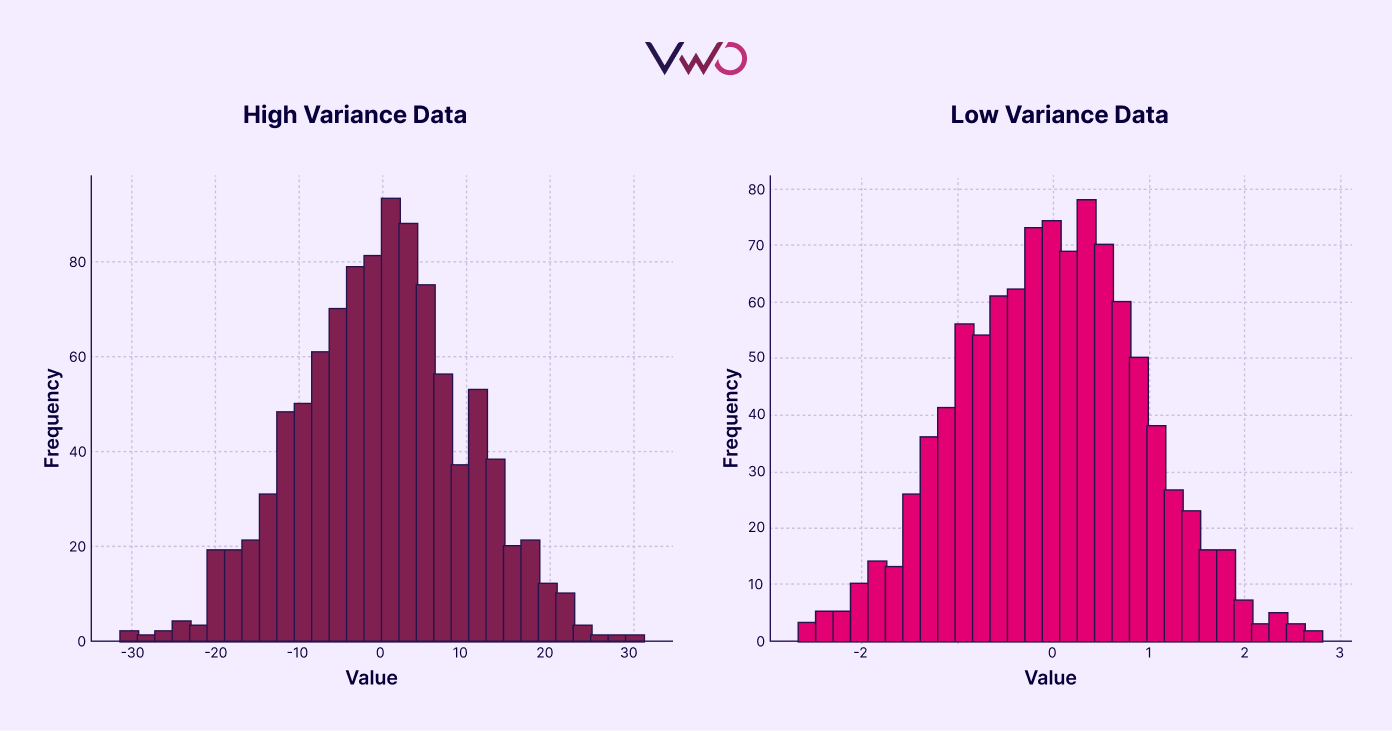
Here are simple images that explain dataset variance:
The left graph shows a high-variance dataset with more erratic values. The right graph illustrates a low-variance data set where the values are more consistent.
How do we calculate variance?
To calculate the variance in a sample, you start by subtracting each value from the mean and then squaring the result. This process is repeated for all values in the data set. Next, you sum all these squared differences. Finally, you divide this sum by the number of values in the data set minus one. The square root of the result is the variance of the sample.
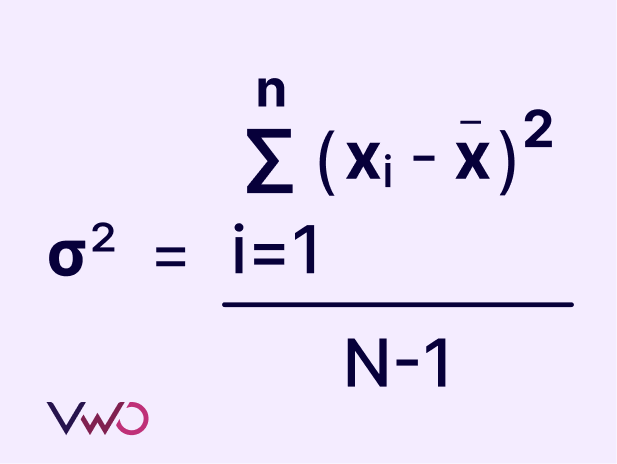
Where:
xi = Each value in the data set
x = Mean of all values in the data set
N = Number of values in the data set
The variance in a population is calculated slightly differently, the denominator changes from N – 1 to N.
Variance can be calculated in software like Google Sheets using various functions. Here’s a quick guide to the different variance functions:
- VAR.P: Calculates the variance for an entire population, using only numerical data.
- VAR.S: Calculates the variance for a sample, using only numerical data.
- VARA: Calculates the variance for a sample, including numerical values, text strings (treated as 0), and logical values (TRUE as 1, FALSE as 0).
- VARPA: Calculates the variance for an entire population, including numerical values, text strings (treated as 0), and logical values (TRUE as 1, FALSE as 0).
Use these functions depending on whether you are working with a sample or the entire population and whether your dataset includes mixed data types.
Variance in A/B testing
When conducting A/B testing, we compare the average of a metric (such as spending or conversion) between two distinct groups. We also use the standard error, which indicates how much the average conversion rate might vary if the experiment is repeated multiple times. It is calculated as the square root of the variance, so a higher variance results in a higher standard error. A higher standard error means more uncertainty in our estimate of the true conversion rate.
However, you can reduce the standard error using the following methods.
- One of the simplest ways to reduce standard error in A/B testing is by increasing the sample size, as a larger sample size tends to produce a distribution that closely resembles a normal distribution. However, practical constraints often prevent us from increasing the sample size.
- Splitting the sample size evenly between the control and variation groups (50-50%) in an A/B test can reduce the impact of variance in the dataset and help achieve statistical significance more quickly. An unequal sample size can increase the chances of variance in the sample size with a lower size.
- Normalizing outliers is another effective method to reduce standard error. For instance, when conducting an A/B test on a segment filtered by cost per head, you can improve the accuracy of your results by excluding customer data with exceptionally high or low costs per head.
- CUPED, or Controlled-experiment Using Pre-Existing Data, is another technique in A/B testing that uses data from before the experiment to account for natural variations in user behavior. This reduces the standard error in your results. By considering how users behave on your site beforehand (such as their usual spending habits), CUPED helps smooth out natural fluctuations in behavior, making it easier to see the true impact of your new layout.
Conclusion
Variance measures a dataset’s spread and influences statistical analysis’s accuracy. In A/B testing, reducing standard error by increasing sample size, equalizing sample distribution, and normalizing outliers can lead to more reliable and meaningful results. By grasping these concepts and applying appropriate techniques, we can enhance the accuracy and reliability of our data analysis and decision-making processes.


