
Follow us and stay on top of everything CRO
Read summarized version with
With the increasing volume of data available today, the ability to visualize and communicate complex datasets effectively has become invaluable. Among the various visualization techniques, heatmaps stand out as a powerful tool, capable of transforming vast arrays of numbers into visually striking and intuitive representations.
Whether you’re an analyst, researcher, or data enthusiast, here you’ll discover the true potential of heatmaps and learn how to harness their power like never before.
What is a heatmap?
A heatmap is a two-dimensional graphical representation of data depicting individual values by color. The color intensity varies according to the value, allowing for a quick visual summary of information.
A simple heatmap provides an immediate visual summary of information across two axes, allowing users to quickly grasp the most important or relevant data points. More elaborate heatmaps allow the viewer to understand complex data sets.
Heatmaps are particularly useful in fields that require large data analysis, such as data science, marketing, and UX design. They help in visualizing data distributions and identifying areas that need optimization.
Heatmaps: A historical context
The concept of heatmaps dates back to 1873 when French statistician Toussaint Loua used shaded maps to represent social statistics across Paris districts. Loua already used color conventions like today—dark grey and black for higher values and light colors like white and light grey for lower values.

However, the term “heatmap” wasn’t coined until the 1990s, when software designer Cormac Kinney created a tool to display real-time financial market information graphically.
Understanding heatmaps
The science behind heatmaps
Heatmaps are based on the principle of data aggregation and visual representation. They collect data on user interactions over a period of time and overlay this information on a visual representation of your website or app. The result is a color-coded map that immediately highlights patterns and trends in user behavior.
Components of a heatmap
- Color scale: Heatmaps leverage our brain’s ability to process and interpret color patterns. By representing data as a grid of colored cells, they enable quick recognition of relationships, correlations, and anomalies that might be difficult to discern from raw numbers alone.
- Data matrix: Heatmaps are constructed from matrices or tables of data, where each cell corresponds to a specific value or measurement. These values are mapped to a color scheme, with the color’s intensity or shade representing the value’s magnitude.
- Axes and labels: Axes and labels provide essential context, indicating what each row and column represents, such as time periods, geographical regions, or categories. This context is crucial for accurate data interpretation.
How heatmaps represent data
Heatmap visualizations use variations in color intensity to depict the distribution and concentration of data points. For instance, darker colors in a sales data heatmap might represent higher sales volumes, while lighter colors indicate lower sales. This visual approach helps users quickly identify trends, patterns, and outliers within the dataset, providing an intuitive understanding of the relative magnitudes and distributions at a glance.
Benefits of heatmaps
As a vital analytical resource, heatmaps offer multiple benefits, such as mentioned below:
Intuitive data representation
Heatmaps make complex data accessible to a wide audience, facilitating better team understanding.
Quick insight generation
Patterns and trends become immediately apparent, speeding up the analysis process.
Handling large datasets
Heatmaps can effectively visualize vast amounts of data in a compact format.
Identifying outliers
Anomalies in the data stand out visually, making spotting unusual patterns or potential errors easier.
Facilitating comparisons
Whether comparing different time periods, geographic regions, or variables, heatmaps make it easy to see differences and similarities.
Improved decision-making
Heatmaps highlight trends and patterns and support more informed, data-driven decisions.
Versatility
Heatmaps can be applied to various data types across various industries and disciplines.
Communication tool
They effectively present findings to stakeholders, bridging the gap between data analysts and decision-makers.
Time-saving
Heatmaps can quickly reveal insights that might take much longer to discern from raw data or traditional charts.
Pattern discovery
They can unveil unexpected patterns or correlations that might not be apparent in other forms of data visualization.
Types of heatmaps
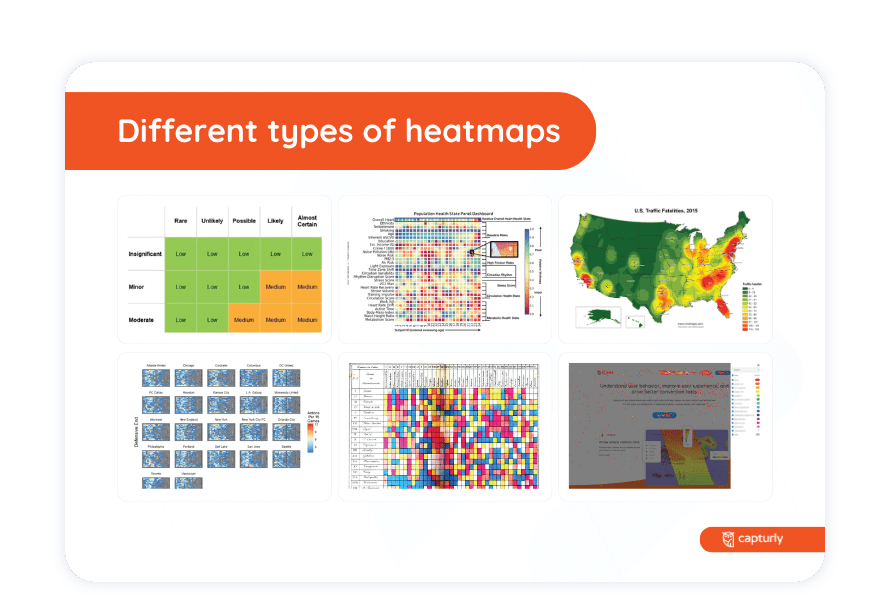
Different heatmaps cater to various data visualization needs, each offering unique insights. Knowing these types helps you select the most suitable one for your analysis.
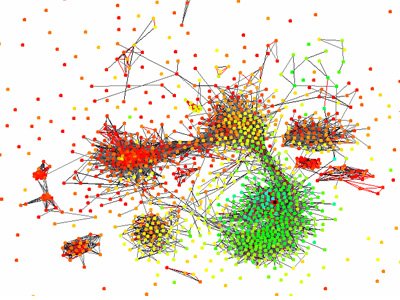
Clustered and hierarchical heatmaps
Clustered heatmaps group similar data points together, revealing underlying structures and hierarchies, while hierarchical heatmaps organize data into nested levels or categories.
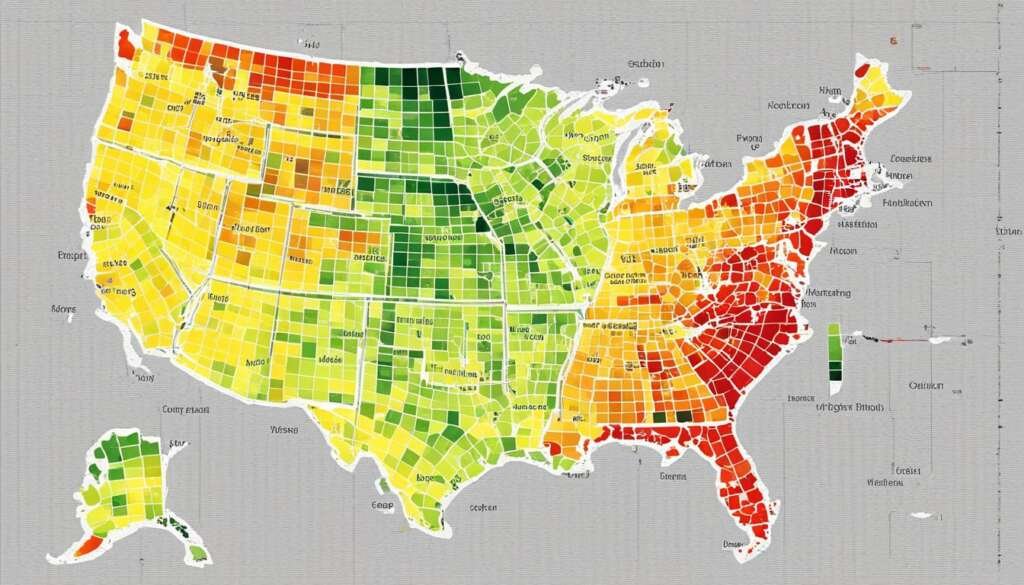
Spatial heatmaps
Spatial heatmaps represent data over geographical regions, such as population density maps or sales distribution across different areas. They are valuable for visualizing spatial data, allowing users to see geographic trends and patterns.
Interactive heatmaps
Interactive heatmaps allow users to explore data dynamically, zooming in and out or filtering specific regions of interest, providing a more engaging and immersive experience.
Time-series heatmaps
These heatmaps illustrate data changes over time, such as website traffic patterns throughout the day. By displaying data across time intervals, they help identify trends and fluctuations within the data.
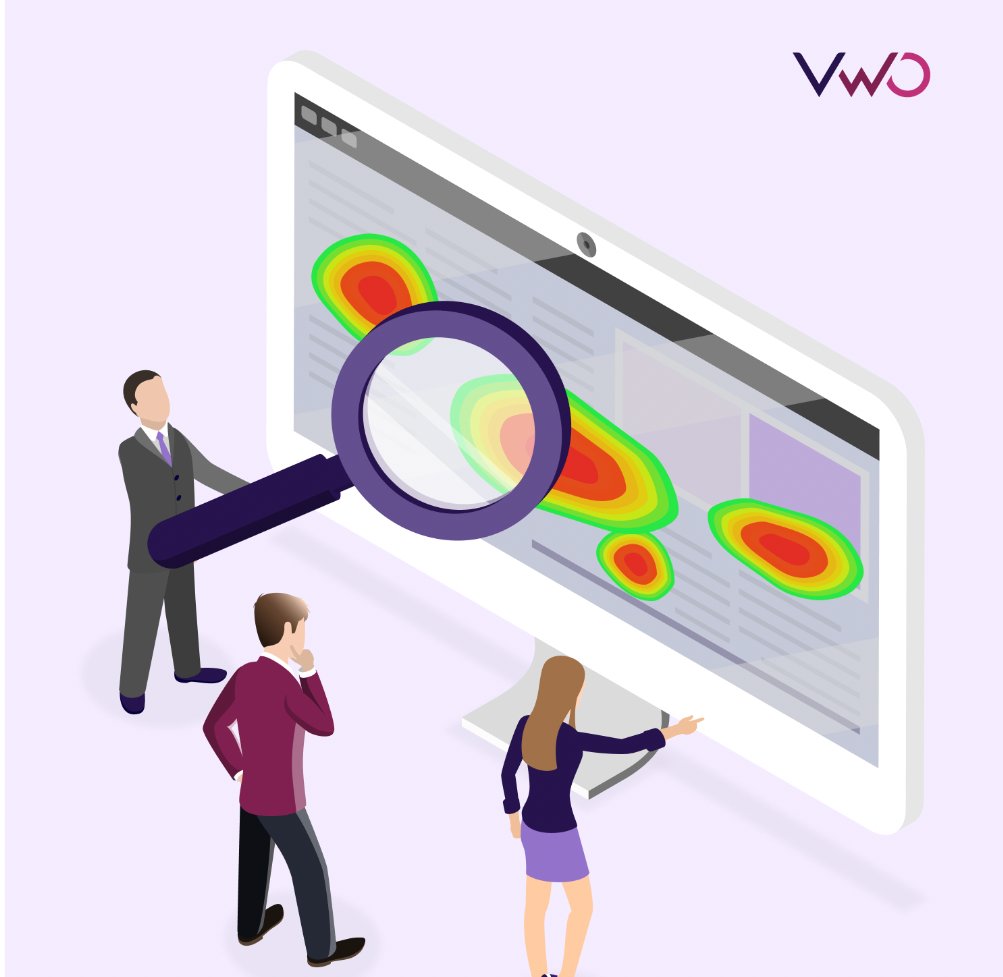
Behavioral heatmaps
Widely used in web analytics, behavioral heatmaps track website user interactions. Examples include click heatmaps, which show where users click the most, scroll heatmaps that indicate how far users scroll down a page, and mouse movement heatmaps that track where users move their cursor. These insights help optimize user experience and website design.
AI-generated heatmaps
Use machine learning to predict user focus, helping optimize element placement and improve user experience.
- Predictive insights: AI-generated heatmaps simulate the first few seconds of user attention to highlight the most and least viewed elements.
- Cost-effective: Offers up to 95% accuracy at a lower cost than traditional eye-tracking technology.
When (and why) should you use a heatmap?
Heatmaps have found widespread applications across numerous industries and domains, making them an indispensable tool for professionals in diverse fields.
Website analytics and user behavior
Website heatmaps reveal user behavior by highlighting where users click, tap, or pause scrolling. This information helps webmasters understand navigation patterns and time spent on a page. It also helps them make informed decisions about website optimization, aiming to lower bounce rates and boost conversions.
- Click analysis: Heatmaps show where users click the most, helping identify popular and effective elements on a webpage.
- Scroll depth: Heatmaps indicate how far users scroll down a page, providing insights into content engagement and optimal placement.
- Mouse movement tracking: These heatmaps track where users move their mouse, often correlating with eye movement, to understand navigation patterns and areas of interest.
- User Experience Optimization: Use heatmap insights to make strategic choices about website design and layout, enhancing user experience and increasing conversion rates.
Business intelligence and market research
Visualize customer groups based on behavior and preferences to optimize sales strategies by identifying top-performing products and regional trends.
- Customer segmentation: Marketing experts use heatmaps to visualize different customer groups based on behavior and preferences, aiding in targeted marketing strategies.
- Sales data analysis: Identify top-performing products and regions to optimize inventory and sales strategies.
Healthcare and scientific research
Heatmaps visualize gene expression data to understand gene behavior and disease mechanisms and track the geographic spread of diseases for public health planning.
- Gene expression analysis: Heatmaps help visualize complex biological data, aiding in understanding gene interactions and functions.
- Disease tracking: Geographic heatmaps can track the spread of diseases, helping in effective public health planning and response.
Finance and marketing
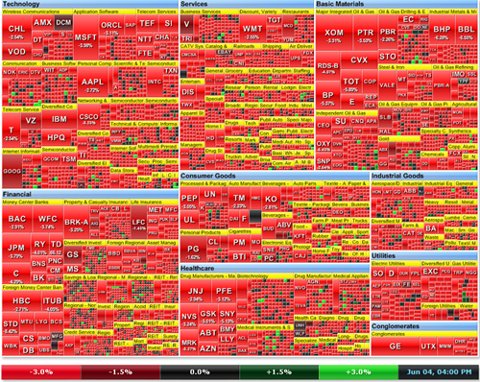
In finance, heatmaps are used to analyze stock market performance, portfolio risk, and trading patterns. Marketing experts leverage heatmaps to visualize customer segmentation, website traffic, and campaign effectiveness.
- Stock market analysis: Heatmaps help visualize stock market performance, providing insights into the relative performance of different stocks or sectors.
- Portfolio risk assessment: Heatmaps allow for assessing portfolio risk by highlighting areas of high and low risk within an investment portfolio.
- Campaign effectiveness: Heatmaps help track website traffic and campaign performance, identifying the most effective marketing strategies.
Sports analytics and logistics
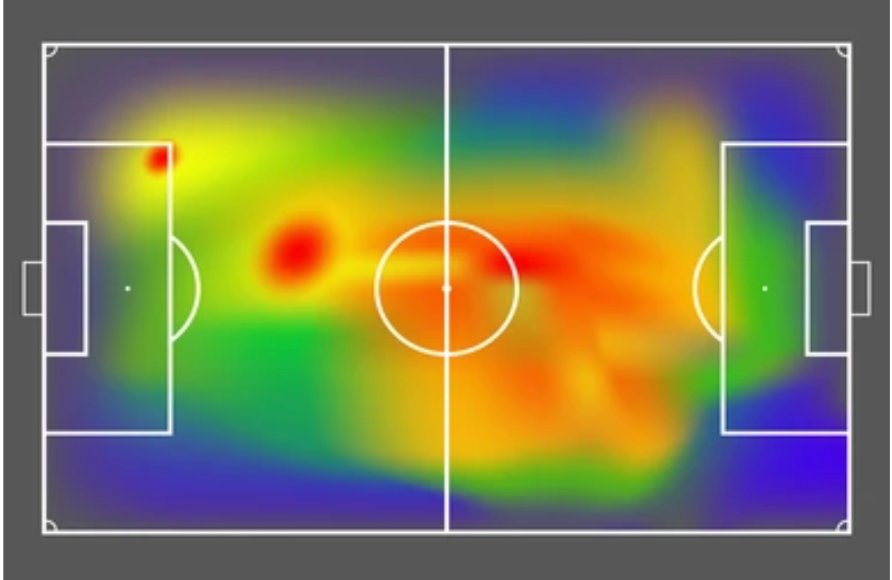
Sports analysts employ heatmaps to dissect player performance, shot charts, and game strategies. Logistics and supply chain professionals use heatmaps to optimize shipment tracking and route planning.
- Player performance analysis: Heatmaps visualize player movements and performance metrics, aiding in analyzing strategies and player efficiency.
- Game strategy development: Heatmaps help develop and refine game strategies by analyzing shot charts and other performance data.
- Shipment tracking: Logistics professionals use heatmaps to track shipments in real-time, optimizing delivery routes and improving efficiency.
- Route planning: Heatmaps assist in route planning by visualizing traffic patterns and identifying the most efficient delivery paths.
Meteorology and cybersecurity
Meteorologists use heatmaps to visualize weather patterns and climate data, while cybersecurity experts leverage them to monitor network traffic and detect potential threats.
- Weather pattern visualization: Heatmaps help meteorologists visualize and analyze weather patterns, providing insights into climate trends and anomalies.
- Climate data analysis: Heatmaps are used to study long-term climate data, helping to identify changes and trends in climate behavior.
- Network traffic monitoring: Cybersecurity experts use heatmaps to monitor traffic, identifying unusual activity and potential security threats.
- Threat detection: Heatmaps assist in detecting cybersecurity threats by highlighting areas of high-risk activity within a network, enabling a swift response.
How to use heatmaps to improve your website/product?
Heatmaps are powerful tools that can significantly enhance your website or product by providing insights into user behavior and identifying areas for improvement. Here’s how you can use heatmaps to optimize various digital assets:
Analyze interaction behavior
- Identify popular elements: Use click heatmaps to see which areas receive the most interaction. This helps you understand which elements attract the most attention and engagement.
- Optimize key actions: Ensure your primary actions (like buttons or links) are placed in high-interaction areas to increase effectiveness. Reposition important elements if they are not getting enough engagement.
Understand engagement patterns
- Evaluate content interaction: Scroll heatmaps show how far users navigate through your content. This helps determine if users engage with critical information or drop off early.
- Optimize content placement: Place key content and calls-to-action (CTAs) within the most active engagement areas. Reorganize content if users are not reaching important sections.
Track user movements
- Gauge user interest: Mouse movement heatmaps indicate where users hover their cursors, often correlating with eye tracking. This helps us understand which areas are most interesting.
- Improve navigation: Identify and simplify navigation issues by making important links more prominent and accessible.
Segment analysis
- Target-specific user groups: Use segment-specific heatmaps to analyze behavior based on different demographics or usage patterns. This allows for personalized optimizations.
- Tailor user experiences: Customize experiences based on how different segments interact with your site or product.
Support for dynamic content
- Analyze interactive elements: Ensure your heatmap tool supports dynamic content like dropdowns and modals to get a full picture of user interactions.
- Optimize interactive features: Improve the design and placement of interactive elements based on user interaction data.
Integration with A/B testing
- Test and validate changes: Integrate heatmaps with A/B testing to see the impact of changes. Use heatmaps to validate hypotheses and ensure improvements are effective.
- Data-driven decisions: Combine heatmap insights with A/B test results to make informed decisions based on real user data.
User experience optimization
- Enhance visual design: Use heatmap insights to refine the visual design of your product. Ensure important elements are prominent and easily accessible.
- Improve performance: If heatmaps show quick drop-offs, consider optimizing performance and load times to enhance user experience.
Application in websites
- Website analytics: For websites, heatmaps reveal user behavior by highlighting where users click, tap, or pause scrolling. This helps webmasters understand navigation patterns and time spent on pages.
- Website optimization: Insights from website heatmaps enable informed decisions about layout changes, improving user engagement, reducing bounce rates, and increasing conversions.
Limitations of heatmaps
While heatmaps are powerful data visualization tools, they come with certain limitations that users should know to ensure accurate and effective analysis.
Risk of misinterpretation
Colors can be easily misinterpreted without the right context, potentially leading to incorrect conclusions.
Data accuracy dependence
The effectiveness of a heatmap is highly dependent on the accuracy and completeness of the underlying data; errors can distort insights.
Challenges with large datasets
Heatmaps can become overcrowded and difficult to decipher, limiting their utility when applied to large datasets.
Generate a heatmap
While it is possible to create heatmaps manually, software has become the preferred method due to its efficiency and versatility. Generating a heatmap typically involves selecting a suitable tool, installing the necessary tracking code on your website, and collecting data over a period of time.
The choice of heatmap tool depends on your specific needs, the type of data you’re analyzing, and the level of insights you require. Once you’ve collected sufficient data, you can generate visual representations to start uncovering patterns and insights.
For those looking for a comprehensive and user-friendly heatmap solution, VWO Heatmaps offers a comprehensive suite of features to unlock deep insights into user behavior. Providing detailed click, scroll, and move maps, it offers a 360-degree view of user engagement.
Dive into segment-specific analysis with VWO Heatmaps to gain targeted insights into visitor behavior. Use these insights to inform your testing hypotheses and make improvements based on real visitor data.
With an easy no-code setup process and GDPR compliance, VWO Heatmaps is ideal for businesses of all sizes looking to boost conversions and enhance user experience.
Some of the other popular heatmap tools include:
- Google Analytics: Provides basic heatmap functionalities integrated with broader website analytics.
- Microsoft Excel: For creating simple heatmaps using conditional formatting for small datasets.
- Crazy Egg: Offers detailed insights into user behavior with click, scroll, and mouse movement heatmaps.
- Tableau: A powerful data visualization tool that can create custom heatmaps for various data sets.
Best practices for heatmapping
To ensure your heatmaps effectively communicate the intended message, adhere to these best practices in design and interpretation.
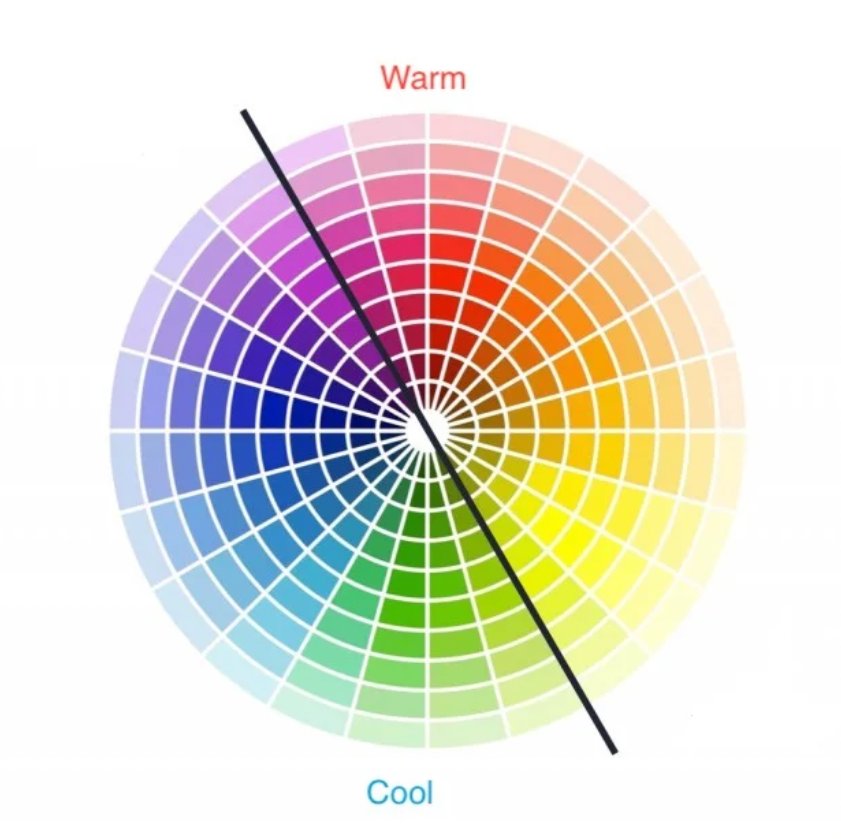
Color scheme selection
Choose an appropriate color scheme to enhance readability and impact. Consider color blindness, cultural associations, and the intended message to ensure accessibility and accurate data representation.
Labeling and legends
Provide clear labels and legends for accurate interpretation. Define data ranges for each color and ensure axis labels are easy to understand, helping users grasp the data instantly.
Layout optimization
Optimize the layout by considering grid size, cell spacing, and overall organization. A well-organized layout enhances visual appeal and readability, making navigating and interpreting the data easier for viewers.
Common mistakes to avoid
When creating heatmaps, it’s important to avoid common pitfalls that can reduce their effectiveness.
Overcomplicating the visualization
Simplicity is key. Avoid adding unnecessary elements that can clutter the heatmap and detract from its clarity and readability.
Ignoring data context
Always consider the context of the data to avoid misinterpretation. Ensure that the heatmap accurately reflects the situation or scenario being analyzed.
Misinterpreting color intensity
Explain what the colors represent to prevent confusion. Provide a legend or key to help viewers understand the significance of different color intensities.
Conclusion
Heatmaps have become an essential tool in data visualization. They offer a unique way of analyzing user behavior, tracking sales, and conducting scientific research. Mastering heatmaps can uncover hidden patterns and trends, driving informed decision-making.
For those looking to elevate their use of heatmaps, VWO’s advanced tools offer comprehensive features designed to optimize your website and enhance user experience. These tools unlock deeper insights and take your data analysis to new heights.
FAQs on heatmaps
A heatmap is a data visualization technique that uses color coding to represent different values within a dataset. By showing variations in color intensity, it provides an intuitive way to understand complex data.
A website heatmap visually represents user behavior on a web page. It shows where users click, move their cursor, and how far they scroll, using color gradients to indicate areas of high and low engagement.
The principle of a heatmap is to represent numerical data through color variations. Darker or more intense colors (red or orange) indicate higher values or activity, while lighter/cooler colors (blue or green) indicate lower values. This visual approach makes it easy to identify patterns, trends, and anomalies at a glance.
A heatmap reveals patterns, trends, and anomalies in data. For websites, it shows which areas attract the most attention, where users click most frequently, and how far they scroll, helping to identify popular and overlooked page areas
Heatmaps offer quick visual insights into complex data, making patterns easy to spot. They’re particularly useful for understanding website user behavior, optimizing layouts, and improving user experience based on actual interaction data.
You can create a heatmap using various software tools, such as Google Analytics, Microsoft Excel, VWO, Crazy Egg, and Tableau. These tools offer different features and levels of customization to suit various needs.
To read a heatmap, look at the color intensity to understand the data distribution. Darker colors indicate higher or more activity, while lighter colors indicate lower values. Contextual information such as labels and legends will help you interpret the data accurately.
To analyze a heatmap, identify areas of high and low activity. Look for patterns, trends, and anomalies that can provide insights into user behavior or data distribution. Use this information to make strategic choices for optimization and improvement.
Most modern heatmap tools have minimal impact on website performance. They typically use asynchronous loading and efficient data collection methods. However, monitoring your site’s speed after implementing any new tool is always good practice.
Yes, you can use heat maps in Shopify stores. Many heatmap tools offer integrations or plugins specifically for Shopify. These can provide valuable insights into how customers interact with your product pages, checkout process, and overall store layout.
Yes, heatmaps can be used on WordPress sites. Various WordPress plugins are available for heatmap functionality, and many standalone heatmap tools can be easily integrated with WordPress sites by adding a simple tracking code.


