Testing One Change Helped Allinclusive.no Increase Conversions Using VWO
About Allinclusive.no
[This is a success story from Sverre Bech-Sjøthun.]
Allinclusive.no is a holiday portal specializing in all inclusive travels. The company, founded and run by Mr. and Mrs. Carlstrøm, generated a revenue of 12 million NOK in 2011.
Goals
As we were approaching one of their top seasons, my biggest challenge was that I had to identify opportunities that didn’t require programming or lots of redesign work, simply to keep both cost and time spent to a minimum.
Tests run
Throughout my analysis, I did identify several great opportunities in terms of usability and process optimization, but the response was (to quote MC Hammer) – You can’t touch dis’ (and I bet that this instant you got the song in your head – sorry!).
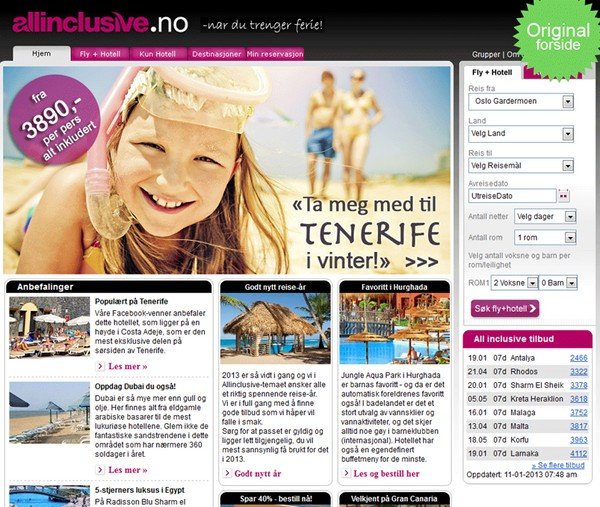
This is how the original page, or the control, appeared:

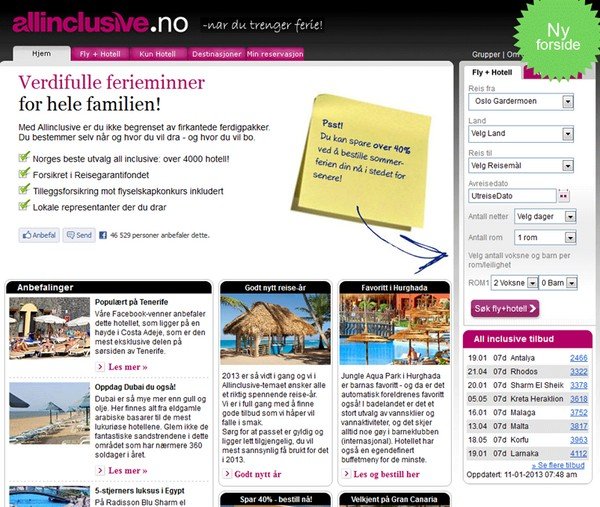
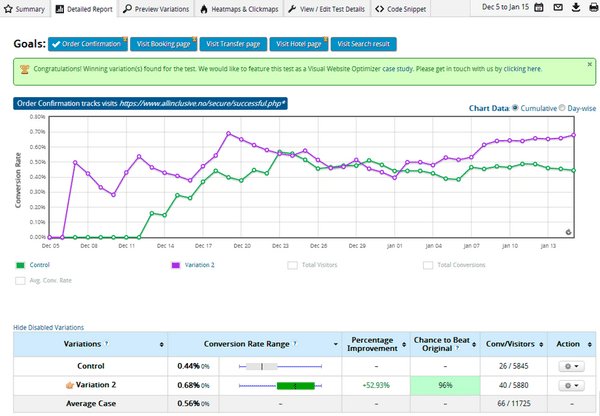
By replacing the rotating campaign banner on the front page with a very deliberately crafted copy, I was able to increase their conversion rate from 0.50% to 0.68% – an increase of 52.3%.
Here’s the variation below:


Conclusion
This test is a testament to the power of a well-crafted copy, and even with a very long sales funnel, the front page influences the visitor throughout the entire funnel.
Indeed, this influence becomes more and more pronounced the further the visitor moves:
Front page Improvement
Search result +0.48%
Hotel page +11.08%
Upsell +8.86%
Booking/Payment +18.87%
Order confirmation +52.93%
Using the VWO/GA integration with eCommerce even revealed that while the conversion rate increased by over 50%, the revenue actually doubled.
How is this even possible?
Let’s start with the simple fact that your online revenue is determined by the following simple equation:
Visitors X Conversion rate X Average sales price
(Even if you don’t sell products or services on your website, this holds true – your revenue from your website, like lead gen and others are still defined by these 3 factors.)
- Visits are determined primarily by marketing, advertising, PR, and customer loyalty.
- Conversion Rate and Average Sale are determined mainly by:
- Motivation to perform the desired behavior (Persuation)
- Ability to perform the desired behavior (UX)
- Trigger to perform the desired behavior (Call to Action, like “add to cart”, “Contact”)

Location
Hedmark, Norway
Industry
Travel
Impact
52.3% increase in Conversion


