RubberStamps.net Increased Revenue Per Visitor (RPV) by Optimizing Trust
About RubberStamps.net
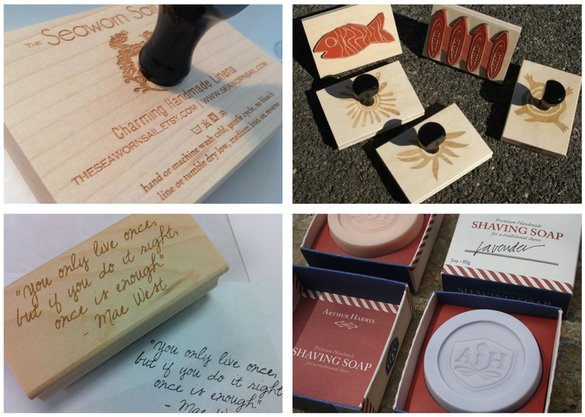
Headquartered in Bettendorf, Iowa, RubberStamps.net deals with custom stamps made to order. They offer personalized stamps with text, date, logo, custom design, graphic, signature, and more in all shapes and sizes. RubberStamp.net uses laser-engraving technology that gives a crisp, clear impression of design and text on the stamp.

RubberStamps.net has been using VWO to optimize their website experience since 2018. We got in touch with Gwendolyn Lee, President, and Owner at RubberStamps.net, to learn all about a recent A/B test that resulted in the improvement of their revenue per (new) visitor.
Fun fact: Revenue Per Visitors (RPV) was not the only metric that RubberStamp.net improved through this test. They also registered a number of small, unanticipated wins!
Goals
RubberStamps.net has been catering to many loyal, long-time customers since its inception. But, as a .net domain and a non-big box store, the team wanted to make some changes to their website that would ensure that even new visitors trust their brand and increase the Revenue Rer (new) Visitor (RPV).
Observations
According to RubberStamps.net’s Google Analytics data, the revenue per visitor (RPV) of the homepage landings was reasonably lower than other landing pages. While RubberStamps.net had positive customer reviews on the homepage, they were below the fold. Only 25% of visitors scrolled down to reach the reviews.
Tests run
The team at RubberStamps.net often use website heatmaps to gather visitor behavior data and look for outliers regarding bounce, revenue per visitor, time on site, exit, and so on. To see how website heatmaps work, take a 30-day free trial today.
The heatmaps and clickmaps included with each test variation provide a huge amount of additional value and data for the next steps and tests.

Gwendolyn Lee
President and Owner
They also occasionally attend webinars or use services like usability testing services for new, insightful feedback and testing ideas. The idea for the test discussed here also came from a website-review webinar about an unrelated ecommerce site, similar to this website review webinar hosted by VWO.
The team wanted to test if the aforementioned difference in RPV:
- Was a result of other category or product pages being further down the purchase funnel, thereby, creating a higher revenue per visitor
- Or if there were other adjustments on the homepage that could create a higher RPV
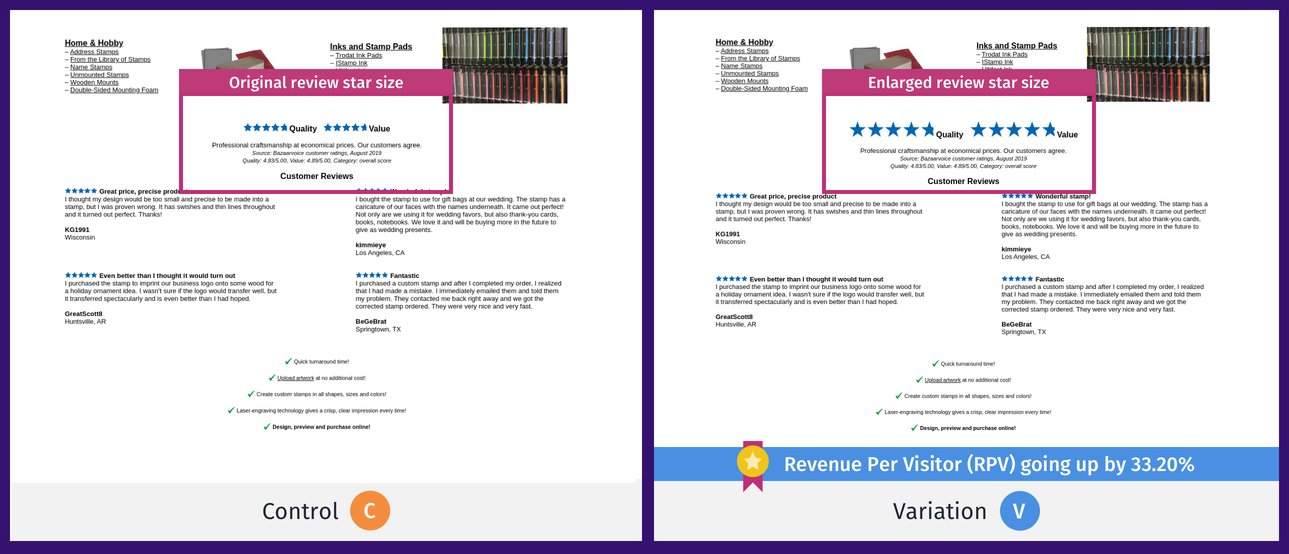
The team at RubberStamps.net hypothesized that doubling the review star size above their text reviews would increase trust and confidence, thereby increasing value per visitor or revenue per visitor. This is what the control and variation looked like:

Results: Before the test, the RPV for control stood at $4.99. 6,000 visitors became a part of the test, which ran for 9 days, and the metric tracked was revenue per (new) visitor (RPV). The variation registered a 33.20% statistically significant increase in RVP to $6.64 as compared to the control. There were also mini, unanticipated wins that came out of the test with conversion rates going up by 6.1% and average order value (AOV) by 25.6%. Even the percentage of visitors scrolling down to the reviews section increased by 20%.
Start a free trial today for gathering deep insights about your visitors’ behavior.
Conclusion
After witnessing the many breakthroughs in the test discussed above, the team at RubberStamps.net has many tests planned for the future like testing other high-traffic landing pages with similar format changes to determine if revenue per (new) visitor (RPV) increases on these pages as well like it did on the homepage. And VWO is happy to be a part of their experience optimization journey.
Absolutely love it – VWO has taken our website testing to a whole new level.

Gwendolyn Lee
President and Owner

Location
Iowa, USA
Industry
Retail
Experiment goals
Increase revenue per new visitor (RPV)
Impact
33.20% increase in revenue per visitor (RPV)


