
What is High Density Interval (HDI)?
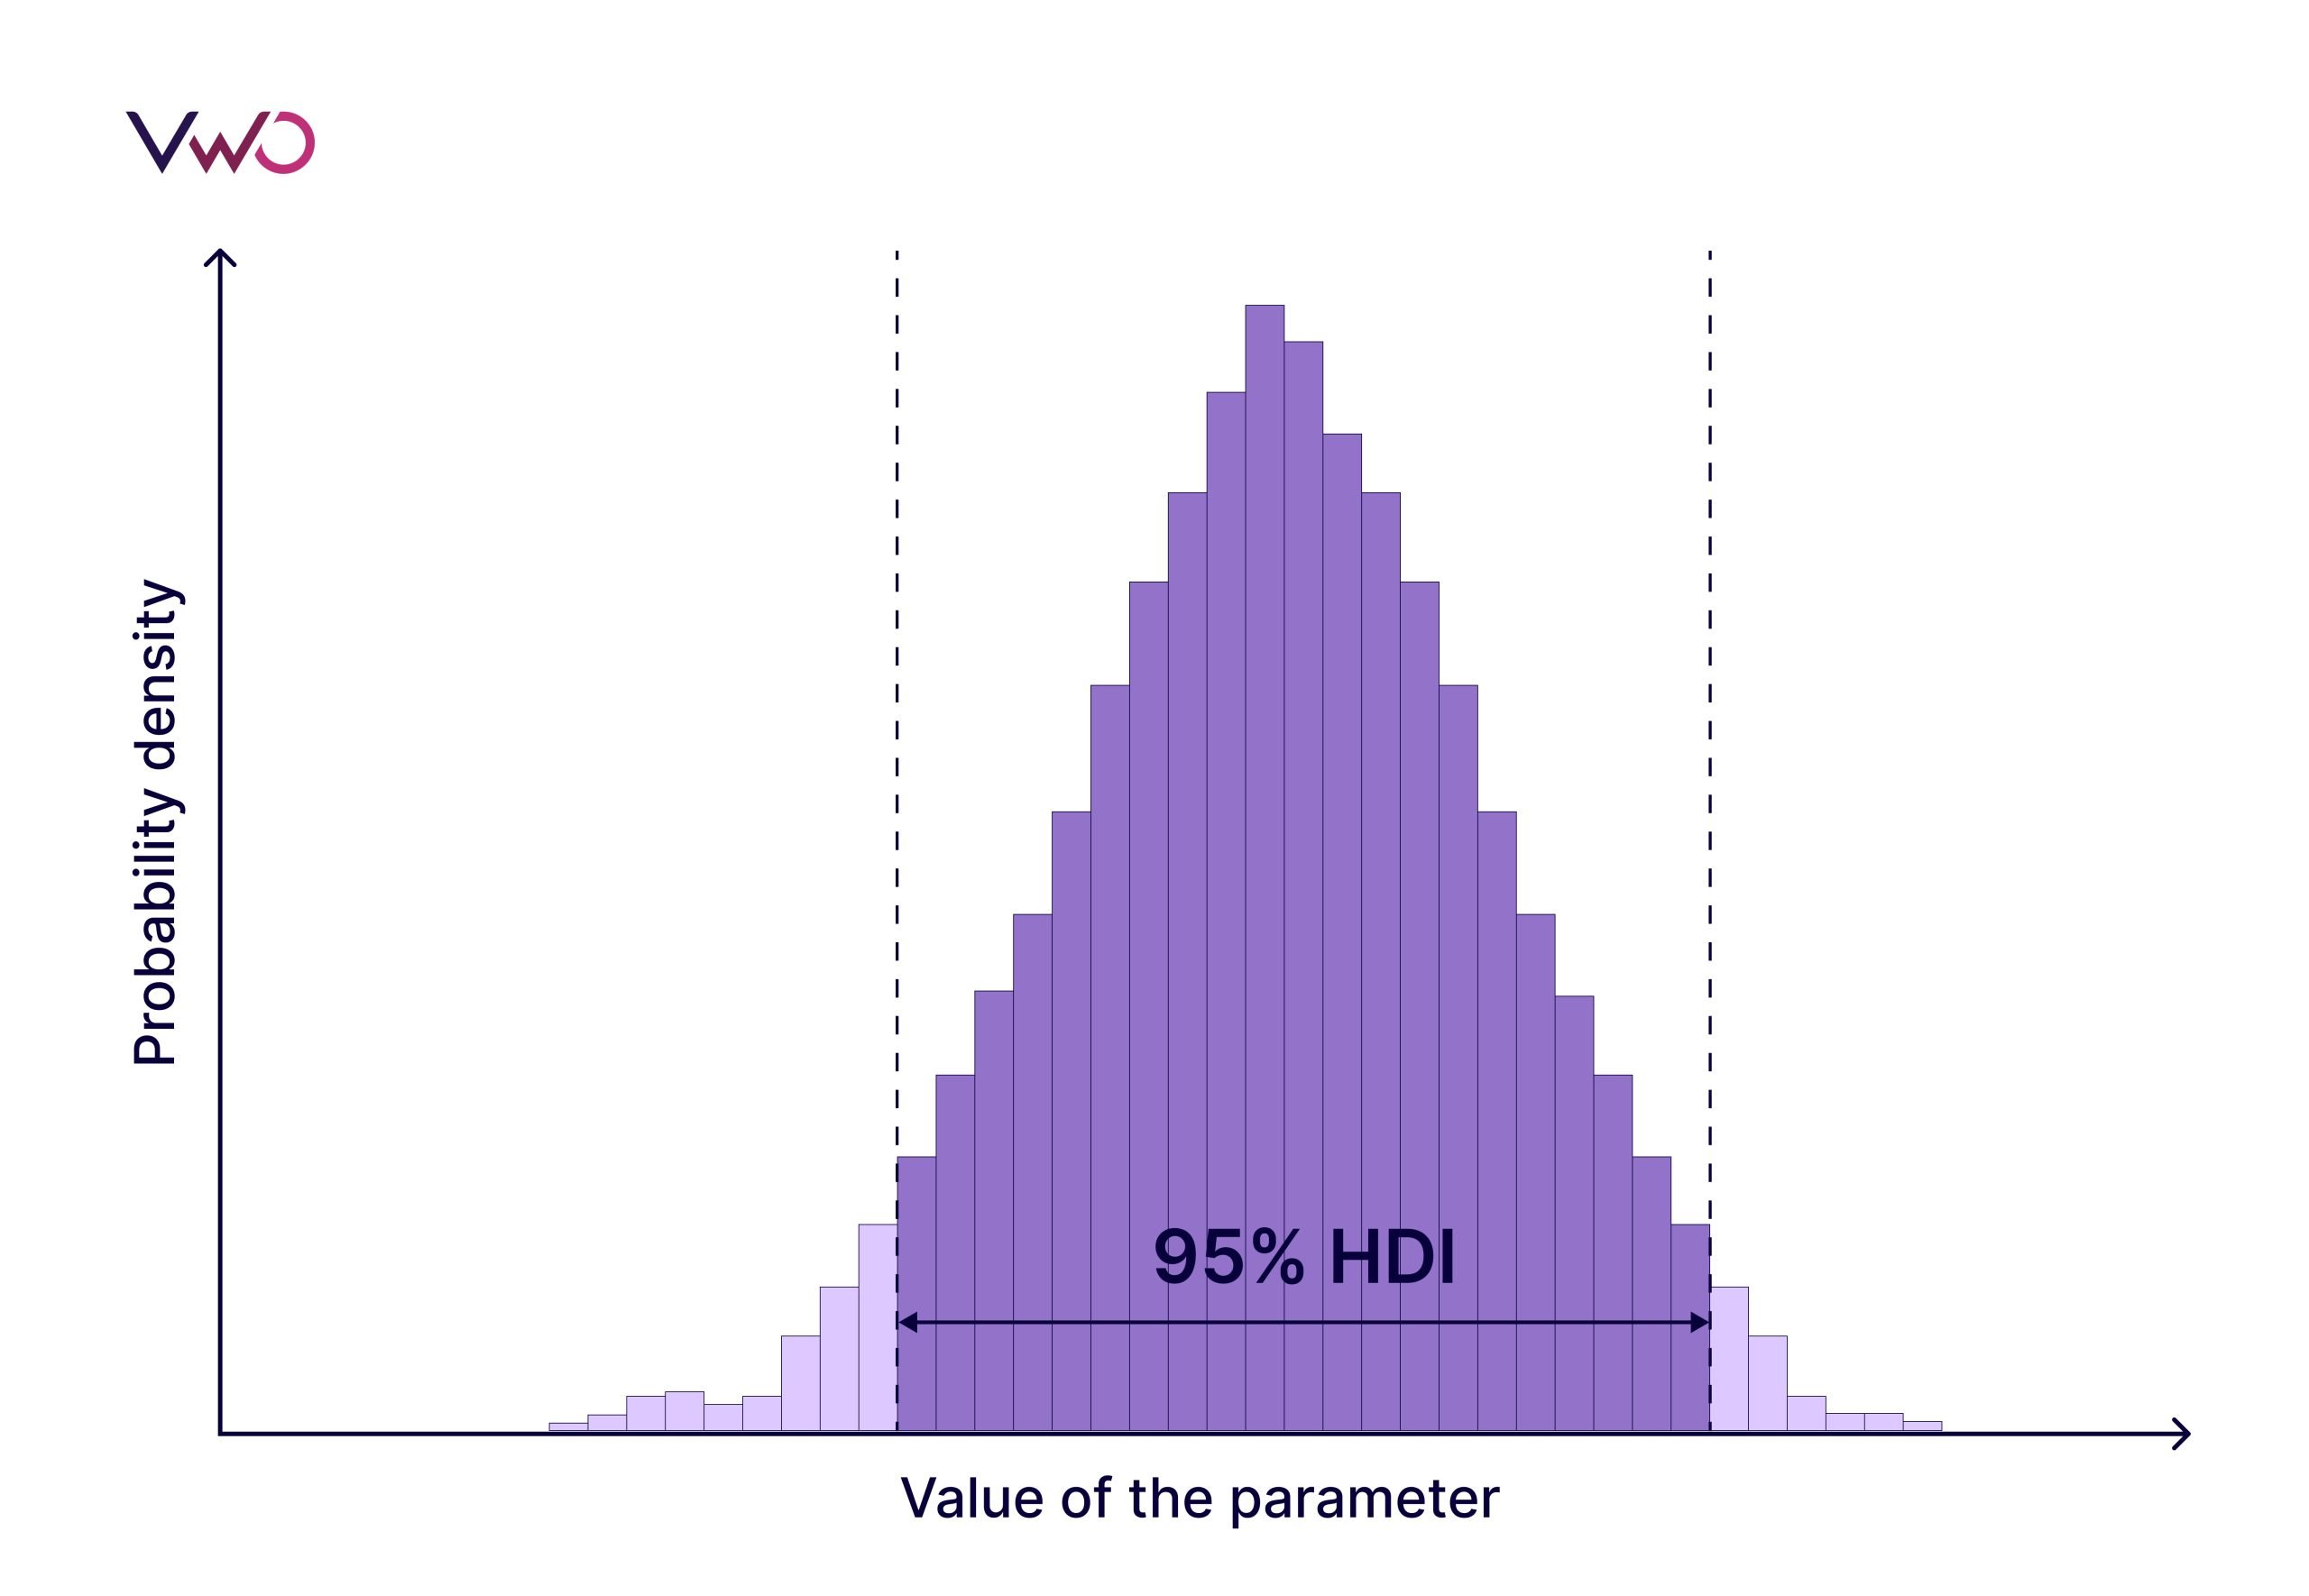
High Density Interval (HDI), also known as a credible interval, is a statistical method used in Bayesian analysis that identifies the range containing a specified probability mass where the parameter values have the highest probability density. Unlike traditional confidence intervals, HDI represents the most credible values for a parameter given the observed data and prior knowledge.
For example, an ecommerce store runs a Bayesian analysis on conversion rate data from an A/B test. The posterior distribution shows that the conversion rate has a 95% HDI between 12% and 18%. This means that given the observed data, there’s a 95% probability that the true conversion rate lies within this range, and these are the most credible values based on the evidence.
How to find HDI?
Here’s how HDI is calculated:
Step 1: Generate posterior distribution
Create a posterior probability distribution for your parameter using Bayesian inference, combining prior knowledge with observed data.
Step 2: Determine the probability mass
Choose your desired credibility level (e.g., 95%), which represents the total probability mass you want to capture.
Step 3: Find the highest density region
Identify the narrowest interval that contains the specified probability mass. This is the region where the probability density is highest, meaning these parameter values are most supported by the data.
Step 4: Define the HDI
The resulting interval is your HDI, representing the most credible range of parameter values.
Difference between HDI and confidence interval
| Factor | HDI | Confidence interval |
| Statistical engine | Bayesian | Frequentist |
| Definition | A range containing specified probability mass where parameter values have the highest probability density, representing the most credible values given data and prior knowledge. | A range that would contain the true parameter value in a specified percentage of repeated sampling procedures. |
| Interpretation | Probability that the parameter lies within the interval given the data. | Confidence in the procedure, not probability about the parameter. |
| Focus | Most credible parameter values based on observed evidence. | Procedural reliability across hypothetical repeated samples. |
HDI in VWO Reports
VWO’s Reports utilizes HDI to provide comprehensive insights into test performance through Bayesian statistical analysis. The reports table displays data for each variation with the control set as the default baseline, though you can change this using the “Use this as Baseline” option.
VWO presents the median conversion rate you can expect from each variation, accompanied by “best case” and “worst case” values that represent the HDI. This HDI range shows where your actual conversion rate is most likely to be contained, providing a realistic understanding of performance boundaries rather than just point estimates.
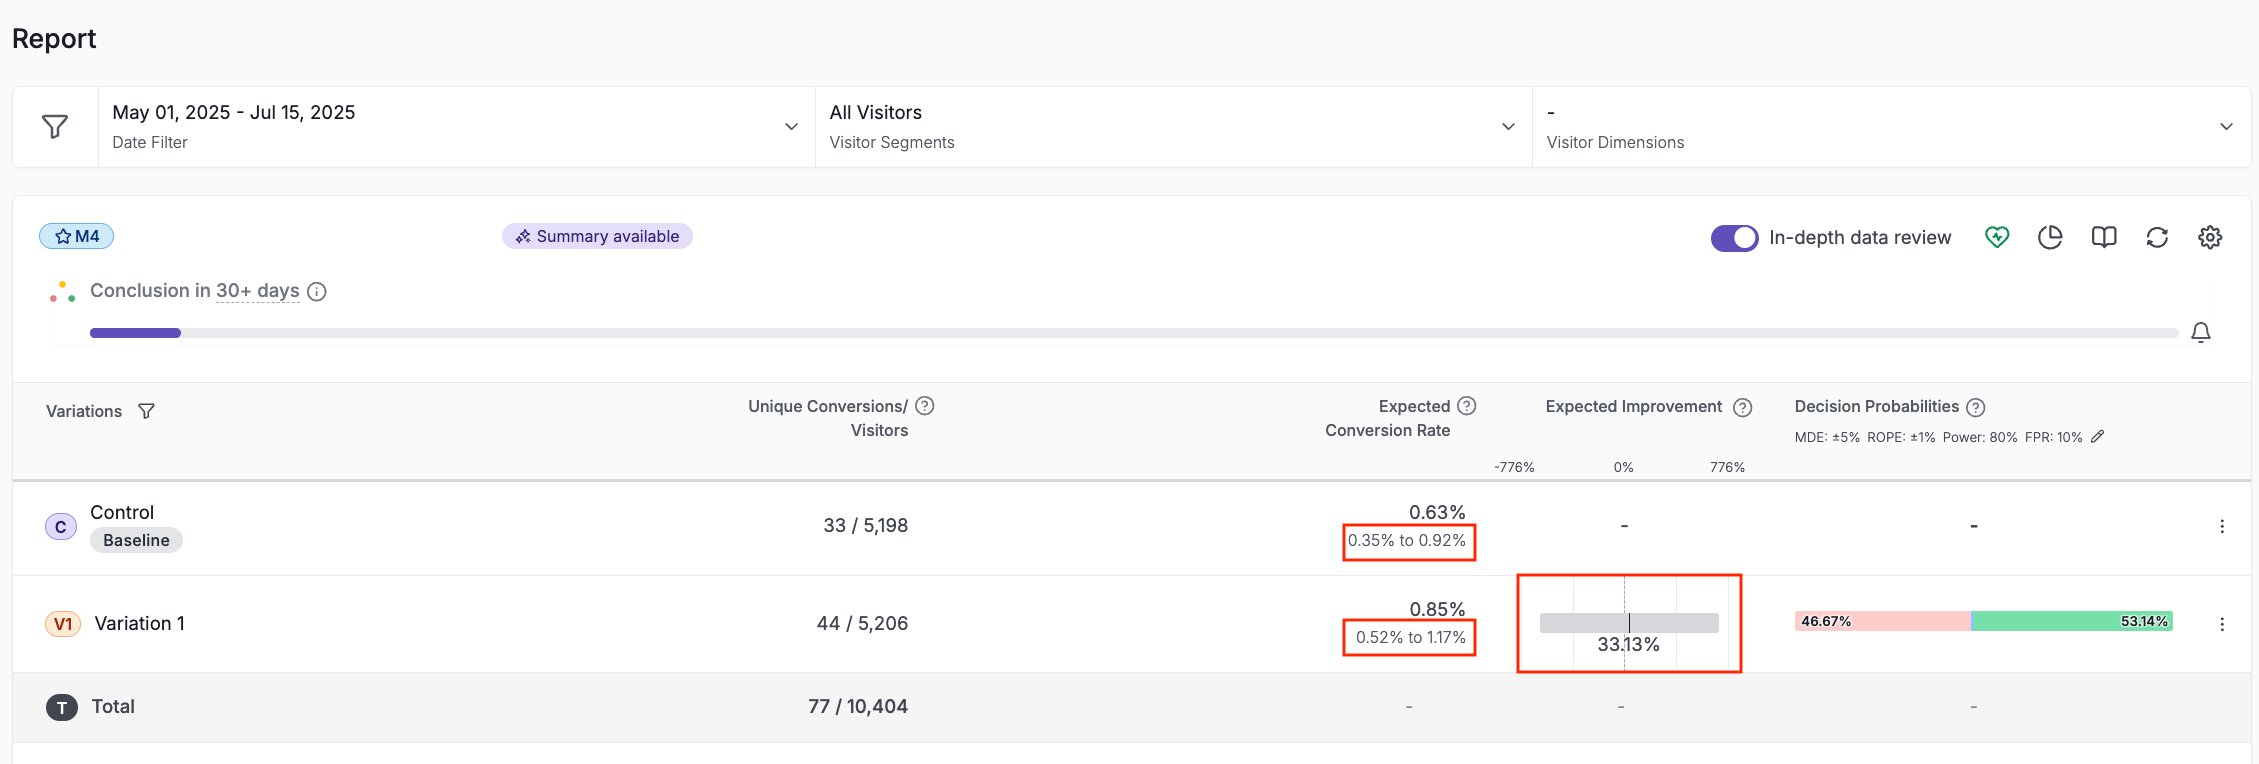
By presenting HDI, VWO’s reporting allows teams to make confident optimization decisions based on the most probable outcomes rather than uncertain point estimates.
For more details about VWO Reports, explore our comprehensive product documentation and product updates.


