Follow your visitors’ journey with Heatmaps
See how visitors browse your website - what catches their attention, and which elements distract them. Use these insights to build an experience that enables your visitors to convert.
Top companies rely on VWO's behavior analytics platform


Visualize user interactions
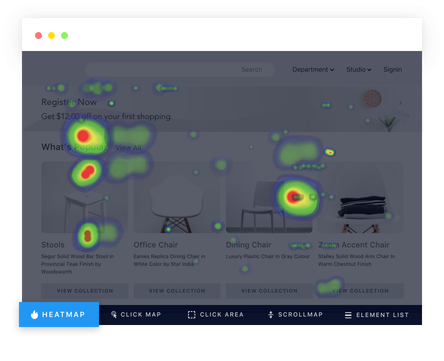
Heatmaps offer visual representations of how visitors interact with your website. From clicking elements to selecting an option from a modal box to browsing page content, a heatmap is a true representation of all visitor actions.
AI-powered heatmap analysis and recommendation
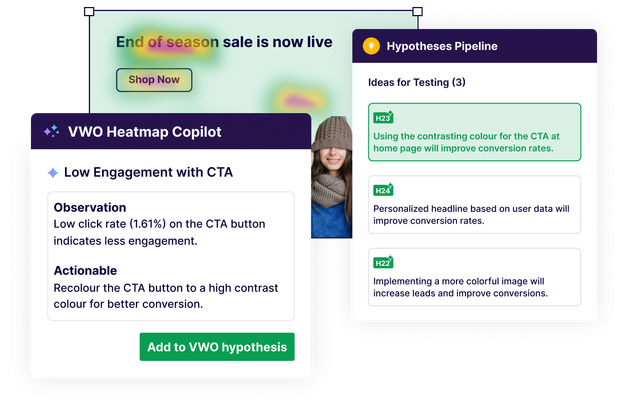
VWO Copilot for heatmap analysis helps you analyze user data in heatmaps in depth to identify actionable recommendations to improve user experience.
Dynamic heatmaps
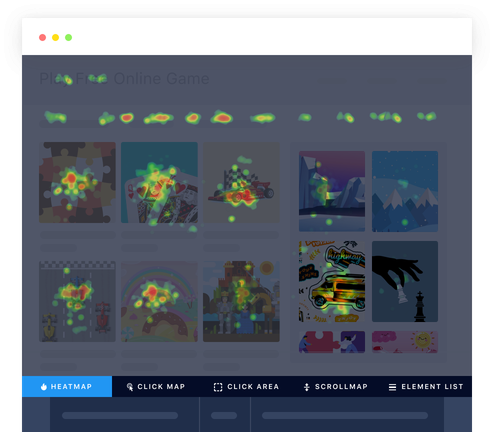
Record visitor data on the live state of your website. Easily view behavior on elements like modal boxes, pages behind logins, and dynamic URLs. The navigation mode lets you browse different pages on your website while viewing the visitor data on each element of these pages.
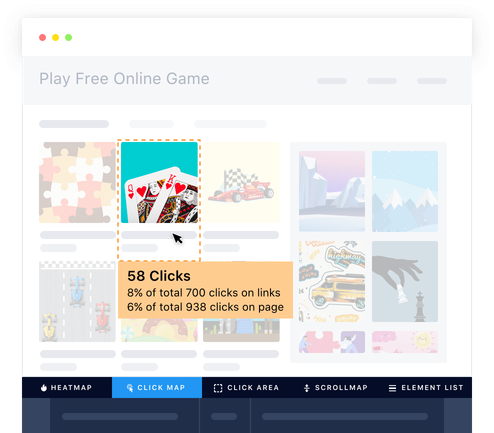
Clickmaps
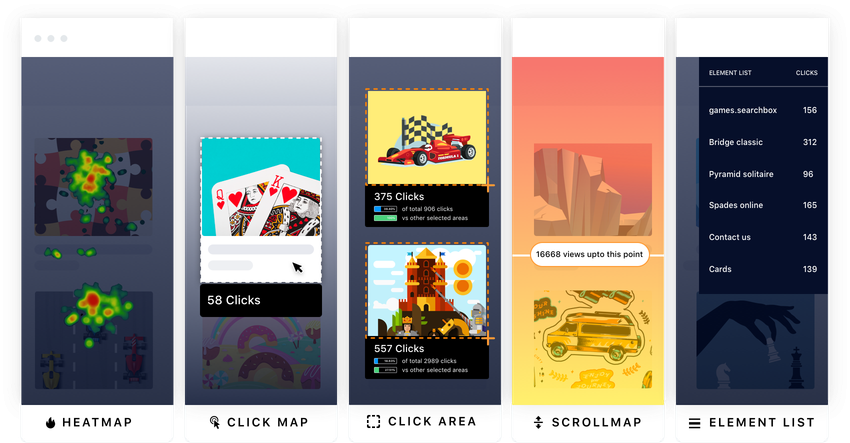
Get real-time data on where visitors are clicking. Use the click data to find out key action points on your pages. And remove elements that distract the user.
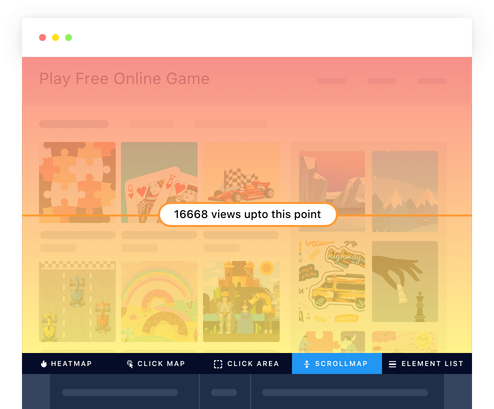
Scrollmaps
Find out till what point most visitors are scrolling, and if they are missing out on anything important towards the end of the page. Use this insight to highlight key information and position it better basis how visitors navigate the page.
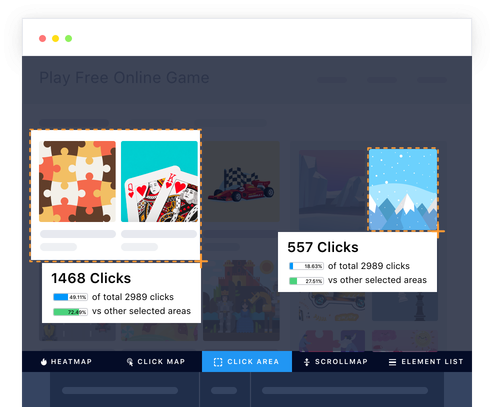
Click area
Select multiple areas on your page and compare the number of clicks between them.
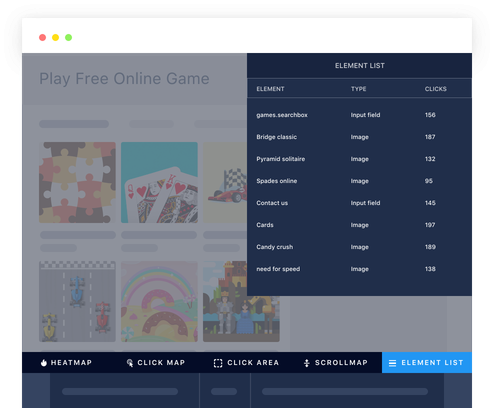
Element lists
Get click data for all the elements on your page by element ID/name (including hidden elements) to understand how much attention they are getting from users.
Zero down on the visitor behavior you want to focus on
Select a view of interest, and slice and dice behavioral data using your user attributes and customized segments. Then share findings with your colleagues to collaborate.
Views
Select the pages or specific sections of your website for which you want to see a particular behavior. Create views of these pages and then save these views for future reference.
You can also create views for segments targeted by behavior including:
- Click on an element
- Time spent on page
- Page scroll %
- Exit intent
- Your own custom trigger
Visitor segments
Filter your heatmap report using complex and/or bracketing logic conditions or choose from VWO’s 20 predefined segments including:
- New vs. returning visitors
- Mobile, desktop, and tablet traffic
- Browser
- Geography
Collaborate with your team to make data-backed decisions
Add observations
Had a unique insight based on visitor behavior? Add an observation and VWO will save your observation with the exact state of the heatmap where you noted the behavior.
Download and share
Download the exact state of a heatmap and share it with your colleagues to uncover more insights.
Always-on, real-time data
Be sure you never miss a single click. Your heatmaps continuously process loads of data at the backend to record and display behavioral data real-time.
Cross-platform tracking
Choose the device of your preference. You can view heatmaps for visitors by using a desktop, mobile, or tablet.
Get enterprise-grade security and support from day one
Work confidently, knowing that we have always got your back for your security and support. Build and scale your testing programs with ease.
Your data is safe and secure with us
We value our customers' trust in our platform. Hence, we try our best to comply with security and privacy mandates across physical and digital geographies.
Explore Privacy & SecurityTwo-factor authentication (2FA)
Enhance VWO account security with two-factor authentication at the user or workspace level using authenticator apps or email passcodes.
Data storage
VWO has data centers in the US, the EU (Belgium), and India. Our CDN uses a load balancer, is hosted on Google Cloud Platform, and spans 10 locations from Japan to Brazil for faster loading.
Dedicated customer success manager
Leverage our training programs and dedicated success manager to optimize your website for better conversions.
Support with a constant CSAT of ~99%
You can count on us all year round for your most minor query while running the most complex experiments. Our technical experts will guide you all year round.
Single sign-on (SSO)
Log into VWO securely and conveniently using SAML 2.0-based single sign-on via identity providers like Google, Azure Cloud, OneLogin, Okta, and others.
Role-based permissions
Get Sub-accounts and varying levels of user permissions to bifurcate testing for client/agency and role division for the enterprise.
Drive your entire optimization program with VWO
Pair VWO Insights with our end-to-end experience optimization platform to enable a data-driven experimentation culture in your business.
Collaboratively build your optimization pipeline
Build a pipeline of experiments with personalized AI-generated optimization ideas for your website powered by GPT-4. Collaborate easily and see them to completion. Build a Kanban board workflow with observations to feed your testing and personalization campaigns. Add team members without restrictions and run your optimization program like a breeze.
Explore VWO Plan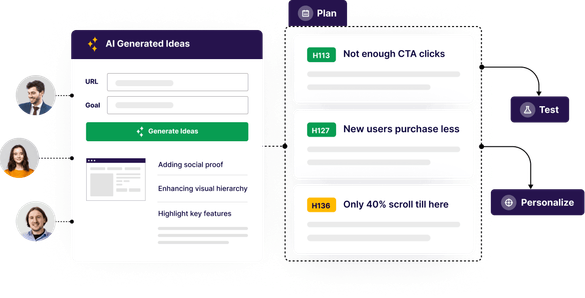
Create and run data-backed experiments
Evolve your observations from insights into hypotheses you can actually test with our sophisticated experimentation platform . Manage the priority of your experimentation ideas with a robust ICE framework and deploy winning experiments for all your users.
Explore VWO Testing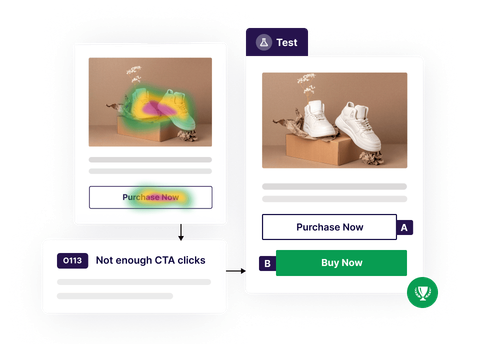
Personalize experiences for your visitors
Use behavior analytics to understand how each customer thinks and build meaningful experiences to connect with them better. With VWO Personalize, you can deliver highly individualized experiences to the right audience, at the right place, at the right time.
Explore VWO Personalize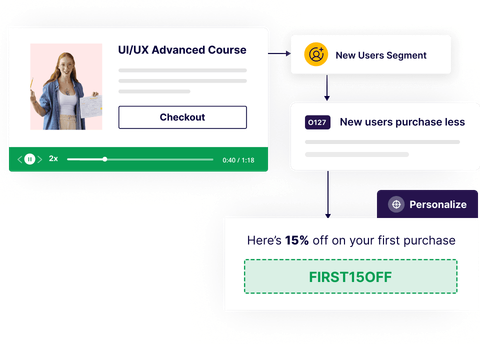
Proven to improve business metrics
Learn how our customers use behavioral data insights to improve user experiences, run data-backed experiments, and impact conversion metrics.
Our customers love VWO Insights!!
Most customers purchase VWO Insights to gather data-driven insights for experience optimization. While our industry-leading G2 ratings and benchmark CSAT scores are evidence enough, here are some success stories in their own words.
We ran a series of A/B tests based on the data we gathered by using Heatmaps, Scrollmaps and Surveys available on the VWO Platform. It helped us to identify key elements on our websites that needed a deeper look.
Digital Marketing Lead
VWO is a highly user-friendly and economical tool. It offers an intuitive user interface. It makes it easy to run experiments, gather customer insights, check for leakages in the sales funnels, looking at customer journeys using recordings, and conducting usability tests.
ISM eCompany
I was able to infer how visitors use the site (heat maps, visitor-recordings etc) and even how they feel (surveys). Gleaning insights from these data, I could strategize and easily launch A/B tests, multivariate tests, personalization triggers and more to optimize our funnel.
Onsite merchandising team
We were very happy that this A/B test validated our research-driven hypothesis. We loved how we didn’t have to buy some other tool for running heatmaps and scrollmaps for our visitor behavior experiment.
CRO Consultant


