
Alpha spending refers to how you “use up” your allowed error margin (alpha) when you peek at test results multiple times before a test officially ends.
When you run an A/B test, you usually set a confidence level, like 95%. This basically means you’re willing to accept a 5% chance (alpha = 0.05) that your results could be wrong (in other words, you found a winner when, in reality, there isn’t one, that’s called a false positive).
Now, if you only check the results once, at the end, that 5% risk holds steady.
But in real life?
Let’s be honest: everyone peeks at results while a test is running.
You check on Day 3… Day 5… Day 10…
And every time you peek, it’s like spinning a roulette wheel again.
Each spin gives you another small chance of accidentally thinking you have a winner when you don’t.
This is where alpha spending comes in.
It’s a way to budget that 5% error rate, across multiple peeks.
Instead of risking the full 5% every single time you look, you “spend” a small piece of it with each check.
In other words, ‘alpha’ is your test’s snack budget. Alpha spending decides how much of the snack you’re allowed to eat each time you open the fridge.
Here’s a simple example. Let’s say you’re running an A/B test on your eCommerce checkout page to see if a new layout improves conversions.
- You set your significance level (alpha) at 0.05 (5%).
- You plan to peek at the results 5 times during the test.
Instead of risking the full 5% each time, a good testing tool or statistical method would divide up the alpha.
Maybe you allow 1% error for each peek (plus a little left for the final look).
That way, even though you’re looking often, your overall chance of a false positive never exceeds 5%.
Without alpha spending:
- Each peek risks a full 5%.
- After 5 peeks, your false positive risk could balloon way above 5%, maybe even 20% or more!
With alpha spending:
- You control risk carefully across all peeks.
- Your test remains trustworthy and scientifically sound.
Why should you care?
Because if you peek a lot (and most of us do!) without controlling alpha spending, you could end up making expensive decisions based on bad data.
Imagine rolling out a new checkout page because early test results looked great, only to realize a month later that sales actually dropped.
That’s why smart CRO platforms (like VWO!) use advanced methods like alpha spending (or related techniques like sequential testing) to make sure your A/B test results stay reliable even when you can’t resist peeking.
Here’s a quick look at the concept and the meaning in simple terms:
| Concept | Meaning |
| Alpha | Your acceptable risk of a false positive (usually 5%). |
| Alpha spending | How you divide and manage that risk if you peek multiple times during a test. |
Think of alpha spending like air traffic control for your experiments, making sure every “flight” (peek) stays on course and doesn’t crash your data reliability.
The bottom line is to run tests that you can actually trust.
Alpha Spending in A/B testing
Alpha spending is a key principle in A/B testing, ensuring experiment validity when tests are continuously monitored.
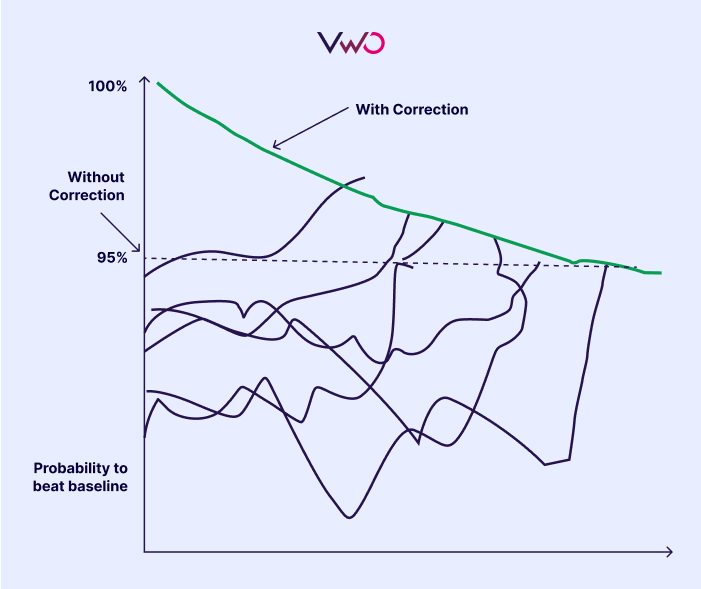
The y-axis in the above graph represents the ‘probability to beat baseline’, or the likelihood that a variation outperforms the control group.
The x-axis is time or sample size, illustrating how probabilities evolve as data accumulates.
There are two key elements in the graph:
- Multiple jagged black lines: These represent different test variations when monitored without statistical correction. They fluctuate heavily, some showing early probabilities above the critical threshold of 95%, which often gets mistaken for ‘statistical significance’.
- The green line (labelled “With Correction”): This line is smoother and gradually trends downward, staying more controlled. It represents how the same variations behave when proper statistical correction is applied, specifically, alpha spending correction (like alpha spending functions or sequential testing methods). The correction controls for the inflated false positive rate that occurs when experiments are checked too frequently.
The dashed horizontal line marks the commonly used 95% confidence threshold, which experimenters often treat as the benchmark for significance. Without correction, many of the lines cross this threshold prematurely due to natural statistical noise. But when correction is applied, the adjusted probability (green line) trends conservatively and only crosses 95% when there’s truly strong evidence.
This graph effectively communicates that the risk of peeking, checking test results too frequently, without adjusting for it, can mislead teams into false positives.
VWO applies alpha-spending corrections to maintain the statistical integrity of your results, ensuring that the decisions you make based on your experiments are reliable and not just statistical accidents.
In other words, with correction, you’re protected from jumping to the wrong conclusion too early.


