For feature launches, the “why” behind user interactions has always been a black box.
You get the adoption numbers, but you never really see the actual behavior behind them.
That’s the gap we have filled.
Introducing Behavior Analytics linked with Feature Experimentation.
Now, with every feature experiment, rollout, and personalization campaign, you will have integrated heatmaps and session recordings to see where a user clicks, scrolls, hesitates, or drops off.
Step into their digital shoes. Wherever they go – a website or mobile app.
Say bye to guesswork. Say hi to evidence-backed product decisions.
Why do you need it?
To investigate faster: When a test underperforms, was it the design, the copy, a bug, or wrong placement? Figure out the hidden reason, in minutes.
To stop gambling: A new feature launch need not be a gamble. Make it strategic with phased releases + behavior tracking to spot usability issues and friction trends before they drastically affect your core business metrics.
To check whether users are feeling special: Once you personalize certain experiences, there’s a certain bias to think they will work. But do they? If behavior analytics is not interconnected, you might miss early signals about whether they do, or not.
To boost confidence (for real!): PMs and developers justify roadmap decisions with visual evidence. Designers validate UX choices with real behavior. Developers spot bugs and usability issues instantly. Analysts will be able to tell the complete story behind the numbers.
How does it help you?
Understand test results deeper:
You are a PM, you tested a new checkout experience. Say, it won by 8% uplift. Understand which elements users actually engaged with, and where they hesitated, using variation-specific heatmaps.
Say, your pricing page test lost for mobile visitors. You can see the session recordings of users who dropped off without requesting a demo.
Ideate features with evidence:
As a developer, you get to see visual evidence, you can create data-backed feature stories, pitch them internally, get the buy-in from your higher-ups, and launch with a probabilistically high level of success rate.
Cut losses quickly:
As a growth marketer, you need to adjust experiments, feature rollouts, and personalization campaigns in real-time, or every visitor interaction will bleed revenue loss. Now you can visually see how visitors interact, using heatmaps and session recordings. If your new feature is performing way worse than how it should, you can instantly pause the feature release.
Find bugs faster:
As an engineer, you can use visual insights to spot where users struggle, debug feature issues faster, and validate fixes through experiments – so every release is backed by real user behavior, not guesswork.
What can you do, and where to find this?
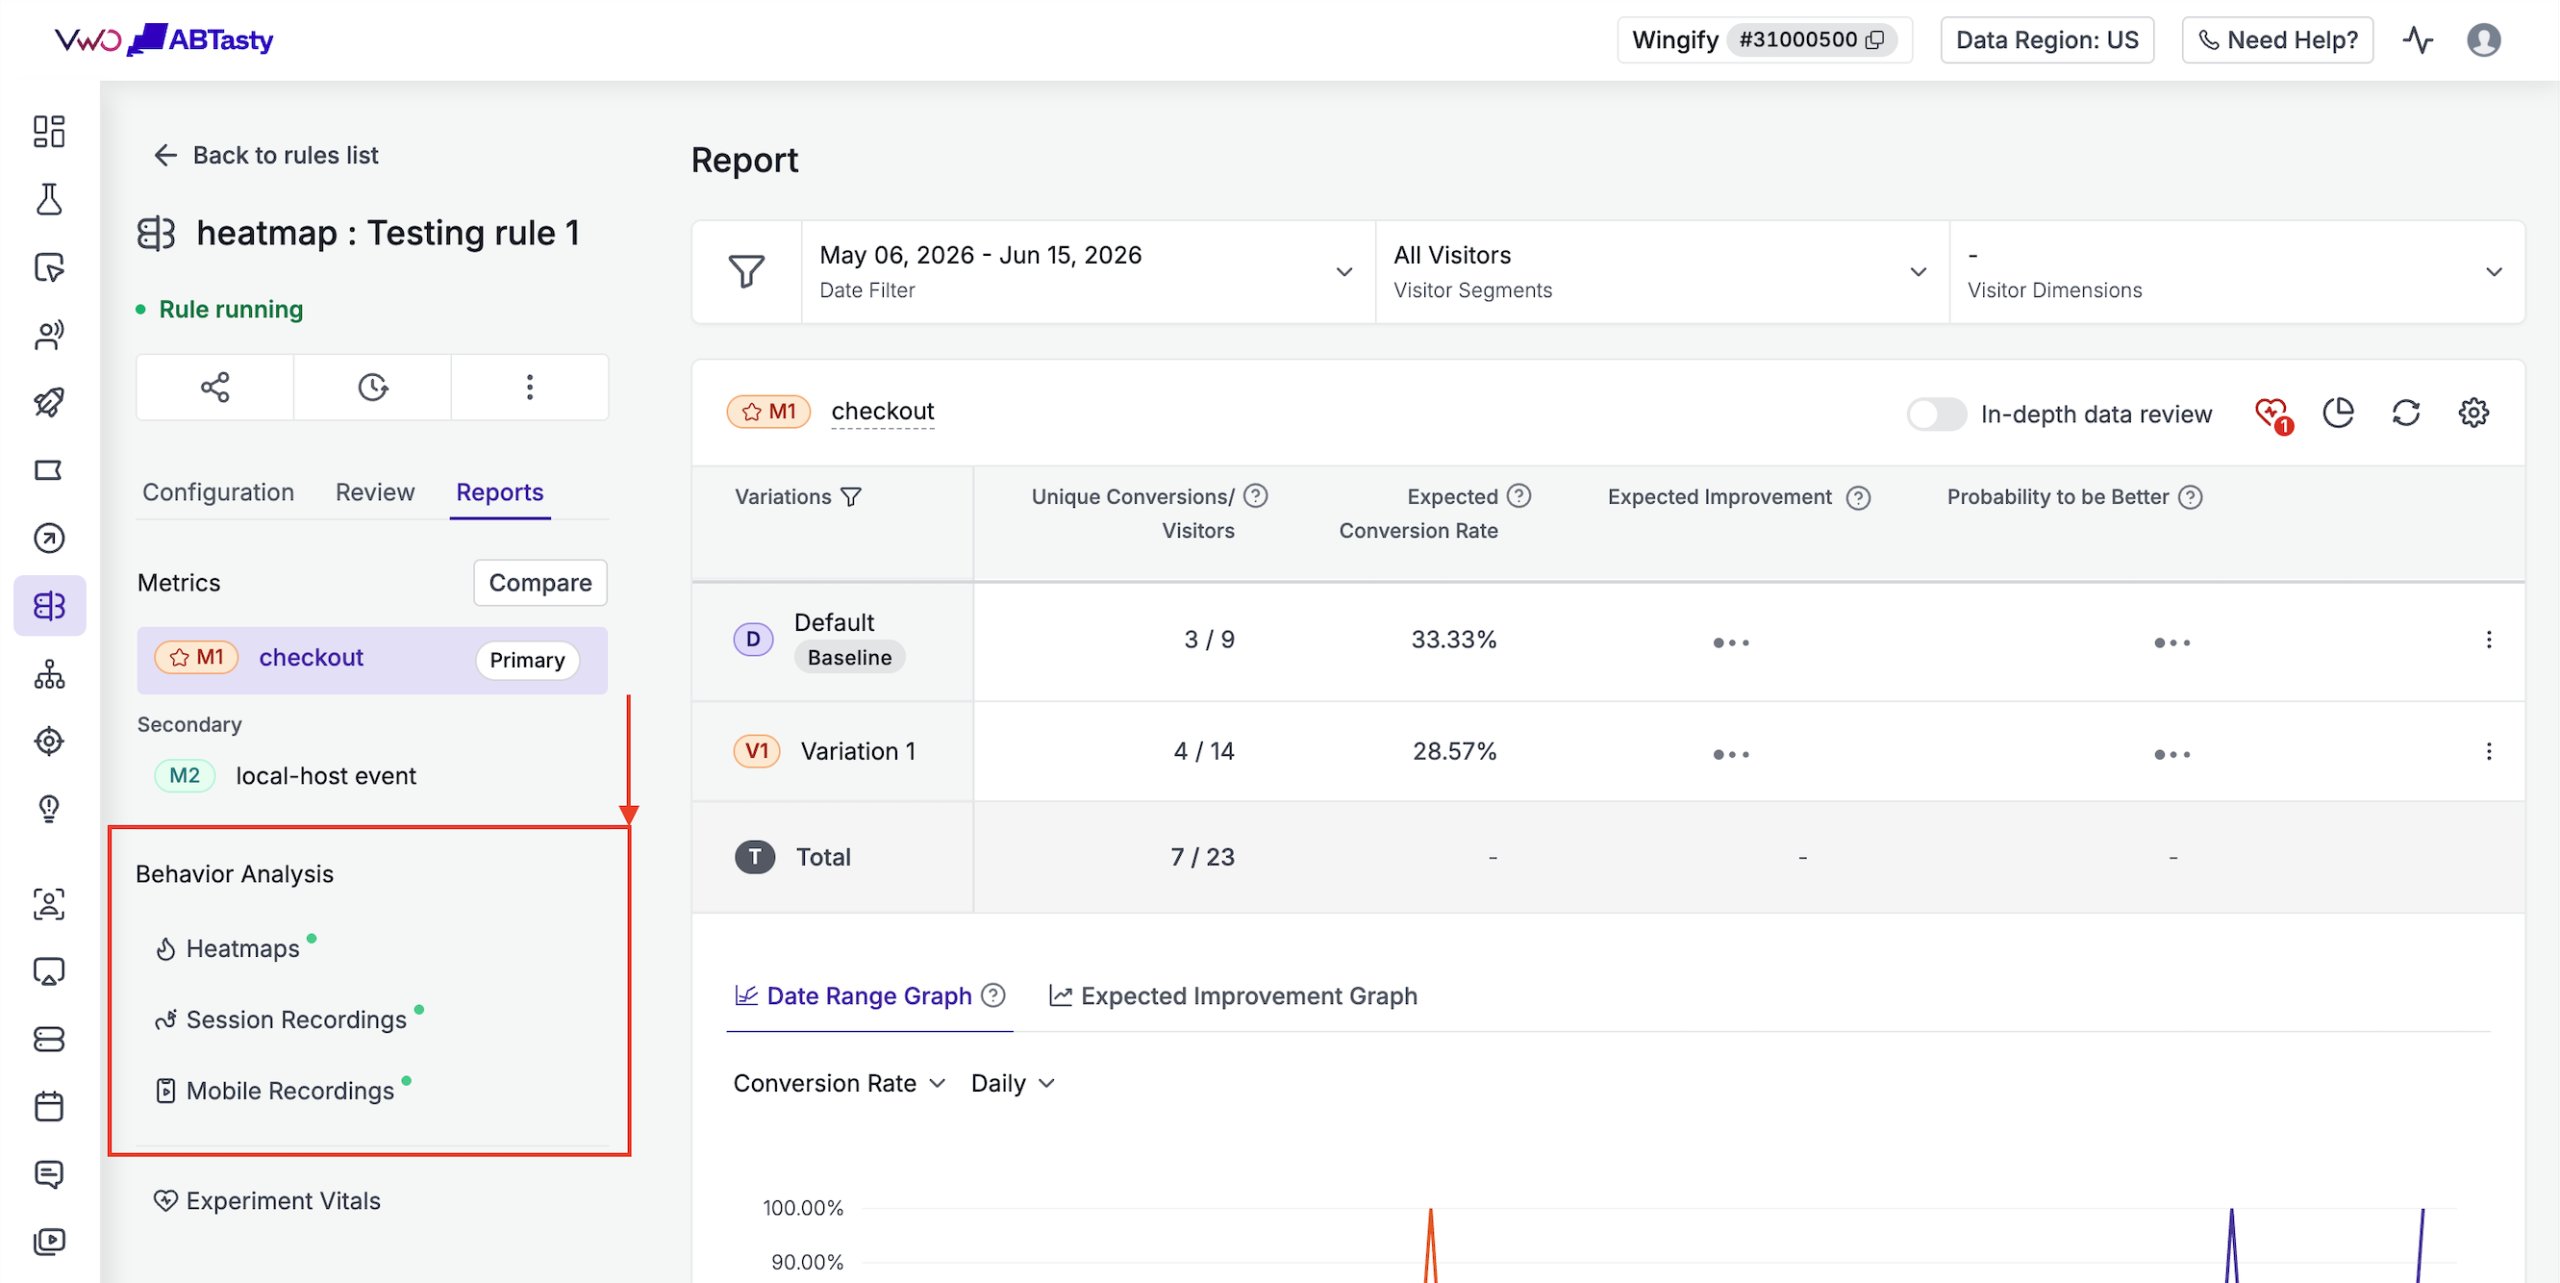
Integrated behavioral analysis tab in campaign reports: Every FE campaign report now has a dedicated “Behavioral Analysis” tab with heatmaps, session recordings (for website and mobile apps), pre-filtered to that campaign. No more jumping between tools and context switching.
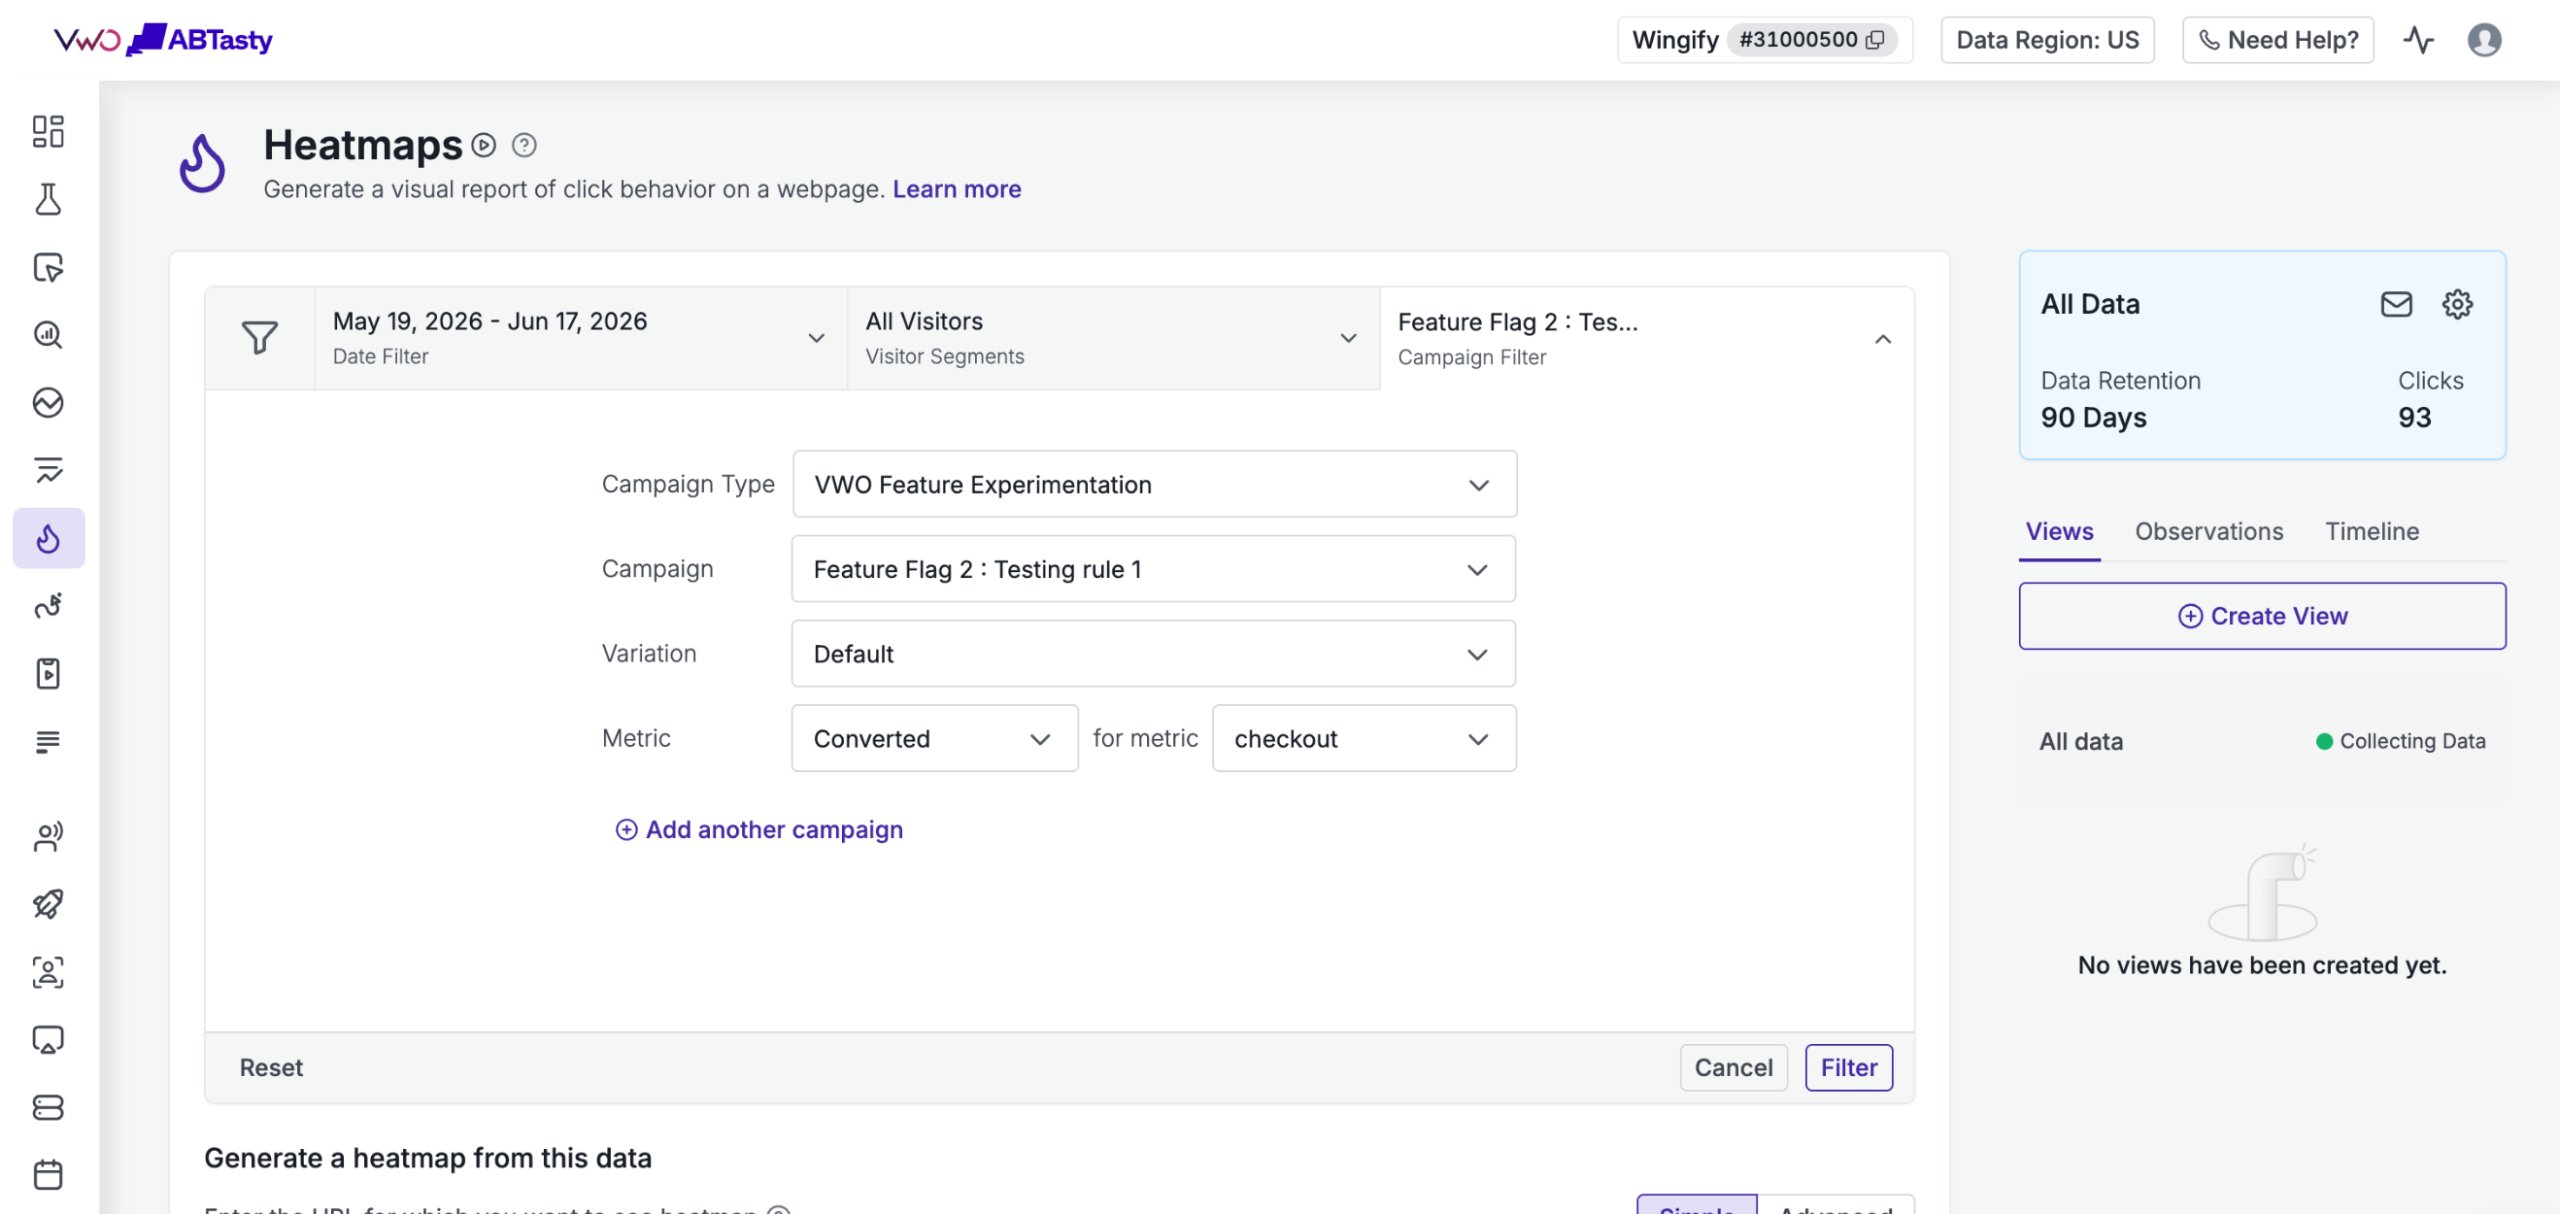
Access from Insights: Any heatmap, recording, or funnel in Insights can be filtered by FE campaigns, specific environments, campaign rules, or test variations. That way, you can go deep into behavioral patterns for any experiment you’ve run.
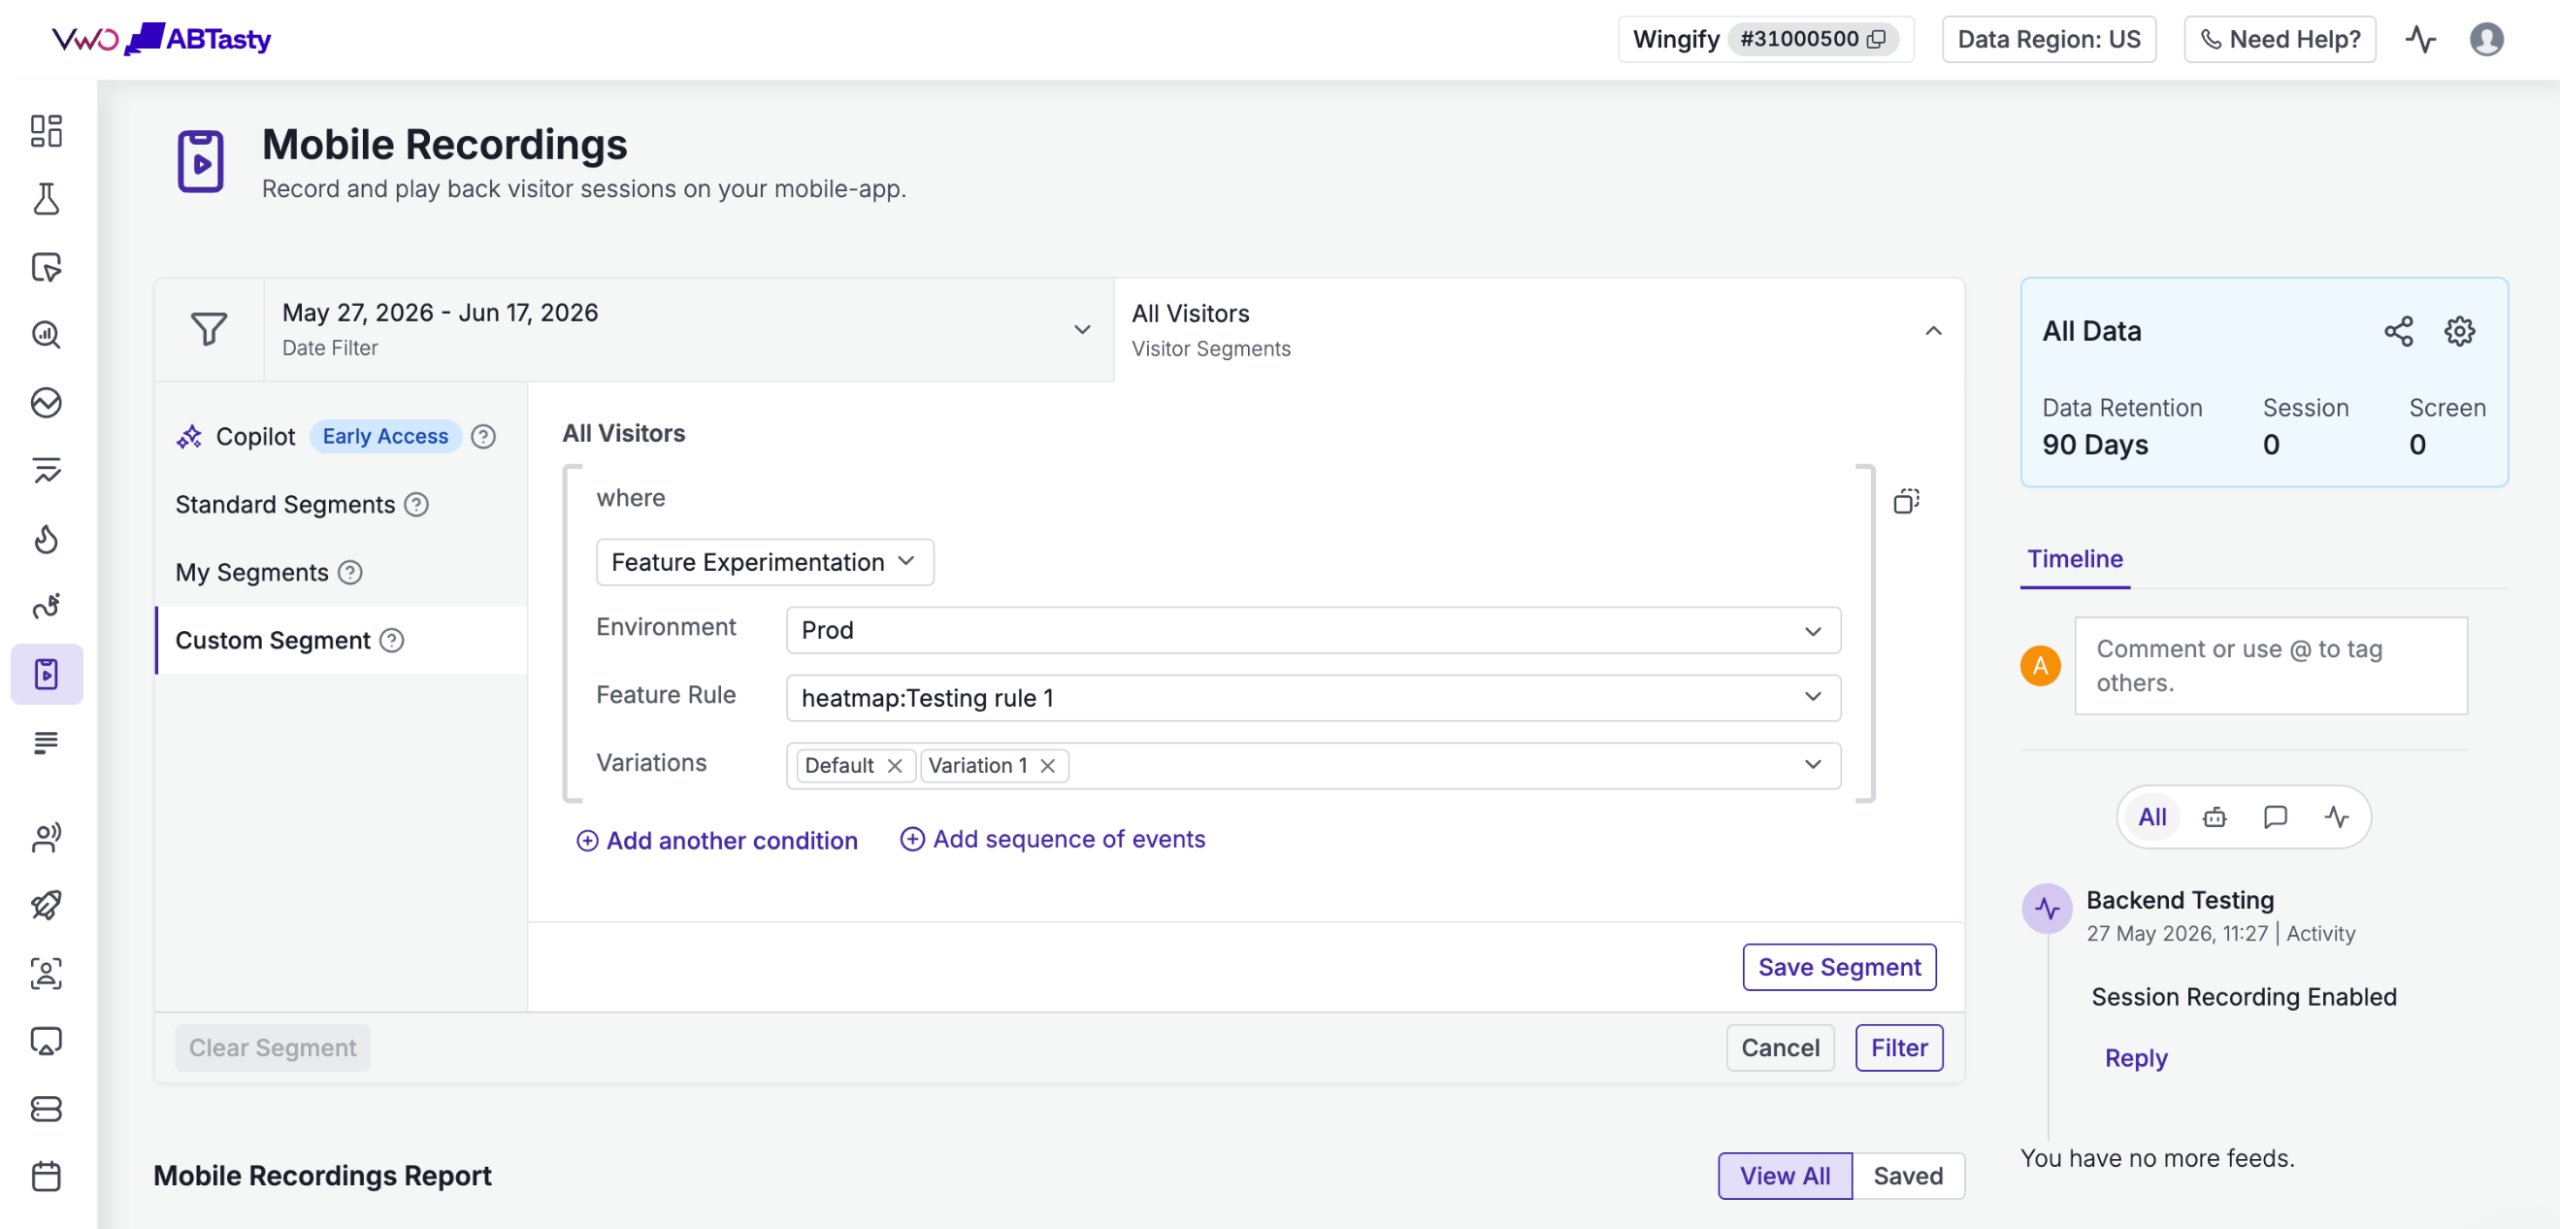
Enter from mobile app recordings & heatmaps: Extend the same behavioral analysis to mobile app experiments, with screen taps, user flows, and sessions linked directly to your mobile SDK-powered tests.
How does it help your team?
For E-commerce & Retail:
You launched a new product recommendation engine for your mobile app. It lifted AOV, but bounce rate also rose. The recordings reveal users’ attention drifted from purchasing the product, to browsing the “You might also like” section, to check more options. You fix its position, not the algorithm. Without behavior analysis, this insight would have been hidden.
For SaaS & Software:
The trial onboarding test for your webapp is failing, but the metrics don’t explain why. Using session recordings and heatmaps, you spot a clear drop-off happening at the second step of the flow. Users took a lot of time entering their webpage URLs to configure your product, and when they entered, there were many rage clicks on the “proceed” button. With that insight, you’d know for which field you need to reduce friction in the trial flow (maybe add a regex option for URLs). That way, you catch the flaw before it drags the lead count down.
For News & Media:
Heatmaps could reveal that in the test, where you are testing a new ad placement section, the ads are getting drastically low clicks. Session recordings reveal that users are seeing a cookie consent pop-up on top of it. Rookie mistake, yes. Happens to everyone, but would you have known the reason by just looking at statistical numbers?
See the full picture of your experiments today.
Behavior Analytics in Feature Experimentation is rolling out now to all customers on Pro & Enterprise plans of both Feature Experimentation and Insights.
To get started, open an Feature Experimentation campaign report and click the new “Behavioral Analysis” tab.
Questions or feedback?
Reach out to your Customer Success Manager, or email us at support@wingify.com.
We’re all ears.


