
From generating quality leads to driving more traffic to your website, the efforts invested in B2B marketing are nearly twice as much as compared to any other industry, especially B2C.
Each lead is a potential customer, which means everything done in the process demands utmost precision – taking the right steps to highlight your brand’s USPs, personalizing the customer experience, optimizing the sales funnel, offering a fluid and easy-to-navigate website, and so forth.
Download Free: Website Heatmap Guide
Also, low traffic and low search volume are a constant challenge for most B2B companies, which makes it even more important for them to continuously improve page performance and optimize conversion rates.
But, how do you ensure that the efforts you’re taking to make your B2B marketing campaign successful will definitely show results? This is where behavior analytics tools like heatmaps come into play.
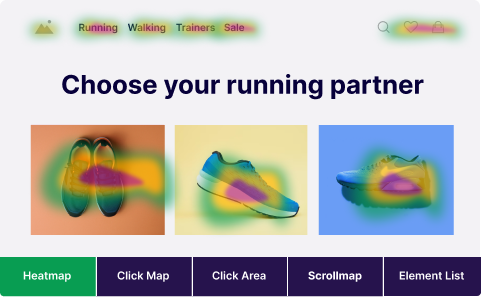
Heatmap is a smart analytical tool that makes use of color codes to highlight web page areas where customer attention is concentrated the most. The hotter the area, the more traction it is getting, and vice versa. Typically, shades of red depict the highest customer-attention-grabbing areas, while shades and blue and green represent the opposite.
Let’s move forward and see how heatmap optimization can help you maximize your B2B marketing efforts and achieve business ROI.
How do heatmaps serve as the ultimate diagnostic tool?
Website heatmaps are a handy and powerful tool for B2B marketers.
A typical heatmap analysis reveals key insights about user behavior on a website such as areas of high engagement, sections that visitors ignore, and also key elements that need more visibility.
It provides useful data (in the form of graphically represented color codes) about page areas that are performing well or need improvement, and helps you form data-backed hypotheses to optimize these areas.
1. Get an instant overview of key web performance parameters
Unlike other quantitative data like bounce rate or time spent on a page, heatmaps give B2B marketers deeper insights into user behavior.
They highlight the areas of problems or opportunities and enable marketers to make informed decisions.
2. Explore key insights in a better way
As they say, “A picture speaks a thousand words.” Similarly, a single heatmap speaks a thousand numbers.
Hard statistical numbers entered in a spreadsheet may tell you that a particular page has low user engagement, or that a given page element is not yielding the results as expected.
However, a heatmap instantly gives you a visual representation of how visitors are interacting with your website. Moreover, it also helps you identify potential friction points or distractions that are impacting conversions.
For example, when you analyze a heatmap, you easily notice elements or sections that receive low engagement as compared to other areas. Based on this information, you can redesign the layout to ensure that key details about your product are visible in areas that receive higher engagement.
Also, you can opt for tools like VWO Insights – Web that offers heatmaps and other important behavior analytics features so that you can easily optimize experience roadblocks, and increase chances of conversion.
3. Understand key concepts of web design
In the case of web design, gathering important learnings can help B2B marketers understand their site and audience behavior in a better manner.
While surveys and forms have their own role to play, they are certainly prone to some form of bias – what they reflect may not necessarily be the exact thing users do on your website.
Here, heatmaps come in handy. They serve as a better and more powerful tool to analyze the navigational patterns of users on your site which helps gather data that’s accurate and untampered in nature.
Combine heatmaps with A/B testing, and your learnings become predictive without being obstructive.
For instance, Sumo is a SaaS-based company that used heatmaps to study the performance of various elements of their homepage. The study revealed that:
- The “About” page link got maximum clicks.
- Visitors clicked on “Get Started” and “Watch Video” the most.
- Visitors clicked on the down arrow even though it did not work.
- While the individual tools got a lot of clicks, the ones highlighted on the right side of the page got fewer clicks.
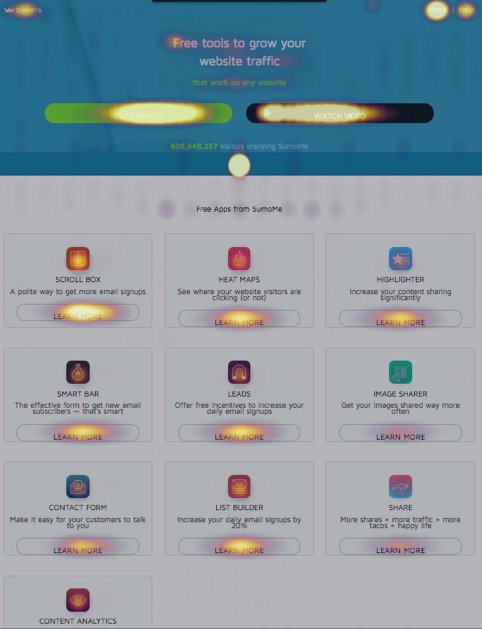
Based on these insights, Sumo made some key changes to the page which eventually led to an increase in conversions.
Download Free: Website Heatmap Guide
4. Analyze CTA performance in a better way
Every call-to-action (CTA) button placed on your website has its own conversion goal. It is important to ensure that your CTAs are receiving the desired attention.
With heatmaps, you can easily analyze whether your CTAs are receiving enough attention and how users are interacting with them.
For example, let’s say you’ve recently redesigned key elements of your landing page. However, soon after the redesign your analytics tool shows a huge drop in CTA clicks.
While this is crucial information, it does not reveal the reason for this sudden drop. In this scenario, you decide to analyze the heatmap of the landing page to understand why users are not clicking on your CTA.
When you observe the heatmap, you notice high engagement on the new banner that was recently added at the top of the page. However, due to this banner, your primary CTA now appears just below the first fold of the page.
The heatmap also reveals low engagement in the area below the first fold.
This is crucial data that can help you make informed decisions and changes on the landing page. Based on these insights, you can either change the placement of the CTA button or you can decide to remove the banner itself from the page.
Moreover, you can use A/B testing to confirm these hypotheses and optimize the performance of your CTA button on the landing page.
5. Optimize your lead generation forms
Forms play an essential role, especially when it comes to B2B businesses.
They help in gathering essential information about customers visiting your site. Such information is crucial from the sales point of view. Optimizing them can significantly help in improving conversions.
While many theories follow on how to use a form, or what must be its content, the ideal way to test which type of form would yield the best results is to make use of heatmaps.
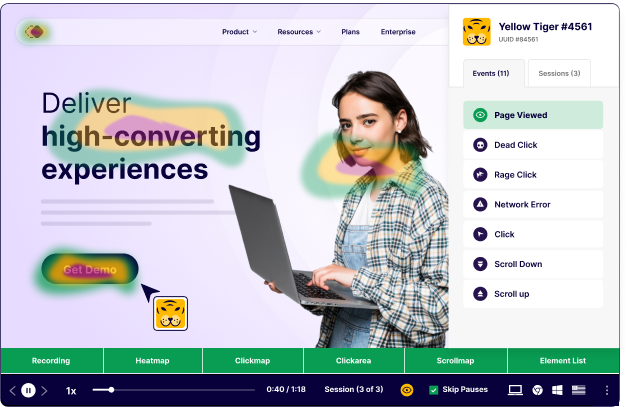
Let’s take an example of a SaaS company. The company notices low conversions on one of the demo request forms placed on the home page.
To understand more about this problem, they observe the heatmap for this particular section of the page. During their analysis, they noticed that the product video placed next to the form received good engagement, however, the form itself has low activity.
Based on these key insights, the team realized that the product video was probably distracting visitors from the demo request form. They hypothesized that decluttering this particular area would make it easier for visitors to notice the form.
To confirm this, the team can run an A/B test and solidify their findings.
In a nutshell, heatmaps offer an additional lens to find qualitative insights to help you discover problematic areas and make necessary amendments to enhance conversions.
6. Understand how visitors interact with your content
Inbound marketing and content marketing are two powerful tools for any B2B business. Hence, having well-crafted content that’s sufficiently infused with valuable information on your website is highly essential, especially from a traffic and conversion standpoint.
Scrollmaps, another form of heatmaps, offer useful data on the performance of these two key elements.
They provide strong, reliable information about how visitors are moving through your content – how far they’re scrolling through the page, the parts where they are getting distracted, the links they’re clicking, and so on.
Such information can help you analyze where to place your CTA and important links to increase lead generation.
How does the heat mapping capability in VWO Insights – Web help B2B marketers?
Besides the use cases discussed above, customers of VWO Insights in the B2B marketing space have improved their business metrics via heatmaps by generating more informed experimentation hypotheses, analyzing where and why users drop off in the conversion funnel, resolving UX issues at scale, and backing their redesign ideas with data. You can read important case studies explaining this in detail in this blog.
Bottom line
Heatmaps are one of the most effective analytical tools to help B2B marketers better understand customer behavior, and derive valuable qualitative insights for website optimization.
Moreover, heatmaps can also boost your A/B testing efforts as they help you gain deeper insights into every action that visitors take on your website, enabling you to form better hypotheses for your tests.
Apart from heatmaps, there are a plethora of other behavior analytics tools that you can use to optimize your B2B website such as session recordings, form analysis, surveys, and so on.
Try VWO Insights – Web for free today to uncover the ‘why’ behind every action, and improve your visitors’ online experience.
Categories:


![Top 10 Shopify Heatmap Apps [With Features – 2026]](https://static.wingify.com/gcp/uploads/sites/3/2020/04/Feature-image_Shopify-Heatmaps-All-you-need-to-know.png?tr=w-300,h-150)


