Running a handful of experiments every quarter on high-impact pages can generate measurable gains with relatively simple tooling and workflows.
At that stage, experimentation is controlled, linear, and easy to reason about.
But as businesses grow, so does the number of things worth testing. More pages, more products, more campaigns, and more teams create more opportunities to improve performance.
What works for a small experimentation program often starts to break down as testing volume increases. Traffic gets split across experiments, implementation queues grow longer, and coordinating tests becomes more difficult.
If experimentation is expected to contribute meaningfully to growth, it needs to scale beyond occasional tests run by your team. This guide covers the systems, processes, and infrastructure required to scale A/B testing without compromising experimentation velocity or test reliability.
Benefits of A/B testing at scale
Scaling A/B testing shifts experimentation from a tactical activity into a growth infrastructure. Every team, product, marketing, and engineering starts making decisions backed by evidence generated at the speed the business actually moves.
1. Higher conversion rates across the full funnel
At scale, teams aren’t waiting for one test to conclude before starting the next. Experiments run simultaneously across multiple elements: CTAs, layouts, checkout flows, and onboarding sequences, which means improvements compound faster and revenue impact accumulates across the funnel rather than one page at a time.
2. Faster learning cycles
Testing multiple hypotheses simultaneously compresses the learning cycle. Winning ideas get validated and shipped faster; losing ideas get eliminated before consuming more resources, reducing the cost of failed assumptions. This reduces the cost and risk of acting on incorrect assumptions and helps teams make decisions based on evidence rather than opinion.
3. Personalization through segmentation
As audience diversity increases, aggregate conversion rates become less useful as a decision signal. Mature experimentation programs use audience segmentation to evaluate how different user segments respond to the same experience, leading to more personalized experiences for each segment.
For example, a pricing page variation may improve conversion rate for first-time visitors while reducing engagement among returning users already familiar with the product. Without segmentation, those segment-level losses can remain hidden behind positive averages.
4. Reduced rollout risk
Mature experimentation programs often evolve beyond traditional A/B tests into feature experimentation and progressive rollouts. By validating new features on controlled traffic segments before full release, teams can reduce deployment risk while maintaining confidence in business and user experience outcomes.
5. Smarter resource allocation
As experimentation volume grows, traffic and engineering bandwidth become constrained resources.
Scaled experimentation enables teams to identify which ideas, product changes, and optimization opportunities generate the greatest business impact. This helps organizations focus resources on high-value initiatives rather than spending time on low-impact tests.
For example, instead of allocating an entire sprint to testing minor headline variations, a team may prioritize experiments that influence average order value, checkout completion, or customer retention because improvements in these areas typically have a larger impact on business outcomes and revenue.
I always use a classic ICE score: Impact, Confidence, Ease, because that ultimately makes the most sense. Sure, sometimes you have quick wins where you say, ‘Honestly, it’ll only take five minutes, then we can run it, it won’t affect any other tests, let’s go.’ But otherwise, it’s always: How big is the leverage? How confident are we about what we want to test? And how quickly can we implement it? Then we start where the leverage is high and the effort is low, typical low-hanging fruit for growth, and work our way up from there. It’s a really good tool for a structured approach.
Antonia Grzelak, Manager of Growth & Innovation at FUNKE Works (Source: VWO Podcast)
Signs your A/B testing program is not scaling effectively
If any of these sound familiar, these are the symptoms that show up before teams realize scaling is the problem, not the tests themselves.
1. Tests are running for weeks without reaching statistical significance
The team keeps extending durations or calling tests early. Neither feels right, but the backlog isn’t clearing, and there’s pressure to move. Usually, a sign that traffic is fragmented across too many concurrent experiments, rather than a traffic volume problem, reduces the ability to generate meaningful results.
2. Winning variations aren’t going live
The test concluded with a significant result three weeks ago. It’s still in the deployment queue. A growth team completing 15 successful experiments in a quarter but deploying only five isn’t an experimentation problem; it’s a release coordination problem.
3. Testing platform and analytics platform don’t agree
The experiment shows a statistically significant lift. GA4 shows no measurable change in completed purchases for the same period. Once teams reconcile two sources of truth before every rollout decision, experimentation velocity slows quickly.
4. The backlog is full, but hypothesis quality is dropping
Test ideas that were already invalidated keep resurfacing because results aren’t documented anywhere findable. New ideas filling the gaps are low-signal: headline variations disconnected from funnel friction, cosmetic UI changes, and marginal CTA differences. The program looks active, but the win rate is falling because the tests being run don’t deserve the traffic they’re consuming.
5. Results keep contradicting each other
Let’s say a test on one page shows a lift and a nearly identical test on another page shows the opposite. This pattern typically points to an inconsistent test setup, like different statistical models, different traffic allocations, or no mechanism to prevent audience overlap between concurrent tests.
6. Test velocity stays flat even as the team grows
Adding headcount to a CRO or growth team should accelerate experimentation output. When it doesn’t, the constraint is usually a process bottleneck in ideation, development, review, or analysis, not team motivation or capability.
7. Leadership disengages from test results
When executives stop asking about testing outcomes, the reason is almost always eroded trust. Past results didn’t hold up in production, or the outputs were never clearly connected to the business metrics leadership actually tracks.
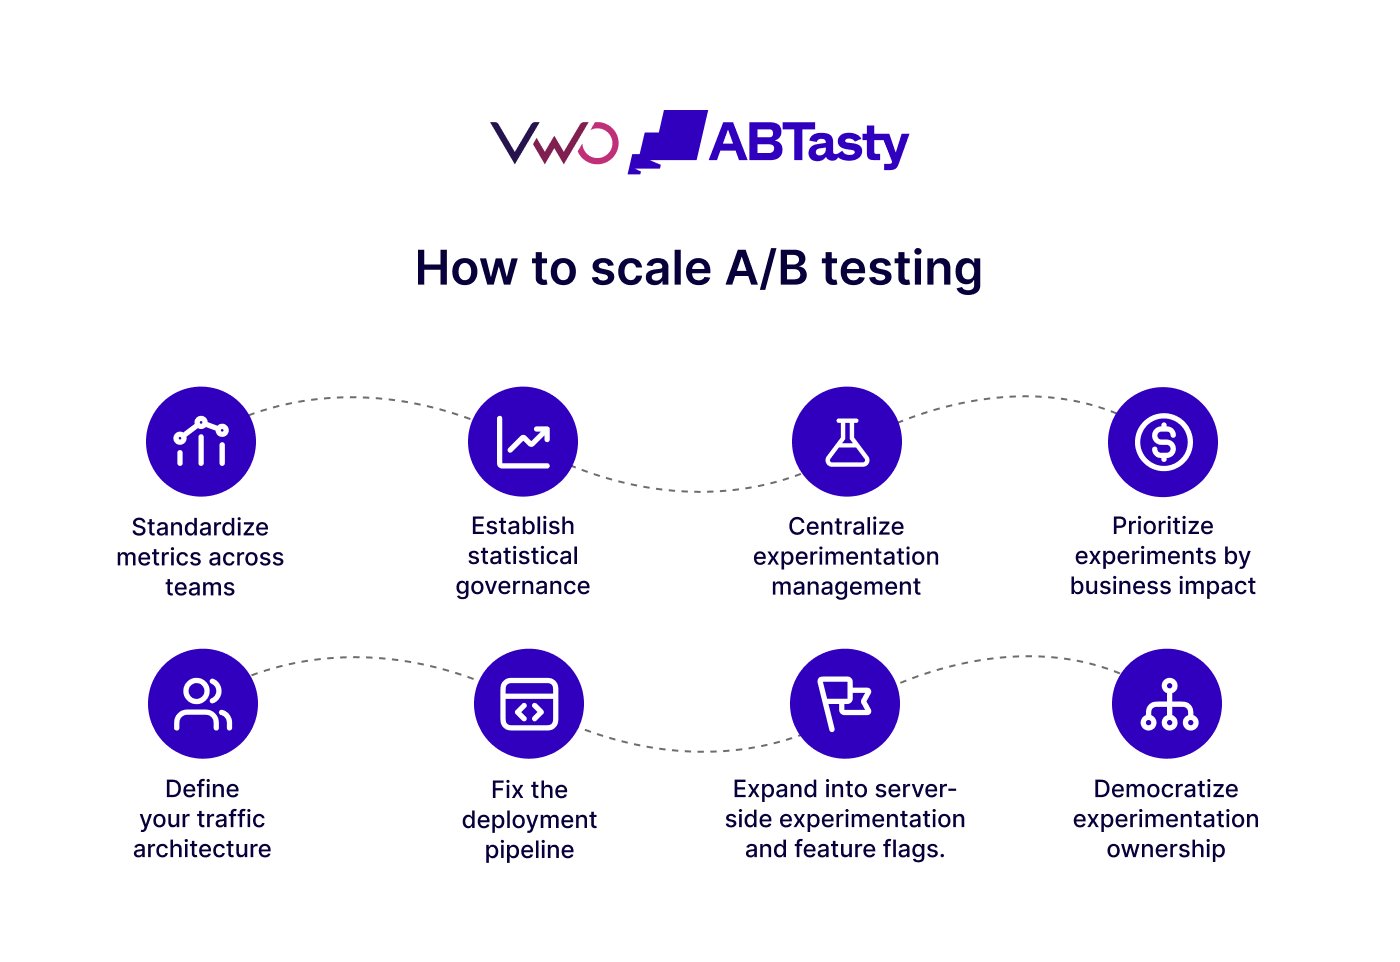
How to scale A/B testing: Know the right steps
Step 1: Standardize metrics across teams
Before increasing test volume, establish consistent definitions for conversion rate, activation, retention, attribution windows, and guardrail metrics to ensure every team interprets test results the same way, making statistically significant results actionable across product, marketing, and growth without debate
Primary metrics define whether different test variations succeeded. Guardrail metrics define whether it caused harm elsewhere in the funnel. Both need to be defined before a test launches, not after results come in.
Step 2: Establish statistical governance
Embedding statistical controls into experimentation workflows: pre-launch sample size calculation, fixed end dates, predefined primary and guardrail metrics, and SRM checks in every test review, ensures that scaling test volume yields reliable learning rather than an accumulation of false positives. These controls should be embedded into experimentation workflows rather than relying on manual enforcement by individual analysts.
Step 3: Centralize experimentation management
A centralized hypothesis repository, a shared test log with results and segment findings, and consistent documentation standards ensure institutional knowledge stays intact as programs and teams grow. This layer allows learning from each test to feed directly into the next hypothesis cycle rather than disappearing when team members change.
Step 4: Prioritize experiments by business impact
Not every experiment deserves equal traffic. Use ICE or PIE scoring to rank tests by impact, confidence, and ease before they enter the queue. Prioritize experiments tied to revenue, checkout completion, activation, and retention. This keeps sufficient traffic focused on tests that move business metrics rather than fragmenting it across low-signal ideas.
Step 5: Define your traffic architecture
Decide how concurrent experiments will share traffic before scaling volume. Map which experiments need mutual exclusion, which can run on non-overlapping segments, and which should target specific cohorts. Establish rules around audience overlap, shared funnels, and experiment ownership before scaling volume, not after results start contradicting each other.
Step 6: Fix the deployment pipeline
Audit the gap between test conclusions and live deployments. Front-end changes should deploy directly from the testing platform without a code release. Server-side changes should be driven by feature flag toggles rather than sprint cycles. This is the single change that most directly increases the number of validated improvements that reach users per quarter.
Step 7: Expand into server-side and feature flags
Client-side testing covers front-end changes, including A/B and multivariate testing for layouts, messaging, and UI elements. Everything else: pricing logic, onboarding sequences, recommendation systems, checkout behavior, and feature access requires server-side capability. Feature flags extend this by enabling controlled rollouts: deploy to a small percentage of users first, validate behavior, and expand only when the data holds up, making high-risk experiments safer to run at scale.
Step 8: Democratize experimentation ownership
Democratizing experimentation empowers teams across the organization to contribute ideas, build hypotheses, and run experiments within their areas of expertise.Marketing teams run acquisition experiments. Engineering teams run backend experiments. Each operates autonomously within the governance framework built in earlier steps: shared metric definitions, statistical standards, and a centralized hypothesis repository. The role of the central experimentation team evolves from running every test to enabling experimentation at scale through training, governance, quality assurance, and knowledge sharing.
Key strategies for large-scale A/B testing
1. Feature rollout
Feature flags allow teams to progressively expose a change to a controlled percentage of users, monitor real-world performance, and expand or retract the rollout without requiring a full redeployment cycle.
This approach is particularly valuable for backend functionality, recommendation engines, pricing logic, and personalization systems where a traditional front-end A/B test may not be feasible. Beyond experimentation, feature rollouts reduce release risk by allowing teams to validate performance, stability, and business impact before exposing a feature to the entire user base.
VWO Feature Experimentation supports server-side experiments, feature flags, and controlled rollouts. Engineering and product teams can manage feature exposure independently of front-end code changes, significantly speeding up the experimentation cycle for technical teams. It’s designed for environments where features ship continuously and teams need a controlled mechanism to validate impact before committing to a full release.
2. CUPED and variance reduction
When organizations increase the number of concurrent experiments, traffic becomes fragmented across tests, extending the time required to reach statistical significance. CUPED (Controlled-experiment Using Pre-Experiment Data) reduces metric variance by incorporating pre-experiment behavioral data into the analysis.
By lowering variance, teams can detect meaningful effects with fewer users and shorter run times, helping experimentation programs maintain velocity even when traffic is distributed across dozens or hundreds of active tests.
3. Standardize experiment templates
Rebuilding instrumentation and tracking setup for every new experiment adds overhead that slows throughput at scale. Standardized templates for common test types and reusable testing elements, such as landing page tests, checkout flows, and onboarding experiments, reduce per-test setup time and keep data consistent across teams.
4. Mutually exclusive groups
With concurrent test volume increasing, users exposed to multiple experiments simultaneously produce results that reflect combined treatments rather than independent ones.
VWO’s Mutually exclusive campaign groups (MEG) ensure that users are assigned to only one experiment within a group, with server-side controls for priority and traffic weight. Multiple exclusion groups create a layered architecture: users can participate in one experiment per layer simultaneously, enabling high concurrency without cross-experiment contamination.
5. Segment-level analysis before rollout
Aggregate results become less useful for rollout decisions when experiments span multiple products, regions, acquisition channels, and audience cohorts. A variant showing a 6% overall lift may still be harming a high-value segment underneath the average. Segment-level analysis helps preserve visibility into audience-specific behavior so important segment insights are not lost as experimentation volume increases.
6. AI-assisted experimentation
As experimentation programs scale, it becomes increasingly difficult to analyze large amount of behavioral data, identify optimization opportunities, document learnings, and manage growing volumes of data.
AI helps by identifying friction points, uncovering behavioral patterns, accelerating research analysis, assisting with prioritization, and automating routine experimentation tasks.
By reducing the manual effort required throughout the experimentation lifecycle, AI enables teams to process more insights, launch experiments faster, and scale testing programs without needing to increase resources at the same pace.Watch the webinar to learn how AI can help improve experiment velocity.
Pro Tip!
Use VWO AI to speed up hypothesis generation, variation creation, behavioral analysis, and audience targeting, reducing the manual overhead that slows programs down as test volume increases.
Metrics to track for A/B testing at scale
1. Program-level metrics
These tell you whether the experimentation program is scaling effectively, where throughput is breaking, where quality is degrading, and whether the infrastructure is holding up under volume.
Test velocity: completed tests per month or quarter.
Win rate: the percentage of tests producing a statistically significant improvement on the primary metric.
Implementation rate: the percentage of statistically significant winners that get deployed.
Time from insight to deployed variation: the end-to-end cycle from behavioral observation to a winning variant live in production.
Experiment coverage: the percentage of key funnel stages with active or recently completed experiments.
Sample ratio mismatch (SRM): a check that the actual traffic split matches the intended split.
2. Business and revenue metrics
Direct measures of commercial impact are used to confirm that winning tests deliver business value, not just a behavioral shift that appears positive on the testing dashboard.
Average order value (AOV): the average transaction value per completed purchase.
Revenue per experiment: estimated lift multiplied by traffic volume and AOV, giving a dollar value to each winning variant.
Plan upgrade rate: the percentage of users moving to a higher-value plan, relevant especially for SaaS/subscription-based experimentation programs.
Holdout group delta: the revenue difference between treated users and a persistent holdout group that received no test treatments. The only metric that measures actual aggregate program revenue impact rather than assumed compounding of individual wins.
3. North star metrics
Business and revenue metrics should ultimately connect back to the company’s broader north star metric, the long-term growth indicator the organization optimizes around.
Without this connection, experimentation programs often struggle to justify continued investment from leadership because individual test wins remain disconnected from strategic business outcomes.
For example:
An eCommerce company may optimize around repeat purchase rate or revenue per customer.
A SaaS company may focus on weekly active teams or retained subscriptions.
A services marketplace may prioritize successful bookings or customer retention rate.
At scale, the strongest experimentation programs are not just improving isolated funnel metrics. They are systematically contributing to the company’s long-term growth model.
Every company needs a north star metric, but that’s often where the conversation stops when it should be where it starts. The north star exists to create strategic alignment. It needs to reflect something real about value generation — qualified pipeline, recurring revenue, retention — not a proxy that looks good on a dashboard but drifts from what the business actually needs. Getting that definition right matters more than most teams realize, because everything downstream is calibrated against it.
Carlos Neto, Growth Specialist at Benner (Source: CRO Perspectives)
Case studies of companies that successfully scaled experimentation
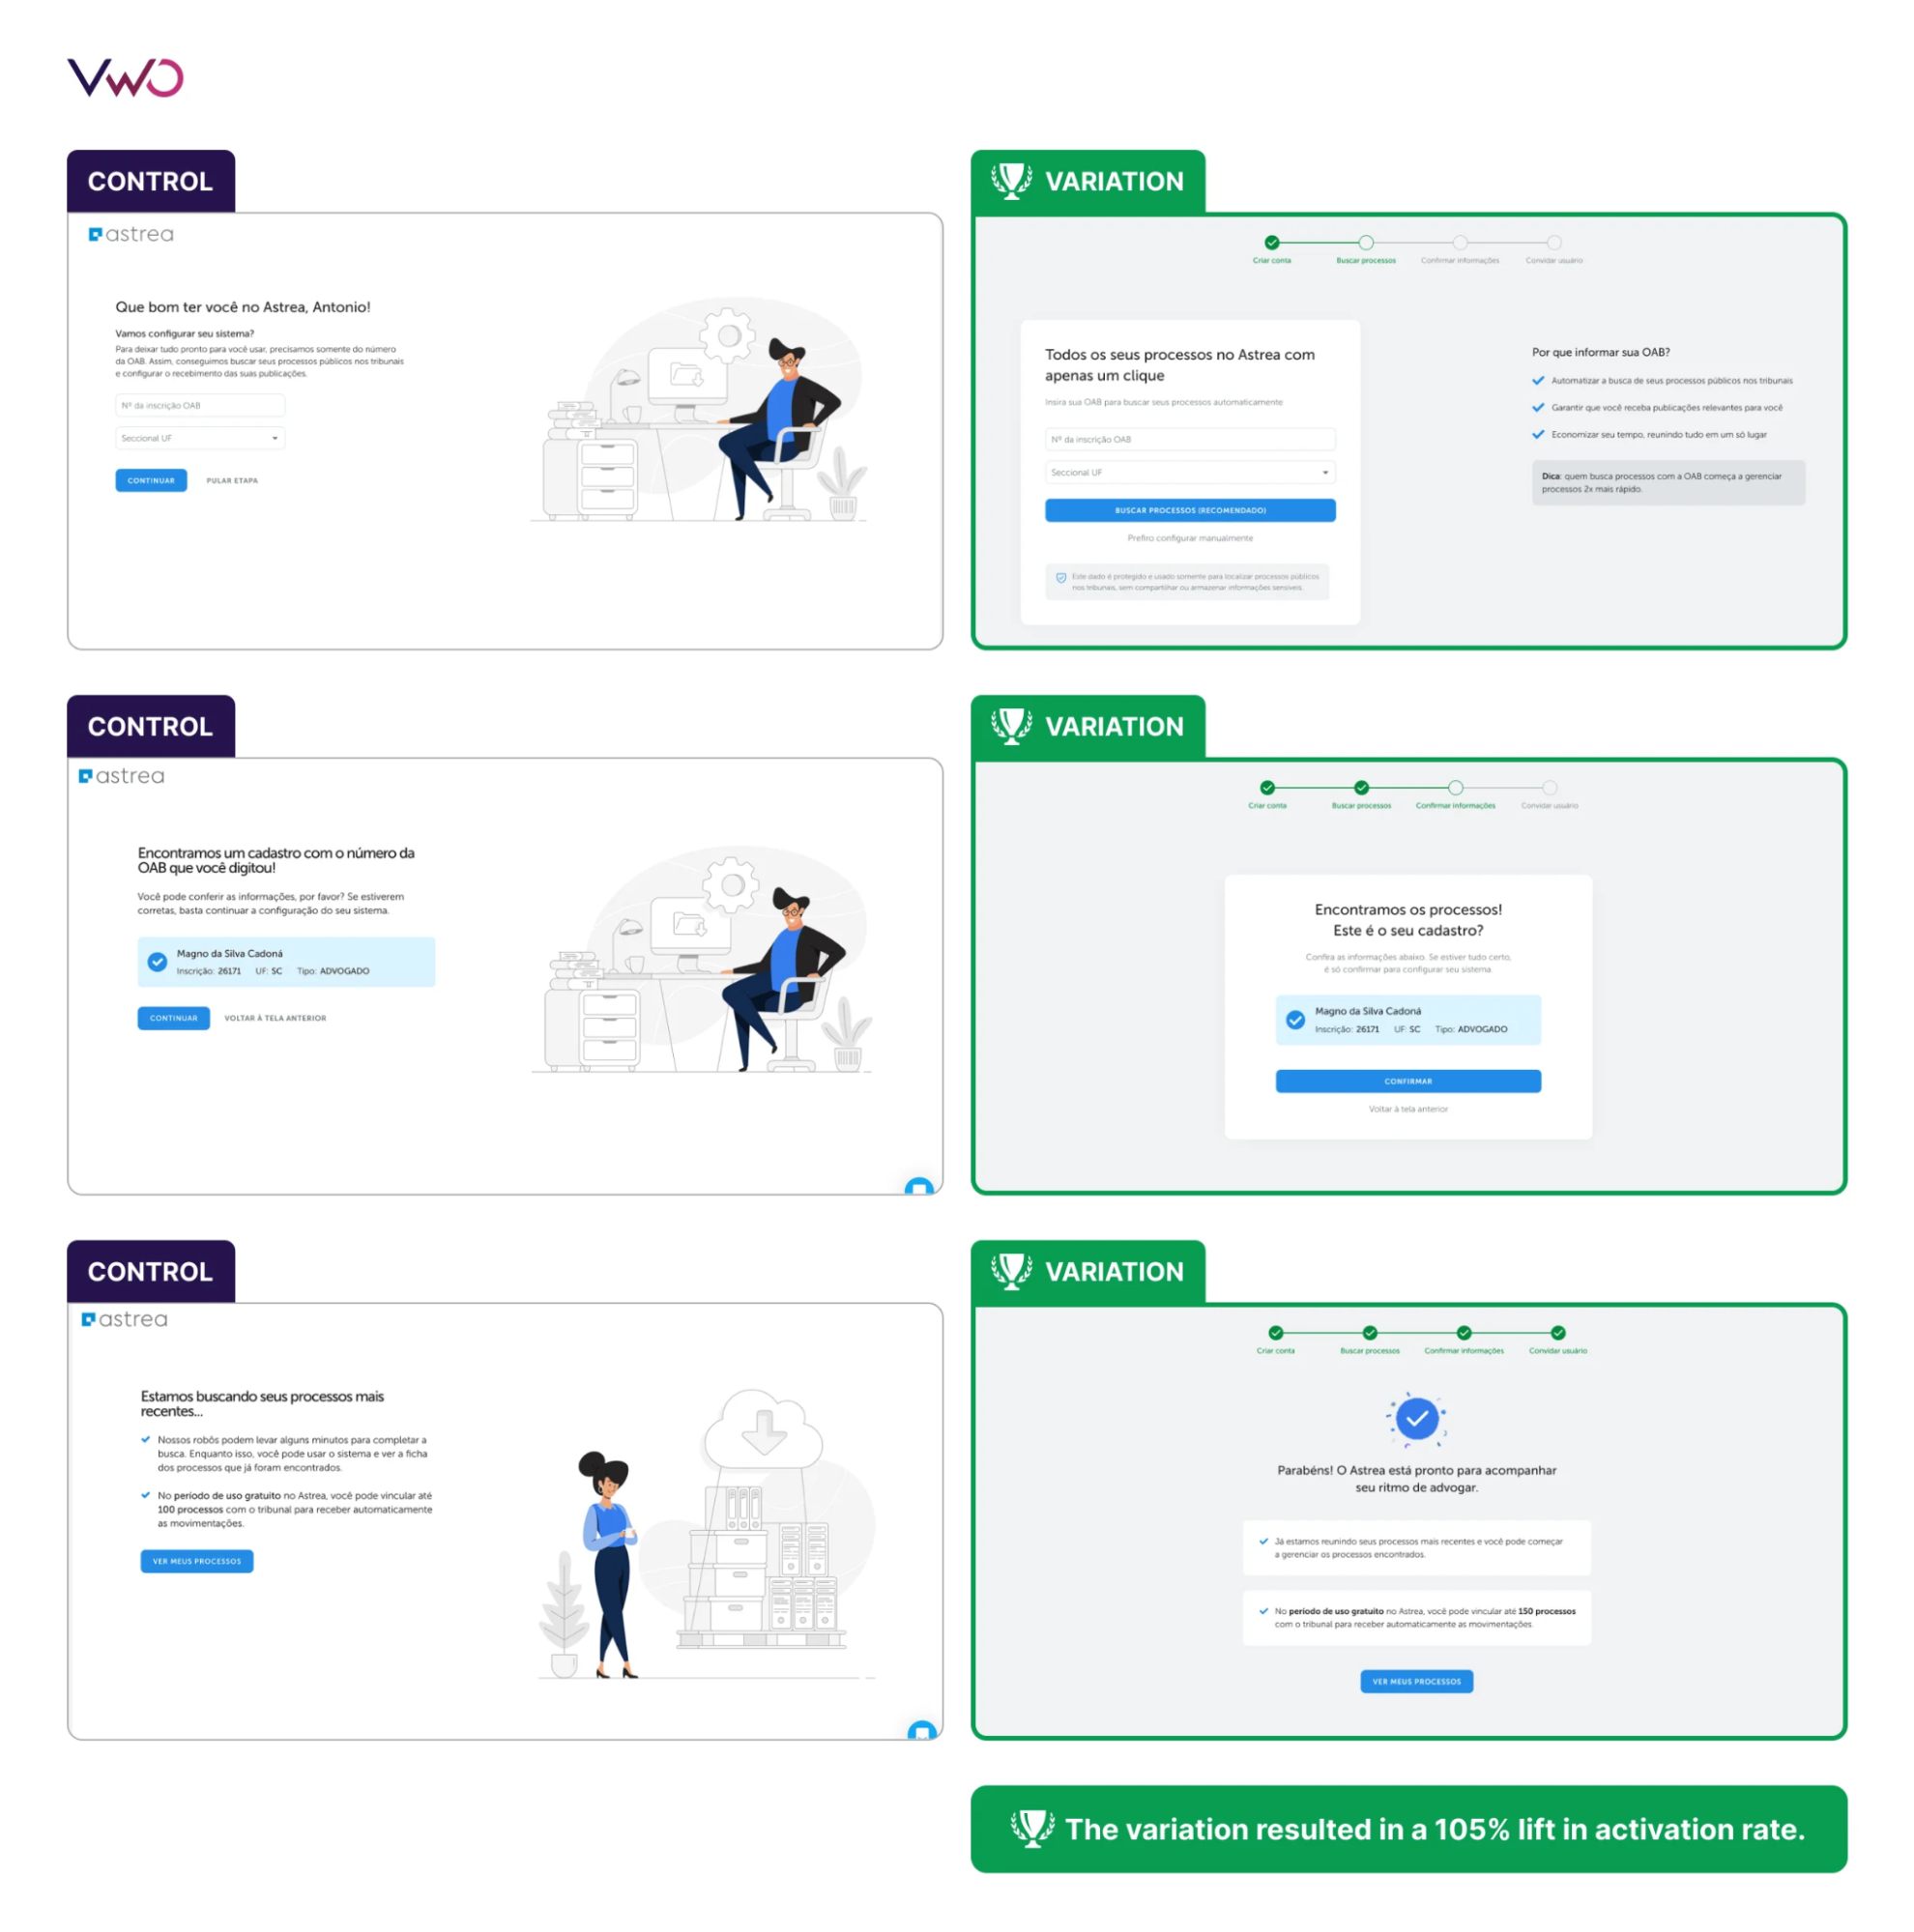
Case study 1: AURUM drove 4× higher trial activation with structured experimentation
AURUM, a legal technology company, wanted to improve activation inside the 10-day free trial for its practice management platform, Astrea. The team found that delayed access to legal clippings, a core product input, prevented users from experiencing the platform’s value quickly, increasing abandonment risk and slowing activation.
With VWO Feature Experimentation, AURUM ran A/B tests across the onboarding-to-activation pathway, including guided onboarding flows, onboarding checklists, and backend-enabled retroactive clipping access, to accelerate users’ time-to-value for the core product feature.
The experiments resulted in 4× increase in activation rate over the course of a year. This goes onto show how AURUM embedded experimentation directly into its product and growth workflows, driving improvements in activation that contributed to long-term retention.
Aurum’s streamlined onboarding journey
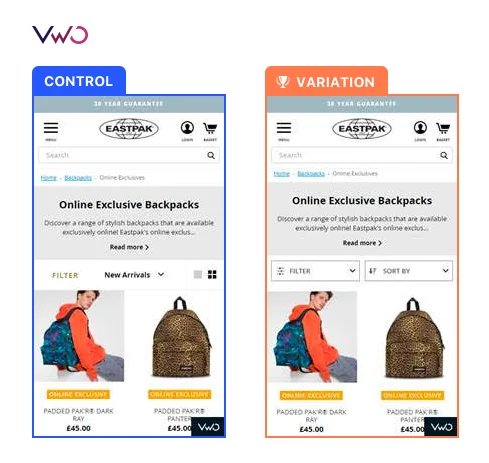
Case study 2: Eastpak scaled experimentation across 12 European sites
Eastpak, the global accessories and travel brand, wanted to move beyond limited, outsourced A/B testing and build a scalable experimentation culture across its 12 European websites operating in 8 different languages. The company struggled with low testing velocity, disjointed systems, and heavy reliance on development teams to deploy experience changes.
Using VWO Insights, Eastpak pinpointed opportunities for improvement across its digital experience. VWO Testing helped the team evaluate and validate changes across multiple markets, while VWO Web Rollouts enabled front-end updates to be deployed across all 12 websites without developer involvement. Together, these capabilities helped Eastpak bring experimentation in-house and scale it across the organization.
The program helped Eastpak improve filter interactions by 106% and increase checkout click-through rate by 14%. More importantly, experimentation evolved from isolated CRO activity into a centralized operational workflow across merchandising, marketing, product, and UX teams.
Eastpak’s stickied filter bar
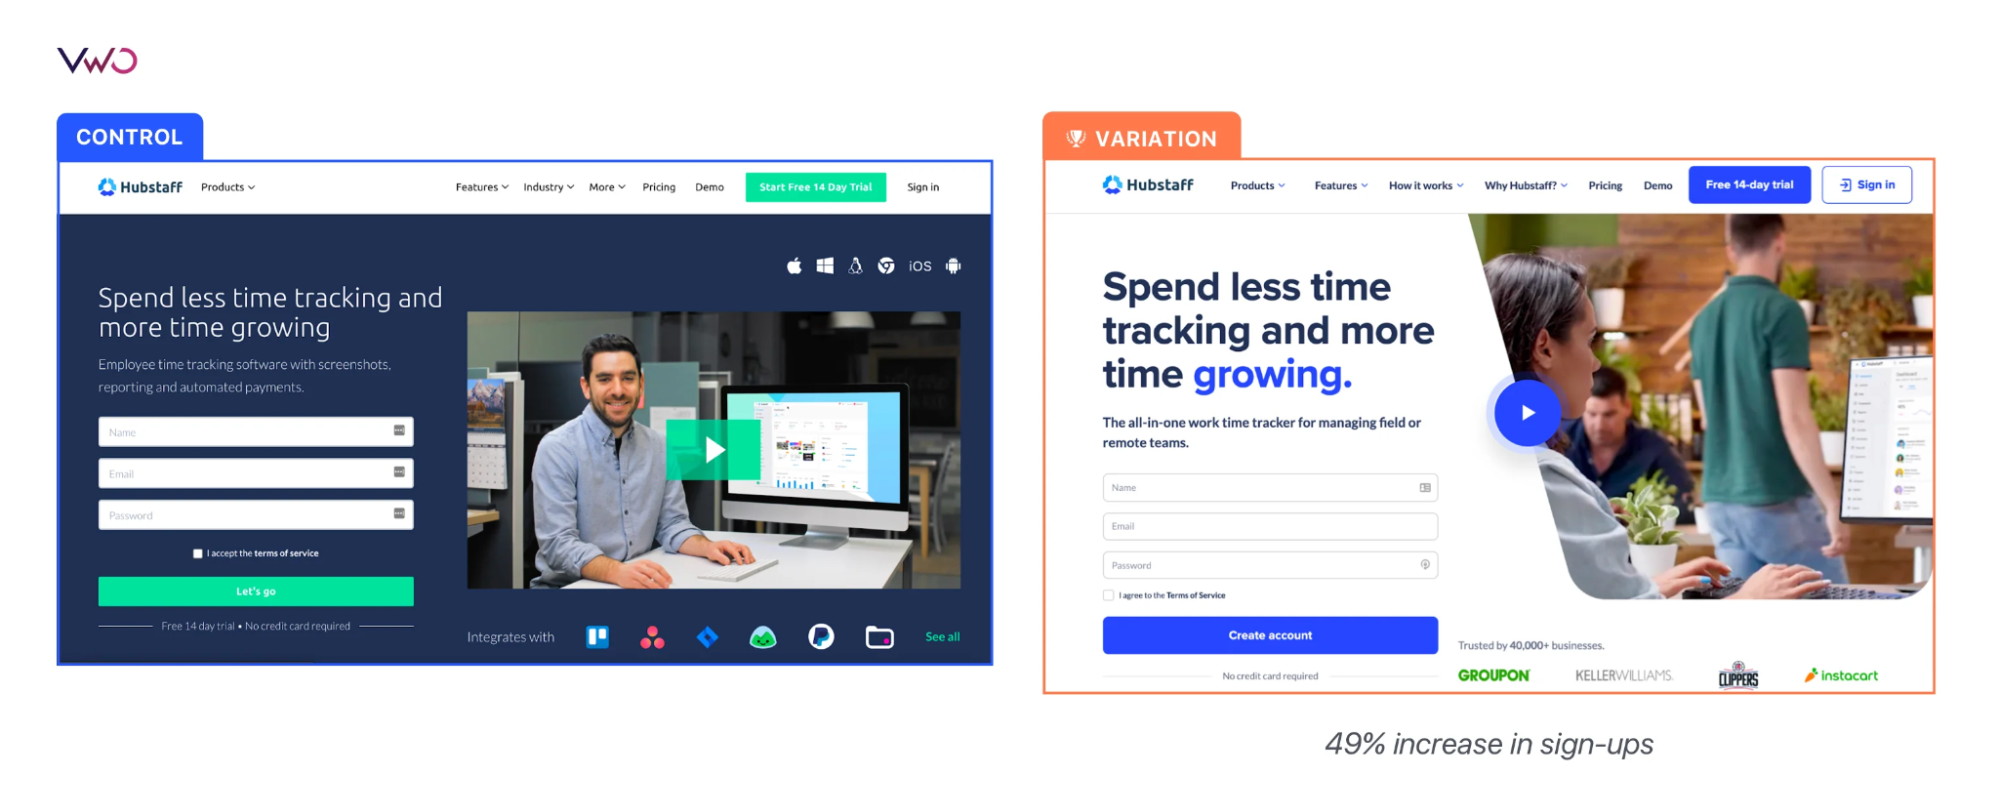
Case study 3: Hubstaff scaled from UI tests to homepage experiments
Hubstaff, a workforce management platform, evolved its experimentation program from testing isolated elements like headlines and buttons to running multiple concurrent experiments tied directly to broader product and marketing strategy. At any given time, the company runs at least five active experiments across its website.
One of Hubstaff’s largest experiments involved a complete homepage redesign. Because the homepage directly influenced trials and paid conversions, the team wanted to validate the redesign safely before rolling it out across the rest of the site.
The team used VWO Testing to run a split URL test while tracking across visitor-to-trial conversion, hero form submission, on-page engagement, pricing page views, and full-funnel journey, with heatmaps running alongside to capture behavioral signals during the test.
The experiment resulted in a 49% increase in visitor-to-trial conversions and a 34% increase in homepage form submissions. Overall, with VWO’s platform, Hubstaff was able to sustain a steady testing cadence and run multiple experiments simultaneously without sacrificing the depth of analysis behind each decision.
Hubstaff’s homepage redesign
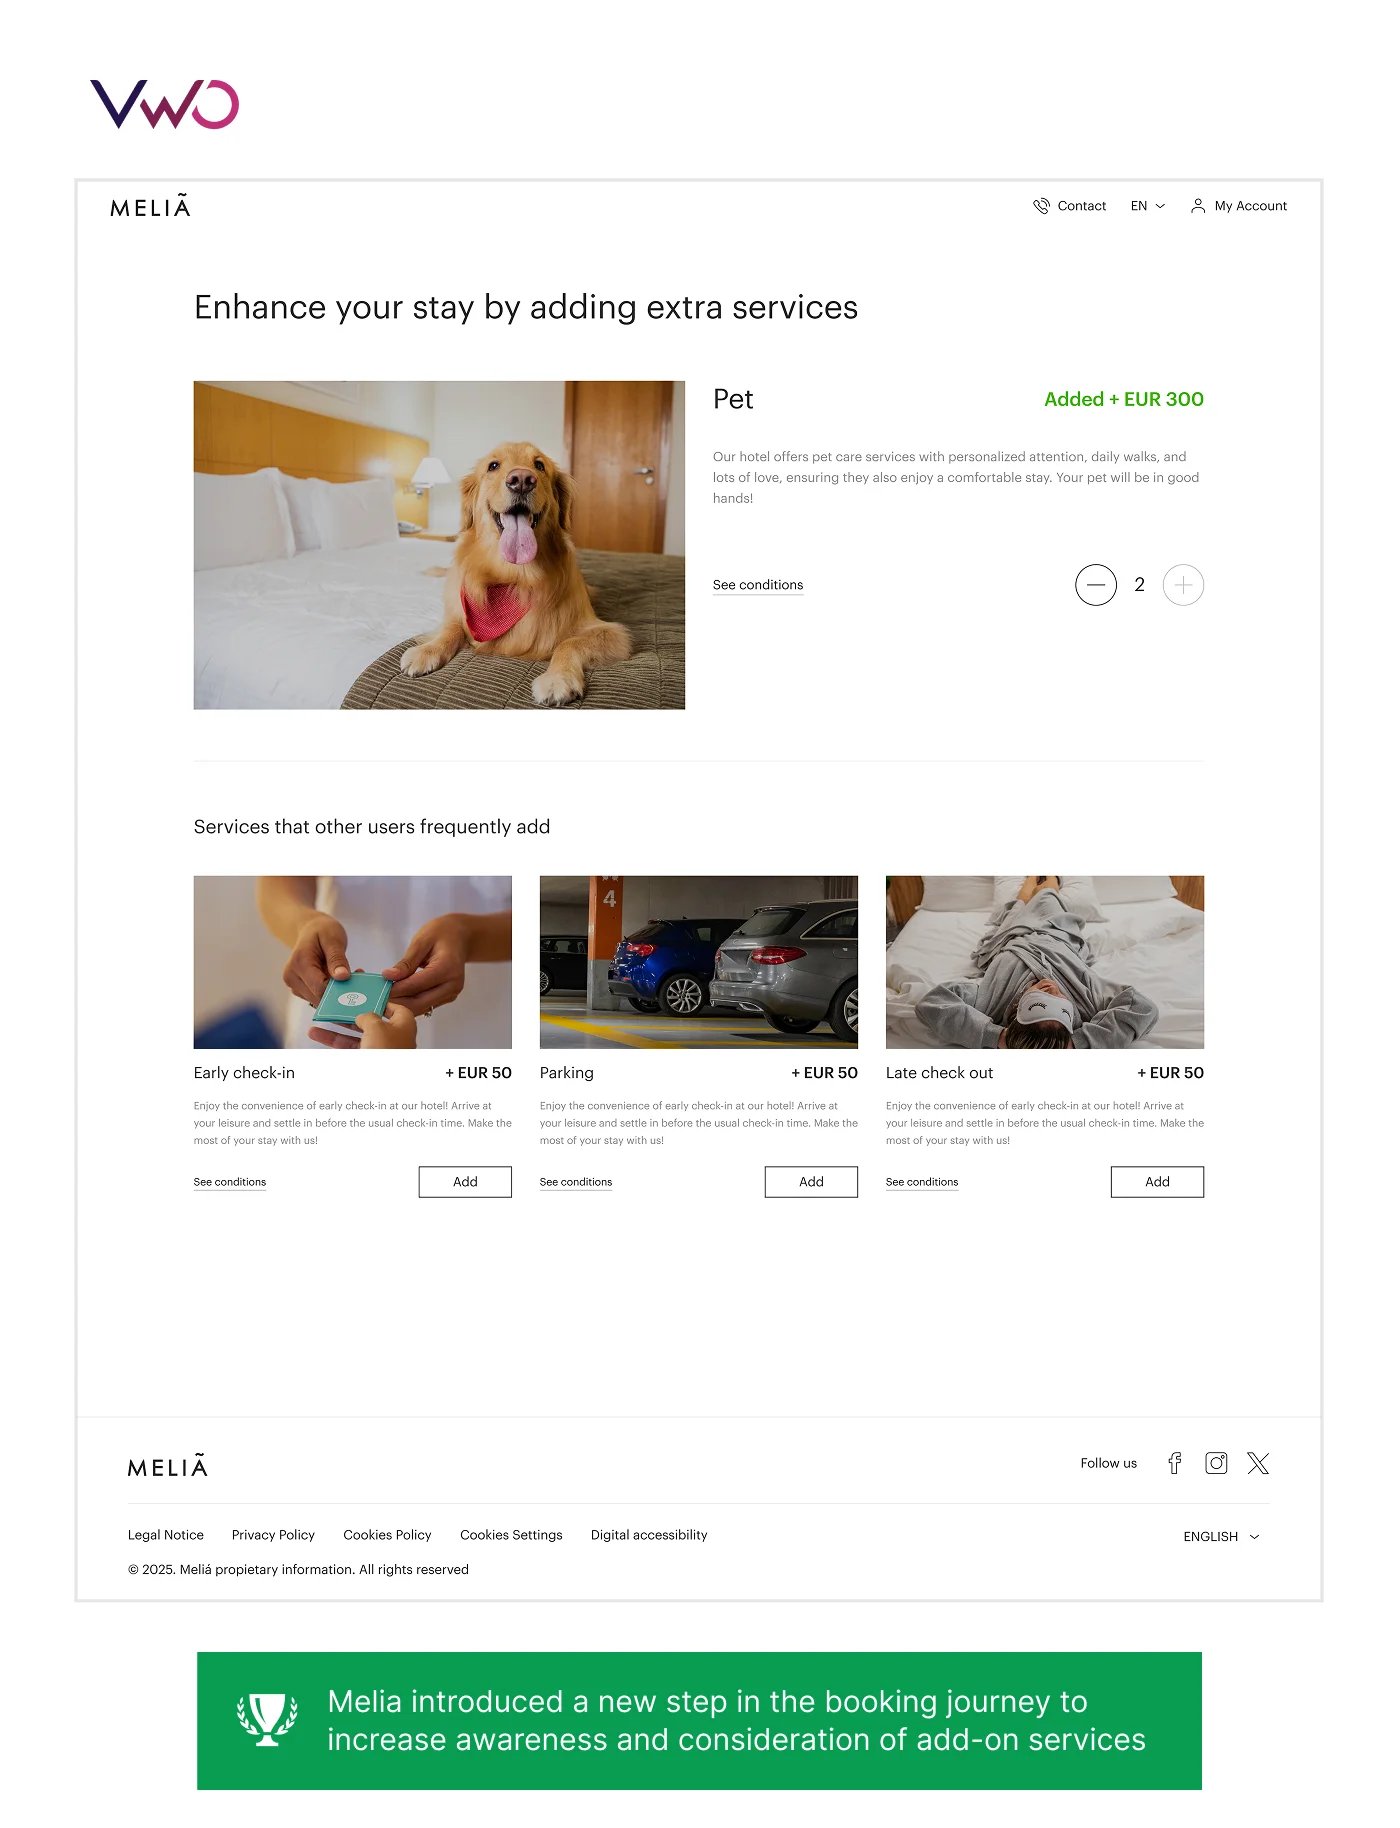
Case study 4: Meliá Hotels controlled rollout risk with feature flags
Meliá Hotels International wanted to increase visibility for add-on services like pet care, parking, and early check-in by introducing an additional step earlier in its booking funnel. However, adding extra steps inside a high-converting booking flow risked increasing user drop-offs.
Instead of releasing the change to all users immediately, Meliá used VWO Feature Experimentation to progressively roll out the new step from 5% to 100% of traffic within a week while monitoring funnel progression, guardrail metrics, and revenue impact through server-side experimentation and feature flags.
The rollout resulted in 1.85% uplift in revenue per visitor, 0.68% uplift in booking confirmations, and no measurable increase in funnel drop-offs. The success story highlighted how mature experimentation programs do more than improve conversion metrics. They enable organizations to de-risk new releases, validate business impact before full deployment, and roll out changes more confidently.
Case study 5: One Click Ventures increased testing velocity across three brands
One Click Ventures, a global eCommerce eyewear retailer, had no regimented testing methodology. Testing was ad-hoc, data was scattered across multiple tools, and there was no prioritization framework in place.
The team used VWO Insights to understand behavioral patterns, VWO Plan to prioritize testing opportunities, and VWO Testing to run experiments within agile sprint cycles. Together, these capabilities enabled a high-velocity experimentation process delivering 3 to 5 tests per week across the company’s three eyewear brands.
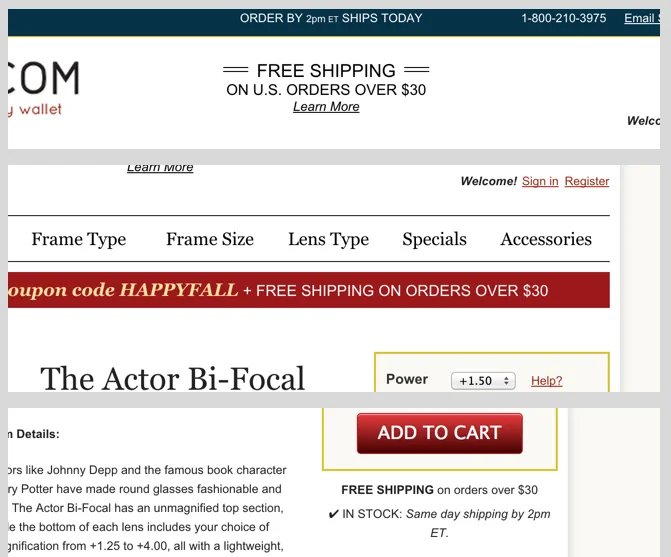
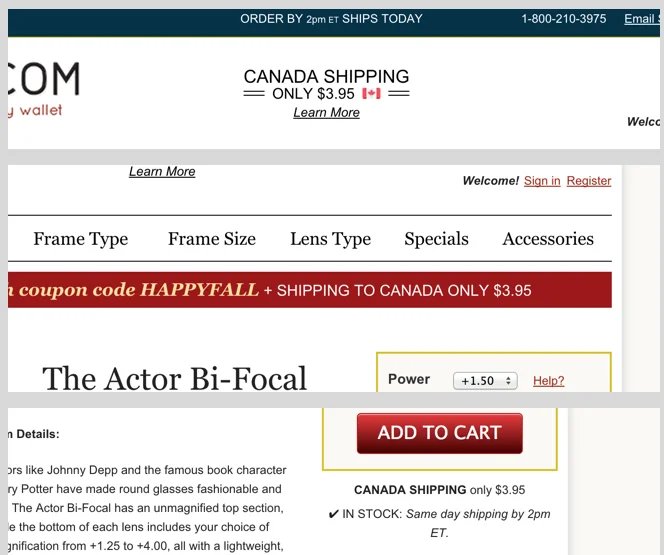
One experiment used geo-based personalization on checkout pages to localize shipping, currency, and delivery information by region, resulting in a 30% increase in conversion rate.
Another experiment tested product videos across product pages and identified a 10% increase in add-to-cart rate, leading the team to scale video content across the entire product catalog. Over time, experimentation became a core part of One Click Ventures’ optimization process, helping the company scale successful ideas across its three brands, increase testing velocity, and standardize optimization efforts across its digital experiences.
Geo-based messaging control image
Geo-based messaging variation image
Scaling starts before the next test launches
Scaling A/B testing is an infrastructure and governance problem before it is anything else. Teams that invest in traffic architecture, deployment pipelines, and cross-team governance before increasing test volume build compounding programs. Those who skip it get noise. Book a personalized demo or start a self-serve free trial to see how VWO provides the infrastructure needed to scale experimentation without compromising decision quality.
FAQs
What are common statistical errors in large-scale A/B testing?
The most common errors include peeking and stopping tests early, launching without pre-calculated sample sizes, p-hacking (selecting the primary metric after reviewing results), ignoring sample-ratio mismatches, and running concurrent tests on overlapping audiences without mutually exclusive groups. As experiment volume increases, these issues can inflate false positives and make results unreliable.
What defines a large-scale A/B test?
Large-scale A/B testing typically involves high experiment concurrency, multiple teams running tests simultaneously, advanced audience segmentation, server-side experimentation, or testing across multiple products, regions, or customer journeys. At this stage, experimentation requires governance, traffic allocation controls, and standardized statistical processes.
How can an A/B testing framework be successfully scaled?
Scaling an A/B testing framework usually requires: 1. Standardized statistical rules 2. Traffic governance 3. Faster deployment workflows 4. Behavioral analytics-driven hypothesis generation 5. Centralized experiment management 6. Server-side experimentation and feature flags for complex rollouts
What infrastructure is required to scale A/B testing?
Large-scale experimentation typically requires: 1. Experimentation platforms with server-side testing support 2. Feature flags and gradual rollouts 3. Behavioral analytics tools 4. Audience segmentation capabilities 5. Reliable event tracking 6. Experiment governance workflows 7. Integrations with analytics, CRM, and data warehouse systems As experimentation grows, infrastructure reliability becomes critical for maintaining statistical integrity.
How can a marketing team improve conversion rates with A/B testing at scale?
By connecting experiment results to full-funnel business outcomes instead of optimizing only for on-site conversion rate. A variant that increases sign-ups is not necessarily a win if the leads it generates have lower close rates or higher churn. CRM integrations that pass variation-level data into platforms like Salesforce or HubSpot help marketing teams evaluate lead quality, pipeline impact, and downstream revenue, not just the conversion metric reported inside the testing platform.
How can large companies overcome scaling issues in A/B testing?
arge companies usually overcome scaling challenges by introducing: 1. Traffic allocation rules 2. Mutual exclusion frameworks 3. Centralized experiment tracking 4. Automated reporting 5. Feature flag infrastructure 6. Segment-level analysis 7. Deployment workflows that reduce engineering bottlenecks Without these systems, experiment reliability and rollout speed often degrade as test volume increases.
What should a CRO lead focus on when scaling experimentation?
A CRO lead scaling experimentation should focus on: 1. Maintaining statistical reliability 2. Improving hypothesis quality 3. Reducing deployment bottlenecks 4. Preventing experiment contamination 5. Increasing the implementation rate of winning tests 6. Building experimentation workflows that scale across teams The goal is not just to run more experiments, but to increase learning velocity without weakening decision quality.
Hi, I’m Pratyusha Guha, manager - content marketing at VWO. For the past 6 years, I’ve written B2B content for various brands, but my journey into the world of experimentation began with writing about eCommerce optimization. Since then, I’ve dived deep into A/B testing and conversion rate optimization, translating complex concepts into content that’s clear, actionable, and human. At VWO, I now write extensively about building a culture of experimentation, using data to drive UX decisions, and optimizing digital experiences across industries like SaaS, travel, and e-learning.
Uncover hidden visitor insights to improve their website journey
One of our representatives will get in touch with you shortly.
Awesome! Your meeting is confirmed for at
Thank you, for sharing your details.
-
, you're all set to experience the VWO demo.
I can't wait to meet you on at
Account Executive
, thank you for sharing the details. Your dedicated VWO representative, will be in touch shortly to set up a time for this demo.
We're satisfied and glad we picked VWO. We're getting the ROI from our experiments.
Christoffer Kjellberg
CRO Manager
VWO has been so helpful in our optimization efforts. Testing opportunities are endless and it has allowed us to easily identify, set up, and run multiple tests at a time.
Elizabeth Levitan
Digital Optimization Specialist
As the project manager for our experimentation process, I love how the functionality of VWO allows us to get up and going quickly but also gives us the flexibility to be more complex with our testing.
Tara Rowe
Marketing Technology Manager
You don't need a website development background to make VWO work for you. The VWO support team is amazing
Elizabeth Romanski
Consumer Marketing & Analytics Manager
Trusted by thousands of leading brands
Awesome! Your meeting is confirmed for at
Thank you, for sharing your details.
Your Roadmap to Better Results
1:1 Demo customized to your industry and optimization goals.
Feature deep-dive into the user behaviour tools you need most.
No-pressure advice on the best path forward for your team.