

Checking your experiment early shouldn’t cost you accuracy or force you to learn statistics. Here’s how VWO lets you peek freely without sacrificing statistical validity, along with simulation results showing those guarantees hold.
Everyone running an experiment wants to know one thing early: is my variation winning yet? So they look. Then they look again. It feels harmless, but repeatedly checking a test and stopping the moment it looks significant quietly breaks the statistics underneath.
Spotify’s engineering team illustrates this neatly: a test designed with a 5% false-positive rate, under repeated checks, can quickly encounter a false-positive rate that severely exceeds the intended target of 5%. This is the well-known peeking problem. Every extra look is another chance of calling a false winner.
The fix is a family of methods called sequential testing, which are built to let you look as often as you like while keeping your error rate where you set it. VWO uses a variant of Group Sequential Testing(GST). What’s interesting isn’t that we use it.
Most serious experimentation platforms do. The difference is in how we’ve chosen to apply it. A deliberate choice resulting from over a decade of real-world experimentation.
Keeping the significance threshold stationary
GST-based statistical correction that controls for peeking can be applied in more than one place by:
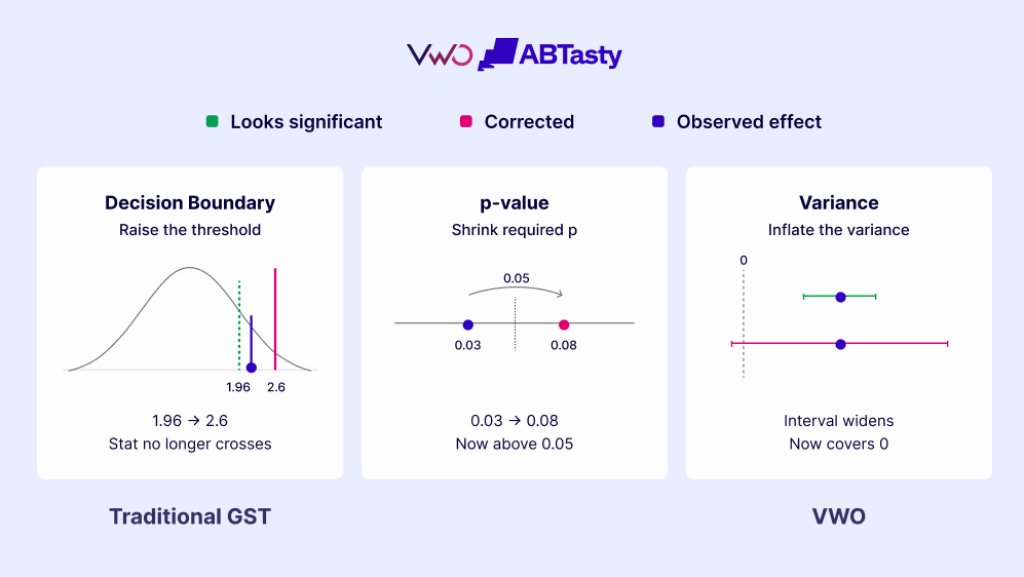
- (left) raising the threshold bar that the p-value statistic must clear,
- (middle) adjusting the p-value
- (right) widening the band of uncertainty around the result (the “variance”).
The traditional way to build a group sequential test moves the decision boundary down at every consecutive look. It works perfectly well, but it has a cost that has nothing to do with maths: the decision threshold keeps moving. The number you’re comparing against this week isn’t the number from last week, which makes a running experiment genuinely hard to read for anyone who isn’t a statistician.
To see why that matters, it helps to know how the traditional GST method actually runs. Group Sequential Testing schedules a few planned check-ins, say at 25%, 50%, and 75% of your traffic. At each checkpoint, it sets the bar your result must clear, highest early (when little data has been collected ) and descending toward the normal significance line as more data is collected.
So the threshold you’re judged against is different at every check. Watching a wandering result chase a boundary that keeps moving is like chasing a ghost: just as you think you’ve caught it, the target has shifted.
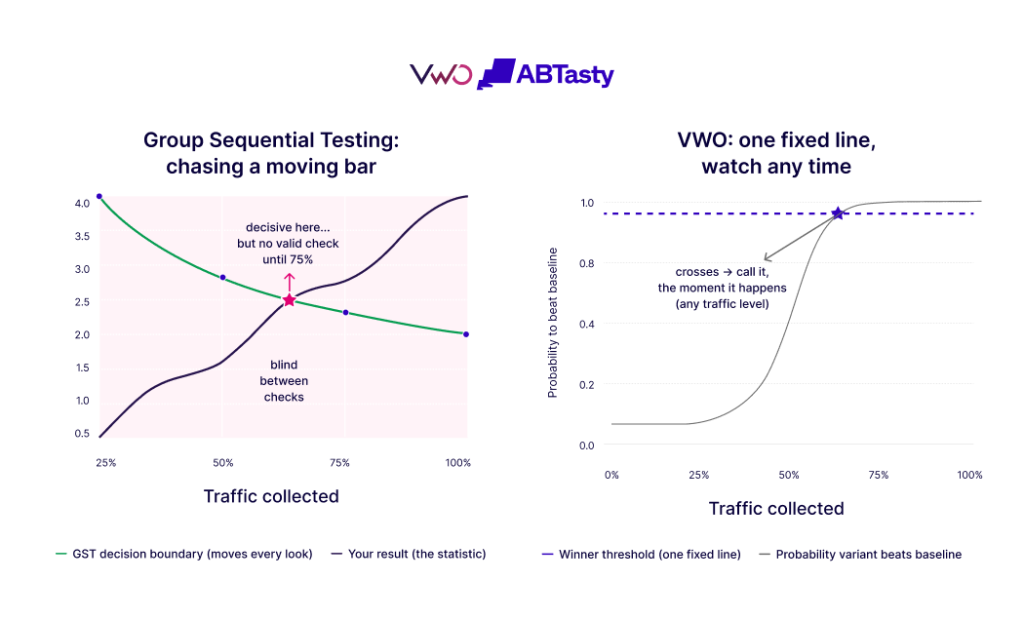
Left: with GST, the decision boundary moves at every look; you can only decide at the planned checkpoints, and the result that becomes decisive between them (red star, ~67%) has to wait.
Right: VWO bakes the correction into one number you compare to a single fixed line, once the line crosses it, and you can call the result the moment it happens.
And there’s a sharper problem hiding in that design: what happens if something goes wrong between the checkpoints? Because a group sequential test only grants a valid decision at its planned checkpoints, the stretch in between is a true blind spot. If a variation starts quietly harming conversions, or a clear winner emerges well before the next scheduled look, you’re left with a bad choice. You either:
- wait and keep serving a result you already suspect is wrong, or
- peek anyway and forfeit the very error guarantee that made the method rigorous.
The boundary protects you only at the checkpoints, but between them, you’re flying without any safeguards.
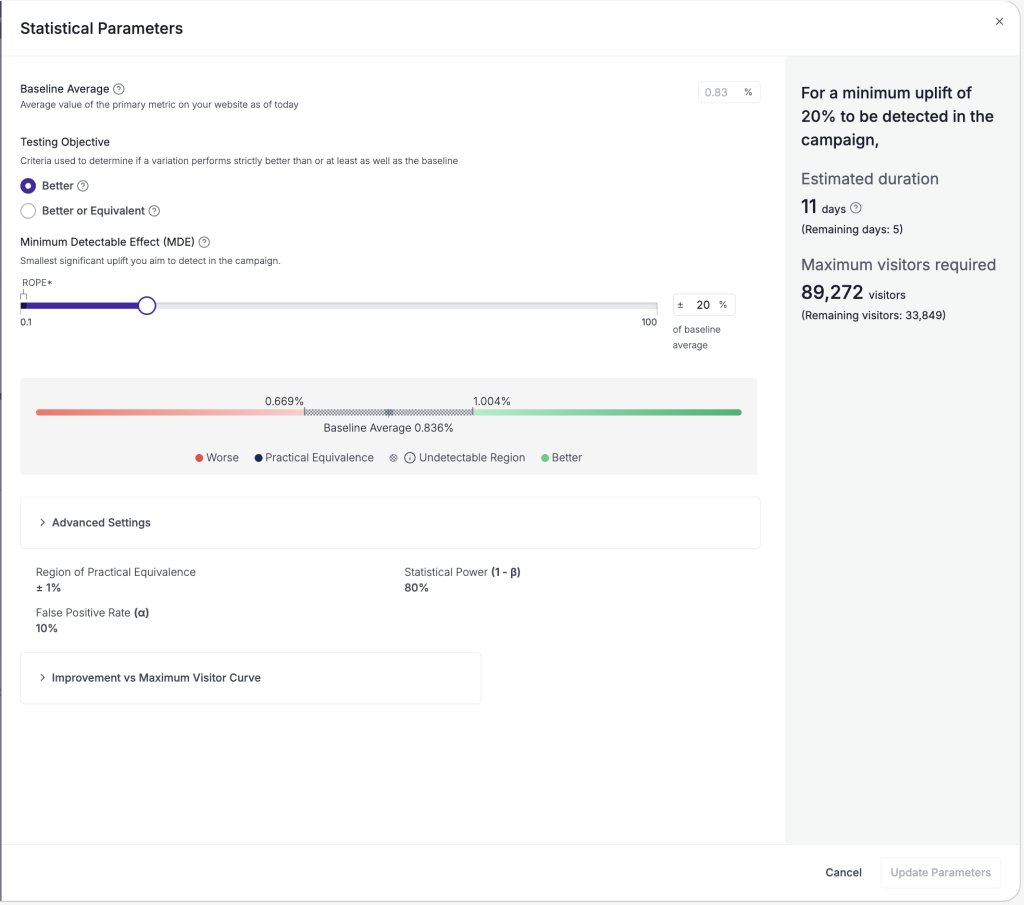
VWO takes a different route. We apply the correction to the variance of the improvement distribution. Essentially, we widen the uncertainty band by exactly the amount your peeking correction requires, and bake that into the one number you already monitor: the probability to be better.
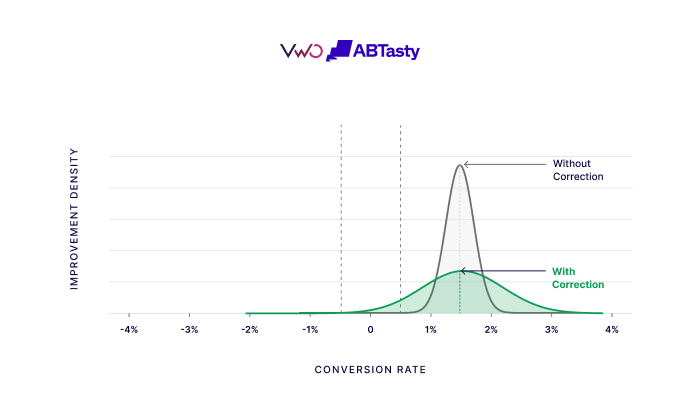
The decision threshold never moves. You watch a single, stable number cross a single, stable threshold. When it crosses, you have a winner. Marketers, product managers, and data scientists can all look at the same report and agree on exactly what it says.
No statistics homework required
Most sequential testing frameworks using traditional GST ask the experimenter to make technical choices up front:
- How many times will you look?
- At what intervals?
- What’s your expected sample size?
Get them wrong, and your results suffer.
We don’t ask. We handle those inputs with sensible defaults, so creating an experiment remains frictionless.
That same flexibility means your reporting choices aren’t locked in at the start. Because the corrections are computed from the data you’ve collected rather than pre-committed at setup, you can even adjust your reporting preferences mid-test without throwing away its statistical validity.
Bayesian or Frequentist, your call
Teams trust different things. Some think in probabilities (“there’s a 97% chance this variation is better”); others think in p-value and confidence intervals. Rather than force a style, VWO builds the same sequential correction into both bayesian and frequentist reporting.
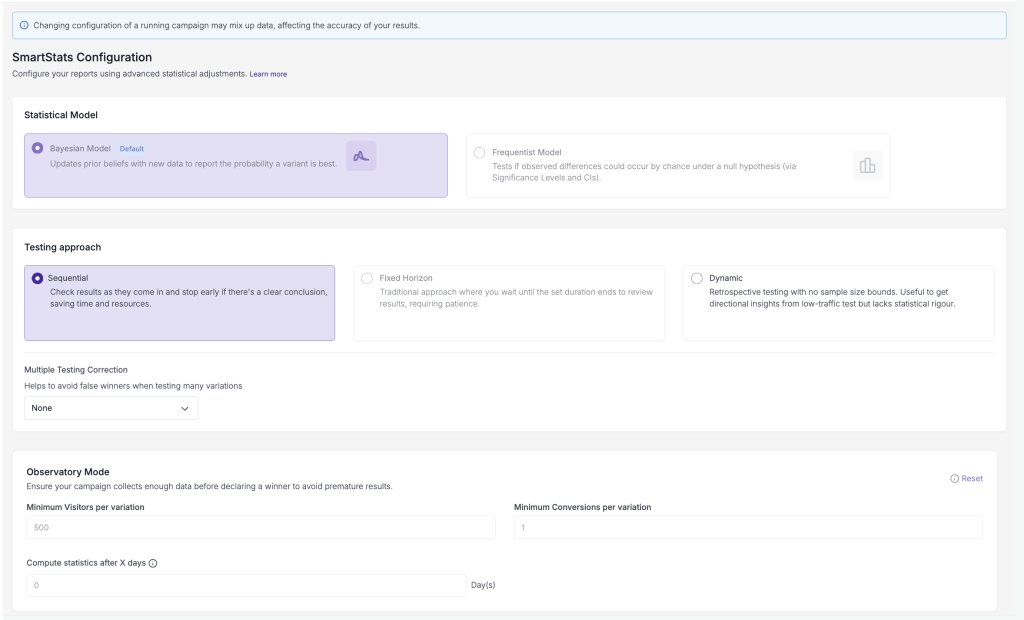
You choose the framework you’re most comfortable defending to your stakeholders, and the protection against peeking-inflated errors comes along either way. The methodology is your preference; the rigor is non-negotiable on our side.
Proof: head-to-head error control comparison
A claim about error control is only as good as the evidence backing it. We ran our variance-side correction head-to-head against a textbook O’Brien-Fleming boundary design across thousands of simulated experiments, ranging from a few occasional peeks to relentless peeking.
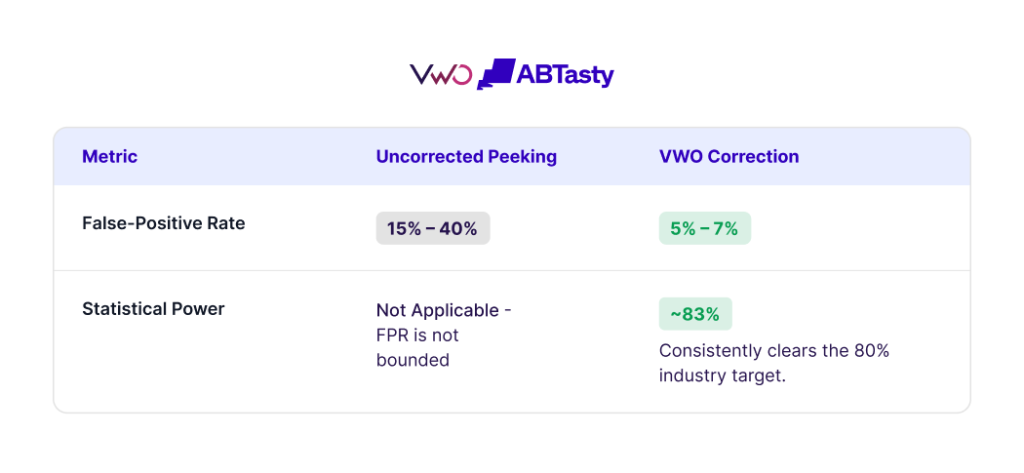
Without any sequential correction, peeking is a disaster. With no real difference present, a false-positive rate of 15% may climb to nearly 40% under peeking. Both the exact O’Brien-Fleming boundary and VWO’s variance-side correction flatten it completely, and they sit down near the 5% target no matter how often you look.
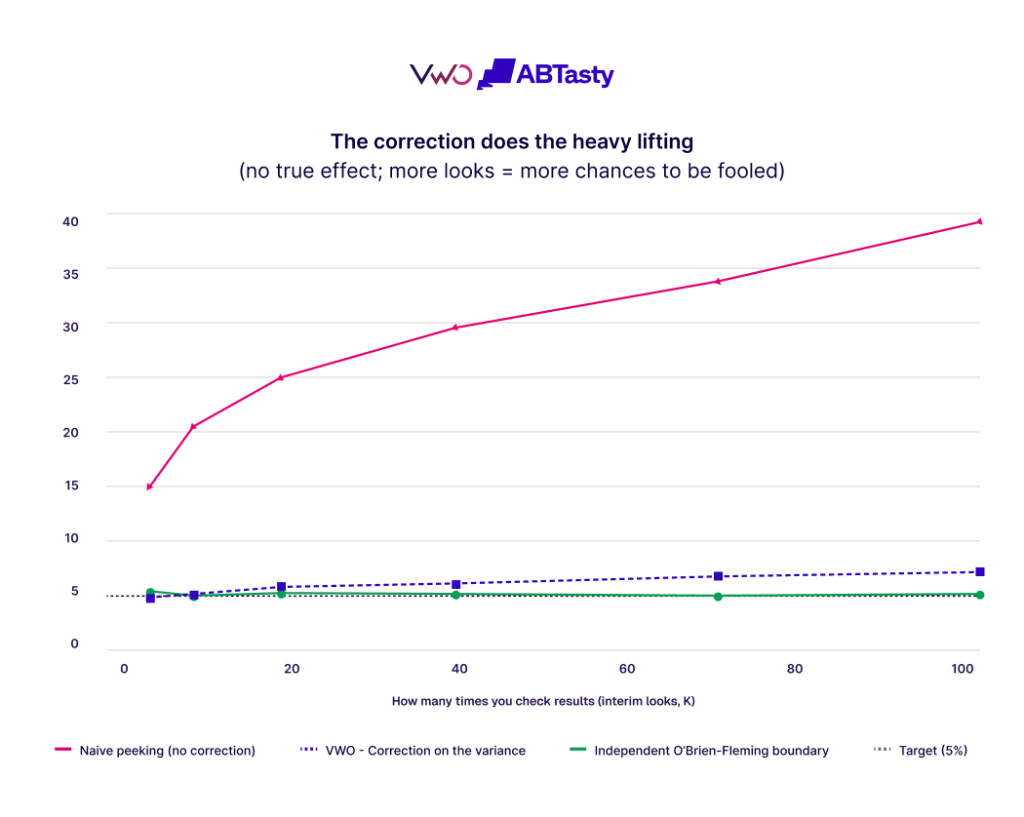
Naive peeking runs to 15–40% error. The exact O’Brien-Fleming boundary and VWO’s correction both stay near 5%
The exact O’Brien-Fleming boundary holds 5% precisely. VWO sits right on 5% at normal interim-look counts, and under relentless, continuous peeking, it drifts modestly to about 7% at a hundred looks. That is a deliberate tradeoff: VWO uses one fixed, readable correction rather than recomputing a moving boundary at every glance.
At VWO, we want to offer an interpretable and reliable friction-free experimentation experience. None of this costs you the ability to find real winners. With a true effect present, both methods reach the 80% power target across the board.
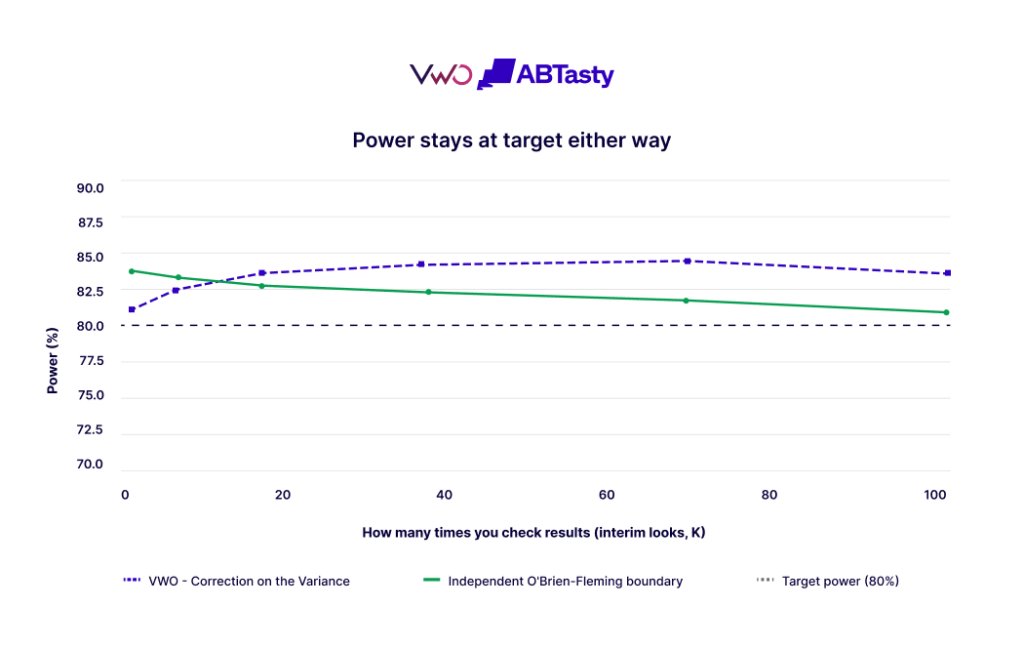
Power holds at the 80% target for both methods, at every look count.
To summarize,
Trustworthy down to the segment: Opportunities
The same peeking protection follows you when you slice the data. VWO’s Opportunities surfaces the segments where a variation is doing notably better or worse than baseline, so you don’t have to analyze dozens of dimension combinations to find them. The usual issue with segment-level findings is that they’re generally noise due to being underpowered (too few observed visitors to mean anything).
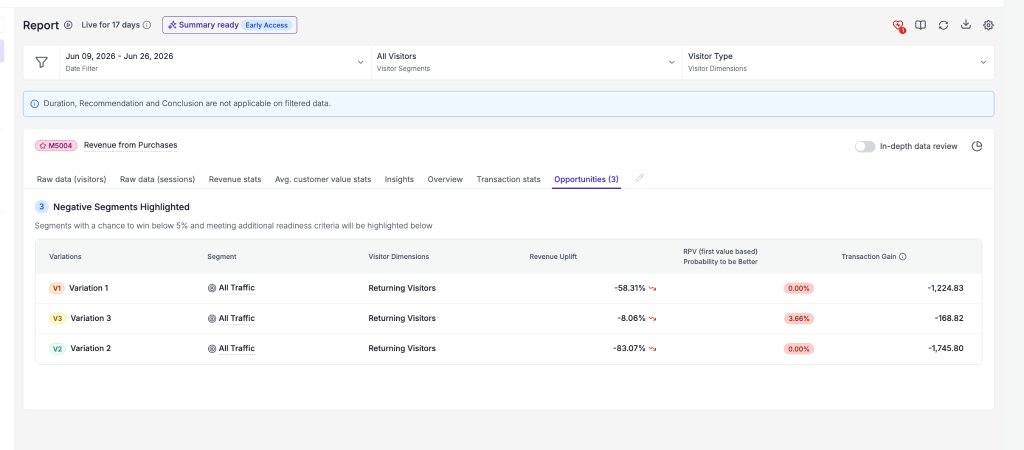
The probability of being better behind every surfaced segment carries the same sequential correction as the overall result, so a flagged opportunity isn’t an artifact of repeated peeking.
So when a segment shows up as a positive or negative opportunity, you can trust that the statistics are sequentially corrected and adequately powered.
Extending sequential testing to Sample Ratio Mismatch(SRM)
A sample ratio mismatch (SRM) is when the traffic actually reaching each variation drifts from the split you intended (a 50/50 test running 47/53), an early sign that something in the setup is off, and your results may be biased. VWO watches for it continuously, all through a test’s runtime, so you’re alerted the moment integrity slips rather than finding out after the fact.
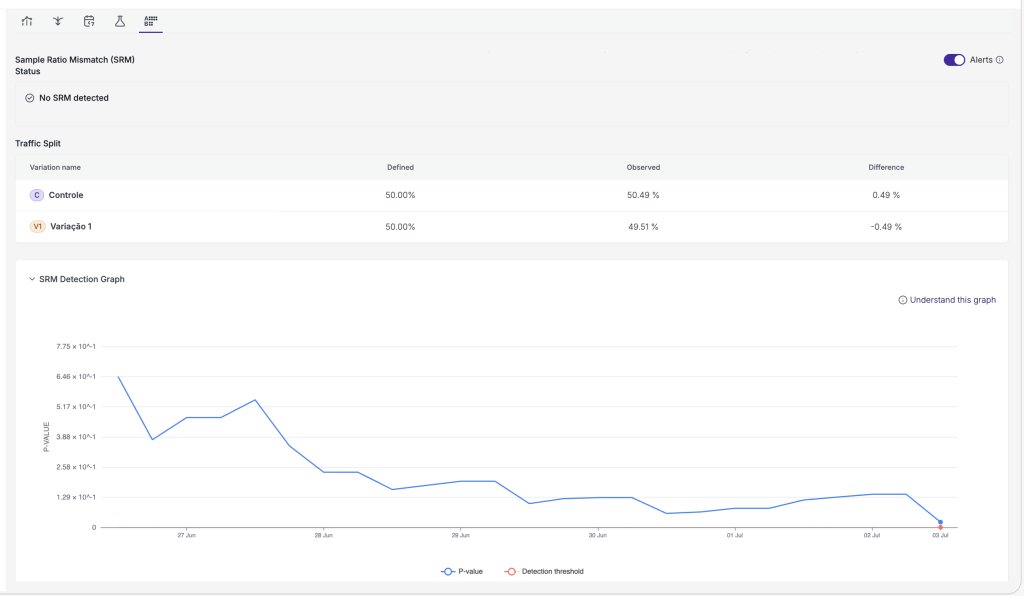
Here, we make the opposite design choice on purpose. SRM is checked with a chi-squared test, and its p-value is compared against a dynamic, moving threshold. That threshold comes from the moving boundary, not the variance-side correction. Why flip? Because SRM is a background safeguard you never actively read. It simply alerts you if something breaks.
With no human watching that threshold, the moving boundary’s one drawback, being hard to read, disappears, so the classic approach works. The result is a check that can run continuously, however often you like, with its power and false-positive guarantees holding across the whole experiment lifecycle. Same principle, placed where it fits.
Experimentation without friction
At its core, A/B testing shouldn’t require a Ph.D. in statistics to execute correctly, nor should it force you to fight your natural curiosity to check on a live campaign.
By applying our sequential correction directly to the variance, VWO absorbs the mathematical complexity behind the scenes. We’ve replaced moving boundaries and rigid upfront rules with a single, reliable metric that holds its ground.
You get the freedom to peek, the flexibility to choose your preferred reporting framework, and the confidence that your winning variations are actually winners. The statistics are handled. The rigor is guaranteed. All that is left for your team to do is focus on building better experiences. Request a demo with VWO and experience it firsthand!
Categories:


