When interpreting A/B test results from software, the first step is to ensure they are statistically significant and that you had a large enough sample size.
Then confirm the test has run for at least one to two full business cycles. Validate with behavioral data before a ship decision. Segment results by device, traffic source, and user type.
Why interpreting A/B test results is harder than it looks
Your testing platform will tell you which variation won. What it won’t tell you is whether that result is trustworthy, whether it applies to all your users, or what to do next.
The majority of misinterpretations stem from one of three sources: testing too early; misinterpreting what statistical significance really means; or interpreting an aggregate result as if it applies equally across segments. Any one of these can result in a losing variation being shipped or a real winner being thrown away.
Getting it right requires more than reading a dashboard; it requires knowing what to look for and in what order, from statistical checks to behavioral validation, as the following sections explain.
Growth comes much later. It is about clarity: you go beyond just numbers and actually see user behavior across the variation. You combine both to gain a clearer understanding, which helps you make better decisions about implementing test solutions.
Learn how combining experimentation data with behavioral insights helps you go beyond numbers. See how users actually behave on each variation, gain a clearer understanding of what’s working and why, and make better decisions about implementing test solutions.
How does A/B testing software calculate results (in simple terms)?
When you run an A/B test, your testing software tracks visits, conversions, and other goal events across your control and variant(s). It then applies a statistical model, frequentist or Bayesian, to determine whether the observed difference between the variations is likely real or due to random variation.
The key output is a p-value (frequentist) or a probability of being best (Bayesian), which platforms present as an easy-to-read confidence or probability score. A 95% confidence level means there is a 5% chance the result is a false positive. That sounds low, but if you’re running many tests simultaneously, false positives accumulate.
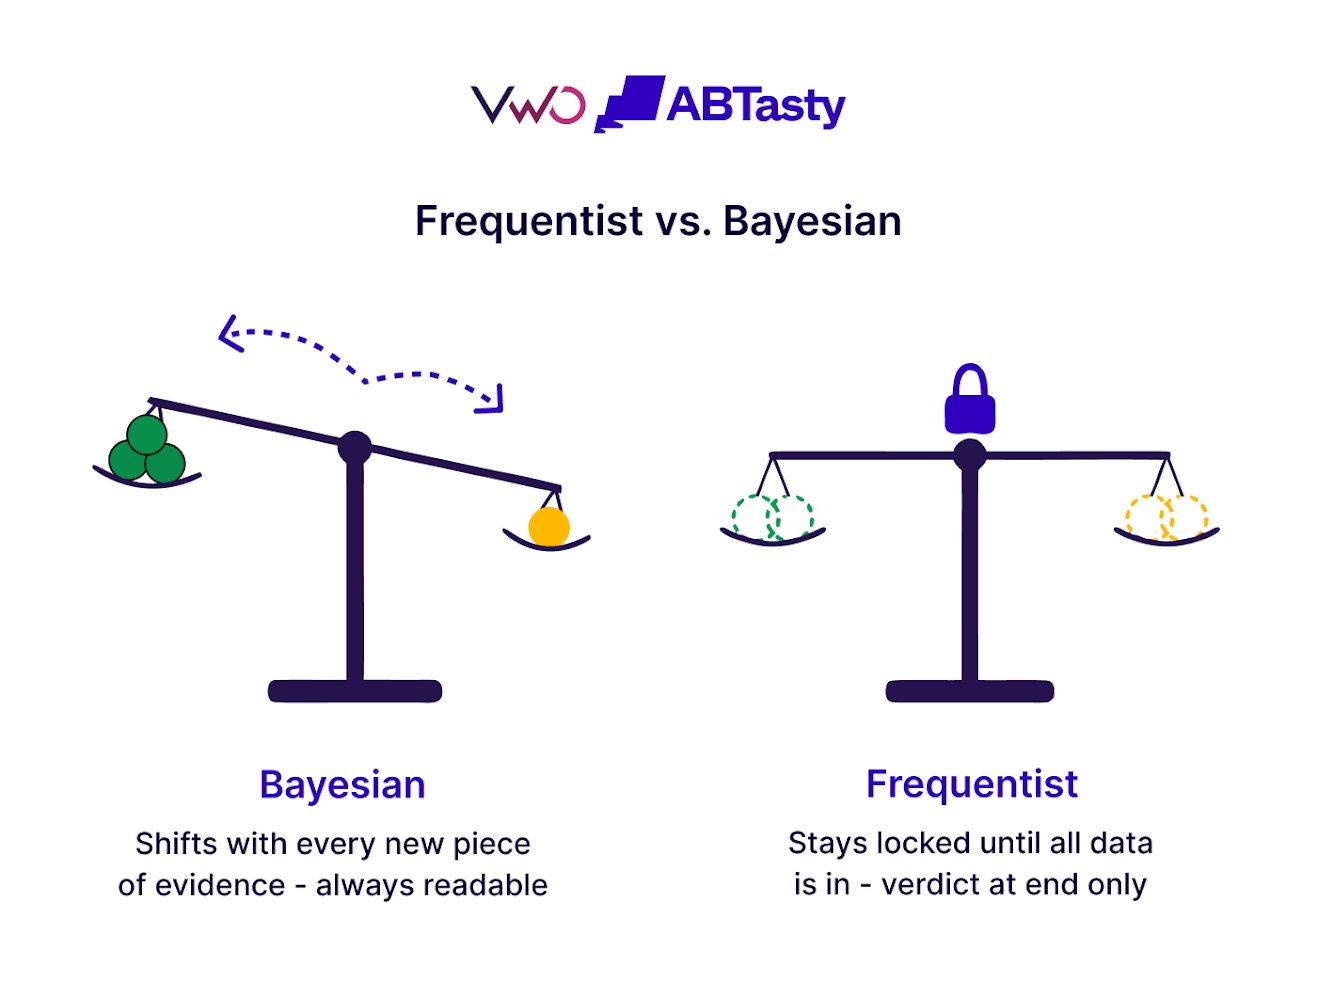
Frequentist vs. Bayesian: Frequentist testing (used by most platforms by default) asks whether your result is likely given a true null hypothesis. It relies on pre-defined sample sizes or stopping rules and is only reliable when interpreted according to those rules.Bayesian testing asks: given the data, what’s the probability that variation B is better than A?
Both are valid, but they answer different questions and require different rules for how and when you read the output. Knowing which model your tool uses changes how you interpret the results.
Key metrics to focus on when reading A/B test results
Not all metrics in your testing dashboard carry equal weight. Here’s how to prioritize:
Primary metric: The single conversion goal your test was designed to move: sign-up rate, purchase rate, or form completion. Every test should have one primary metric, defined before launch.
Secondary metrics: Supporting indicators such as time on page, scroll depth, or click-through rate. These are contextual but not decision-driving. An improvement here is a signal of direction, not of success, with no movement in the primary metric.
Guardrail metrics: Metrics that protect business impact, like revenue per visitor, bounce rate, or session quality. If these decline, even a lift in the primary metric isn’t a sustainable win.
Uplift: The relative improvement of your variant over the control. A result can show positive uplift and still not be worth shipping if the absolute difference is too small to justify the implementation cost.
Sufficient sample size: The minimum number of users required for a reliable result. Tests that do not meet this threshold are underpowered, rendering any observed differences unreliable and increasing the risk of false positives or inconclusive outcomes.
Sample ratio mismatch (SRM): A discrepancy between the intended and actual traffic split across variations (e.g., 50/50 vs. 60/40). This typically indicates a tracking or allocation issue and compromises the validity of the test results, requiring investigation before trusting the results.
Know about the most important kinds of metrics and their purpose here.
How to interpret A/B test results correctly: Step-by-step
Step 1: Check test duration
There’s no fixed duration for a test; it depends on your traffic and how quickly you reach a reliable sample size across user behavior. Stopping early because results look promising can easily lead to a false positive.
Read here for a deeper look at the statistical errors early stopping can cause.
Step 2: Validate statistical significance and sample size
Both must be met. Statistical significance without sufficient sample size leads to unreliable conclusions, even if the results appear convincing. Significance only reflects the likelihood that the result is not due to chance, given the data you have, but if the sample is too small, that data isn’t stable.
Step 3: Evaluate business impact
Translate the improvement into actual business terms: revenue, leads, or cost per acquisition based on your current traffic. A significant result with a 0.1% absolute lift may not justify the implementation effort.
Step 4: Account for external factors
Ask if anything changed during the test: a promotion, seasonal spike, or technical issue that could have affected the results outside of your variation. A lift you might get during a flash sale may not be available in normal circumstances.
Step 5: Segment your results
Aggregate results can hide what’s really happening. At the very least, break down performance by device, traffic source, and new vs. returning visitors. But an overall flat result can still include big wins or big losses.
Step 6: Validate with behavioral data
Numbers tell you what changed. Behavior explains why.
With VWO’s integrated tech-stack, teams can analyze heatmaps, session recordings, and scroll behavior for each test variation to see how users actually interact with the experience. This removes guesswork and helps distinguish real improvements from misleading signals.
Step 7: Act on every result
Ship winners, iterate on inconclusive results, and document losses. Every test outcome, logged with its hypothesis, confidence level, and segment findings, contributes to a shared knowledge base that makes future tests smarter.
Common A/B test result scenarios and how to interpret them
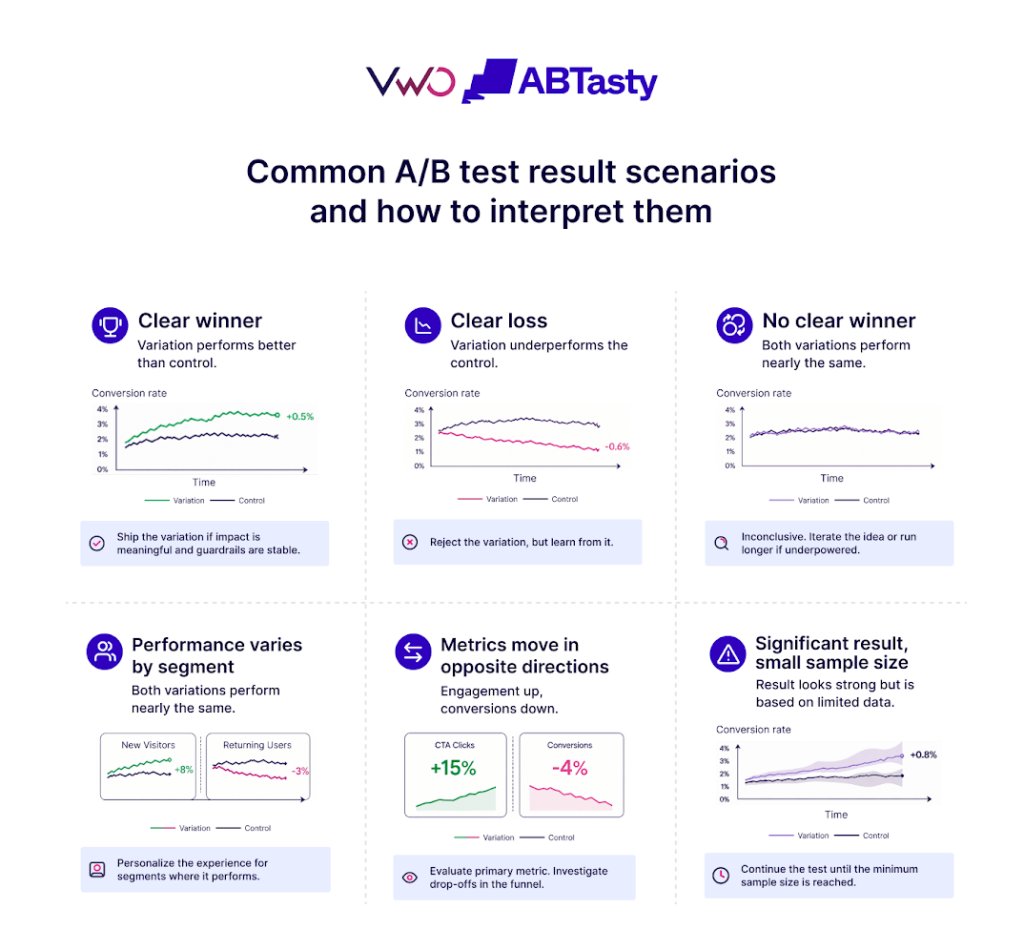
1. Clear winner: Variation performs better than control
The variation shows a statistically reliable improvement over the control. But not all statistically significant gains are meaningful in practice. A large relative uplift with low absolute impact may not move the business.
For example, a checkout redesign that increases conversion rate from 2.8% to 3.3% with 97% confidence is a real win. A 0.1% lift at the same confidence level may not justify the implementation effort.
Ship the variation if the impact is meaningful and guardrail metrics remain stable. If the lift is small, validate whether it’s worth the effort or prioritize higher-impact opportunities.
2. Clear loss: Variation underperforms control
This means the variation introduced friction or disrupted expected user behavior, resulting in a measurable drop in performance. Reject the variation, but learn from it.
If a redesigned homepage layout reduces sign-ups by 6%, session recordings and heatmaps often reveal exactly why: confusing copy, a buried CTA, or a layout that broke a familiar pattern.
A lost test fuels iteration; the clearer you are on why a variation failed, whether due to a weak value proposition, poor visibility, misaligned targeting, or added friction, the stronger your next hypothesis will be.
We should have this in our mind, that not every test will win because the moment you think that, okay, all my tests are gonna pass, you will not have the free hand in running any critical experience because you have fear in your mind that it might fail.
Inconclusive is not failure. If two CTA versions perform almost identically after a full run, the change wasn’t meaningful enough to move behavior. Either the idea needs iteration, or the difference was too subtle to matter.
Review behavioral data for directional signals and use them to build a more targeted follow-up hypothesis. If the test was underpowered, run longer before drawing any conclusions.
Every inconclusive result has something to tell you, if you know how to unpack it. Read the blog to know more.
4. Performance varies by segment
The variation works for a specific audience, not universally. A flat overall.
A new pricing layout may increase conversions for new visitors (+8%) but reduce them for returning users (–3%). Different user groups respond differently based on familiarity, intent, or context.
Avoid a full rollout. Use VWO Personalize to deliver the experience selectively to the segments where it actually performs.
5. Metrics move in opposite directions
The variation grabbed attention but didn’t convert. A +15% increase in CTA clicks alongside a –4% drop in conversions usually signals misalignment: the element is compelling enough to engage, but the experience that follows doesn’t follow through.
Always evaluate against your pre-defined primary metric. Use session recordings and funnel analysis to identify where the drop-off occurs.
6. Significant result, small sample size
The result appears strong but is based on limited data, making it unstable. Early signals often overestimate the true effect. Continue the test until the minimum sample size is reached before making any decisions.
Mistakes to avoid when interpreting A/B test software reports
Peeking and stopping early: Checking results mid-test and stopping when they look good are among the most common causes of false positives. Commit to a pre-defined end date.
Ignoring practical significance: A 95% confidence result with a 0.05% absolute lift is statistically real but may not justify the implementation cost. Always evaluate business impact alongside statistical significance.
P-hacking: Changing metrics or analyzing multiple outcomes after a test to find a “winner” can lead to false positives. Define your primary metric and success criteria before launching the test. Define your primary metric and success criteria before the test launches.
Skipping segment analysis: Shipping a winner without segment review can harm high-value user groups even if the aggregate result is positive. Always break down results by device, traffic source, and new vs. returning visitors before making a final call.
Not accounting for cross-test contamination: If you run overlapping tests simultaneously, users end up exposed to multiple variations at once, experiencing combinations neither test was designed to measure. This corrupts both results. Mutual exclusion groups solve this by partitioning users at the audience level, so each person is assigned to only one test at a time.
How different A/B testing tools present results (and what it means)
How your testing platform presents results isn’t just a UI preference; the statistical engine underneath determines what you can trust, when you can read it, and what the numbers actually mean.
Most platforms surface results through the same core elements:
Dashboards and visualizations: graphical representations of performance trends over time, making it easy to spot when results stabilize or diverge
Confidence level or probability of winning: how certain the platform is that the observed difference is real
Conversion rate, absolute and relative lift: the actual performance of each variation and the size of the improvement
Confidence intervals: the range within which the true conversion rate likely falls, indicating how much variance to expect
Segmented data: breakdown by device, browser, traffic source, or new vs. returning visitors
Date range filtering: isolate performance across specific periods rather than reading aggregate data only
These elements are consistent across most of the tools. What differs is how they’re calculated.
1. VWO AB Tasty
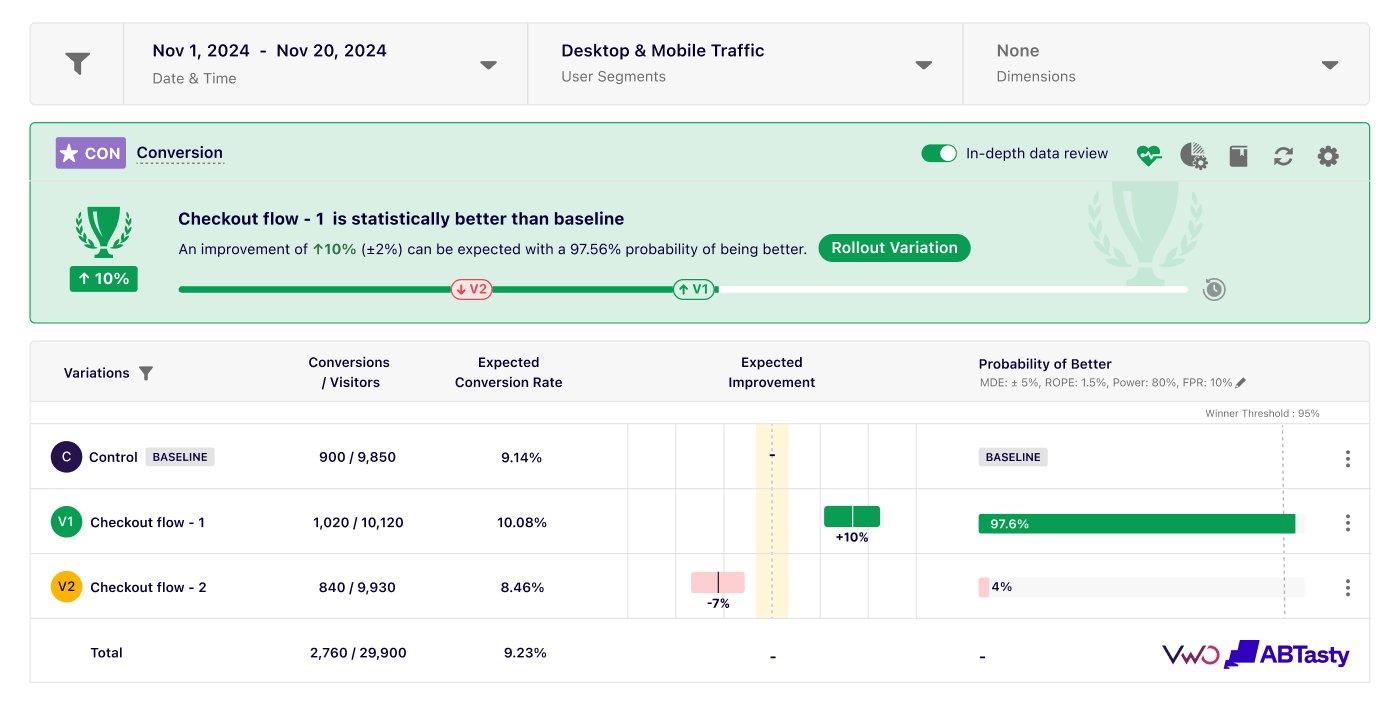
Runs on SmartStats, a Bayesian-powered engine that directly answers the question practitioners actually care about: what is the probability that variation B is better than control? Rather than a binary significant/not significant output, it reports a continuous probability estimate that updates as data come in, along with confidence intervals, conversion lift, and estimated revenue impact.
The testing dashboard surfaces these insights in real time, with results viewable as tables or graphs, filterable by predefined or custom segments, and automatically corrected for peeking and multiple testing errors.
Some other capabilities are:
Error-free real-time reports: the stats engine supports continuous monitoring of results without the typical risks associated with peeking in traditional frequentist approaches.
Built-in Bonferroni correction: controls error rates when testing multiple variations. Instead of requiring manual correction or shifting decision thresholds, uncertainty is incorporated directly into the probability estimates.
Configurable metrics and statistical parameters: set improvement direction, statistical thresholds, and save metrics with defaults for reuse across campaigns
Guardrail metrics: automatically disables variations that breach critical business KPIs, preventing conversion loss before you manually catch it
24/7 experiment health monitoring: runs continuous checks on data tracking, conversion tracking, minimum runtime, and flags issues like Simpson’s Paradox
SRM detection: automatically identifies sample ratio mismatch and notifies you if campaign results are unreliable
Outlier detection: built-in outlier identification with optional automatic replacement to prevent skewed results
Don’t wait for a test to fully conclude if a variation is clearly underperforming. With theadvanced stats engine, you get timely recommendations to pause variations with a very low probability of success. This helps you cut losses early, protect conversions, and shift traffic toward better-performing experiences faster.
2. Optimizely
Optimizely results are powered by the Stats Engine, a sequential testing model that keeps false positive rates in check regardless of when you check results, solving the peeking problem without requiring you to commit to a fixed test duration. Other capabilities include:
Warehouse-native analytics: connects directly to Snowflake, BigQuery, Redshift, and Databricks, so experiment results run against your single source of truth rather than a separate data layer
Custom metrics: build conversion metrics, numeric aggregations, and calculated metrics tied to actual business outcomes like revenue
CUPED: reduces variance in results to surface insights faster with fewer visitors
Automatic SRM detection: continuously monitors traffic distribution and flags imbalances immediately if detected
3. GrowthBook
Offers both Bayesian and frequentist engines, switchable at the organization or project level. The Bayesian engine reports a “Chance to Win” probability rather than a p-value: above 95% is a clear winner, below 5% is a clear loser, and anything in between is inconclusive. Results connect directly to your existing data warehouse with no separate data layer. Key capabilities include:
Three difference types: relative uplift, absolute difference, and scaled impact
CUPED variance reduction: available on both engines to reduce noise and reach conclusions faster
Sequential testing: optional correction for safe peeking before the fixed end date
Automatic SRM detection: flags sample ratio mismatch and warns if results are unreliable
Pre-exposure bias check: uses pre-experiment data to identify imbalances between baseline and variation groups before exposure.
Guardrail metrics: tracked separately with higher sensitivity to negative trends
4. Convert
Convert Experiences gives you the flexibility to switch between Frequentist and Bayesian models depending on the test and the approach that fits a team’s methodology. Additional capabilities include:
Post-test segmentation: break down results by visitor type, device, and campaign
Flexible reporting: customize metrics displayed, graph type, and contextualize reporting by test goal
Configurable significance thresholds: set decision thresholds at 90%, 95%, or 99%, depending on the risk tolerance for each test
5. Statsig
Results are presented through a Scorecard showing metric lifts for all primary and secondary metrics, with relative delta (%), confidence intervals, and significance clearly flagged: positive lifts in green, negative in red, and non-significant results in grey. Key capabilities include:
Multiple result views: cumulative, daily, table, and days-since-exposure (tracks how the variation’s effect changes over time from each user’s first exposure)
Dimension-based breakdowns: segment by user attributes (OS, country, region) or event-level metadata
CUPED: toggleable pre-experiment bias reduction
Sequential testing: adjusts p-values and confidence intervals to reduce false positives
Benjamini-Hochberg correction: controls false positive risk across multiple comparisons
Automatic outlier capping: 99.9% winsorization applied by default to reduce the impact of extreme values
How to turn A/B test results into actionable insights
A test result is only valuable if it informs a decision or the next step. Here’s a structured approach:
Ship, iterate, or discard: A clear winner gets shipped. An inconclusive result with a directional signal informs the design of a refined follow-up test. A clear loss still generates learning; document why the hypothesis was wrong.
Translate results into hypotheses: Every test, regardless of outcome, should produce at least one new hypothesis. What did behavioral data reveal? What did the segment analysis suggest? These are your next test candidates.
Run multiple iterations – and run multiple variations per test if you have enough data volume. This will increase speed tremendously. Even if you find winners, oftentimes it makes sense to iterate still and try to beat them.
Post-test segmentation: Aggregate results often hide meaningful differences across user groups. Segmenting by device, behavior, or user type reveals where a variation actually worked. Post-test segmentation in VWO Testing lets you deploy a winning variation only to the segment where it actually worked. However, post-test exploration across too many segments increases the risk of false positives. Define your key segments and success criteria before launching the test, not after.
Update your test repository: Maintain a shared log of what was tested, the result, the confidence level, segment findings, and what was shipped. This prevents teams from repeating failed tests and creates a compounding knowledge base.
The teams that extract the most value from experimentation are those that treat each result as an input into the next cycle, not as a standalone event. Our experimentation platform supports this workflow end-to-end: from behavioral analysis in Insights to test execution in Testing to targeted delivery in Personalize, with Wandz accelerating hypothesis generation between cycles.
Ready to move from isolated tests to a structured experimentation program? Request a demo with the VWO AB Tasty team.
FAQs
Why do different tools show different statistical results?
Different tools use different statistical models (frequentist vs. Bayesian), assumptions, and data handling methods. Even within the same model type, tools differ in how they handle variance reduction, multiple comparisons, and sequential testing. Always know which engine your tool uses before comparing results across platforms.
Is statistical significance enough to make a decision?
No. Statistical significance only indicates reliability, not impact. A result can be significant but too small to matter, or meaningful but not yet significant. Always evaluate business impact, guardrail metrics, and user behavior before making a decision.
How long should an A/B test run before trusting the results?
Long enough to reach the required sample size and at least one to two full business cycles. This ensures the results account for traffic variability and user behavior patterns, making them stable and reliable.
Hi, I’m Pratyusha Guha, manager - content marketing at VWO. For the past 6 years, I’ve written B2B content for various brands, but my journey into the world of experimentation began with writing about eCommerce optimization. Since then, I’ve dived deep into A/B testing and conversion rate optimization, translating complex concepts into content that’s clear, actionable, and human. At VWO, I now write extensively about building a culture of experimentation, using data to drive UX decisions, and optimizing digital experiences across industries like SaaS, travel, and e-learning.
Uncover hidden visitor insights to improve their website journey
One of our representatives will get in touch with you shortly.
Awesome! Your meeting is confirmed for at
Thank you, for sharing your details.
-
, you're all set to experience the VWO demo.
I can't wait to meet you on at
Account Executive
, thank you for sharing the details. Your dedicated VWO representative, will be in touch shortly to set up a time for this demo.
We're satisfied and glad we picked VWO. We're getting the ROI from our experiments.
Christoffer Kjellberg
CRO Manager
VWO has been so helpful in our optimization efforts. Testing opportunities are endless and it has allowed us to easily identify, set up, and run multiple tests at a time.
Elizabeth Levitan
Digital Optimization Specialist
As the project manager for our experimentation process, I love how the functionality of VWO allows us to get up and going quickly but also gives us the flexibility to be more complex with our testing.
Tara Rowe
Marketing Technology Manager
You don't need a website development background to make VWO work for you. The VWO support team is amazing
Elizabeth Romanski
Consumer Marketing & Analytics Manager
Trusted by thousands of leading brands
Awesome! Your meeting is confirmed for at
Thank you, for sharing your details.
Your Roadmap to Better Results
1:1 Demo customized to your industry and optimization goals.
Feature deep-dive into the user behaviour tools you need most.
No-pressure advice on the best path forward for your team.





 ChatGPT
 Perplexity
 Gemini
 Claude
 Grok
Grok