Whether a visitor adds a product to the cart, chooses an option from a dropdown, or repeatedly clicks on a button that doesn’t work, each action reveals their intent, preferences, and expectations.
That’s where click tracking comes in.
Click tracking helps marketers, designers, and product teams see beyond surface-level metrics like bounce rate or time on page.
This blog covers everything you need to know about click tracking, including the different types, the best click tracking tools, and much more.
What is click tracking?
Click tracking measures and records where visitors click (or tap) on a website, app, or email. It captures interactions on page elements, links, or buttons and converts them into data for analysis and optimization.
Learn more about how visitors navigate your site, what messaging encourages them to act, and what content resonates most with them.
Such data points help you better understand your users and make targeted improvements to increase conversions across all pages.
2. Improve conversions
See where users click (and where they don’t) to optimize your website or mobile app CTAs, links, and page layout to improve their overall experience.
3. Reveal friction points
Spot ‘dead clicks’ (clicks that lead nowhere) or ‘rage clicks’ where users repeatedly click something expecting a response. This enables you to identify areas where visitors experience friction and take appropriate action.
4. Measure campaign effectiveness
Identify the channels (email, social, referral) that drive the most traffic or engagement to optimize targeting, reduce wasted spend, and improve ROI.
5. Enhance UX across devices
Understand how visitors interact with your website through different devices (desktop, tablet, and mobile devices). Identify device-specific behaviors such as tap patterns, misclicks, or layout breakpoints to ensure a consistent experience across all screen sizes.
Look for patterns of how people use certain pages or move from one page to another. Find something unique, something that’s persistent, and then try to figure out how it goes against what you plan the user journey to be. More often than not, you will notice a disconnect.
Click tracking records every visitor interaction and translates it into actionable behavioral data. Let’s understand how it works.
1. A tracking code or tag is added to the website
A JavaScript tracking code (or pixel) is embedded into your website’s HTML. This script listens for visitor actions across page elements, such as onclick, mouse clicks, or touchend events.
Whenever a visitor clicks or taps on something, the code records key data such as:
The clicked element (ID, class, or selector)
The page URL and referrer
Timestamp of the action
Browser, device, and session ID
2. Data is collected at an analytics server
Once a click is registered, the tracking script sends this event data to the analytics or testing platform’s servers.
The backend stores and aggregates these clicks into datasets for visualization or reporting.
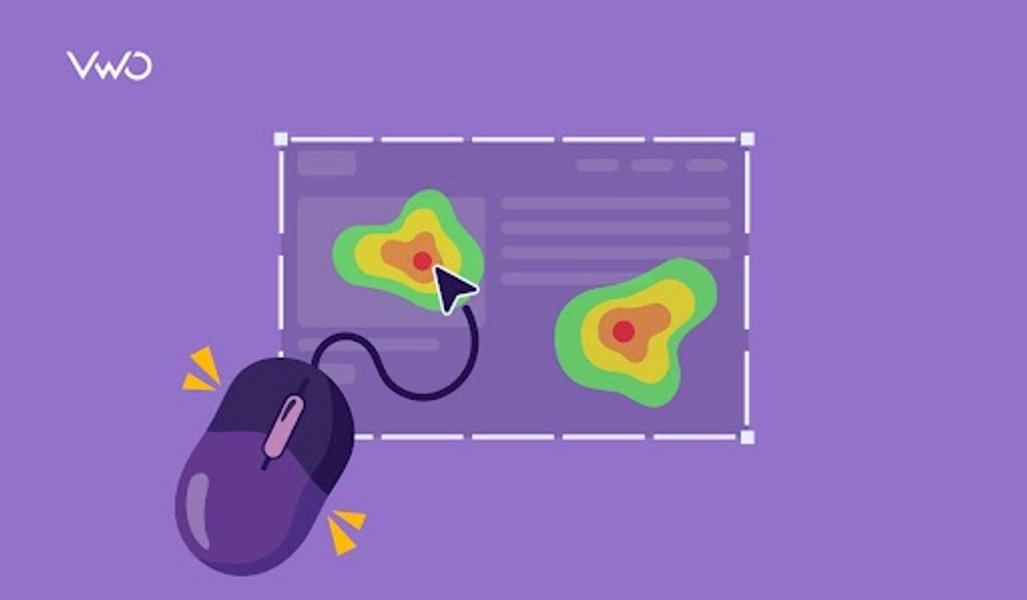
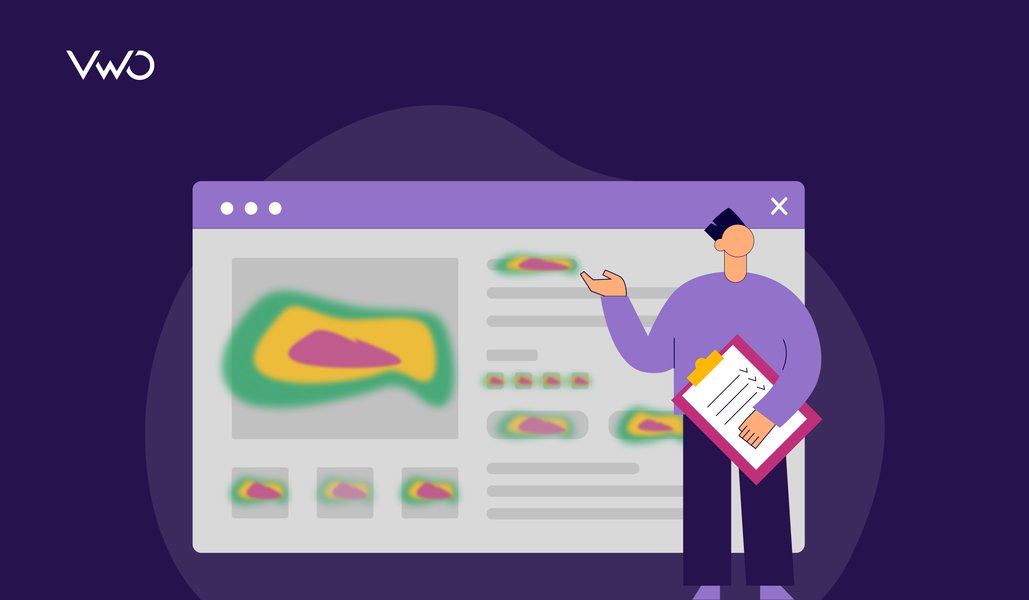
3. The click tracking tool maps click positions
In visual analytics tools, the X-Y coordinates of each click or tap are logged to create a heatmap or click map.
These tools offer a visual representation of a page so you can easily identify which parts attract the most attention or where visitors get stuck (for example, clicking on non-clickable text).
4. Data is enriched with context
The click tracking tool merges raw user click data with contextual metadata such as:
Device type and viewport size
Scroll depth
UTM parameters (campaign, source, medium)
Visitor journey and previous user activity
This helps understand not only what or where a user clicks, but also why they did it.
5. Reports and insights are generated
Finally, the collected data is visualized as charts, funnels, or heatmaps showing which CTAs, buttons, or navigation paths perform best.
You can use these valuable insights to:
Identify high- and low-performing elements
Spot rage clicks or dead zones
Optimize page layouts, CTAs, or copy for higher user engagement and conversions
Different types of click tracking
Click tracking takes several forms depending on where and why visitor interactions are being measured.
Here are the main types of click tracking used for analytics and optimization.
1. Website click tracking
Track visitor clicks, taps, or link selections across a website or to understand on-page user behavior.
It identifies which buttons, links, or elements attract the most engagement and which areas go unnoticed to help optimize design, navigation, and CTAs.
For instance, eCommerce platforms can analyze clicks on key CTAs like ‘Add to Cart’ and ‘Buy Now’ to optimize the checkout journey.
2. Link click tracking
Monitor how many people click specific links, like banner ads, affiliate links, or URLs in marketing campaigns.
By monitoring clicks on specific URLs, often used with Universal Testing Machine (UTM) parameters or redirect links, you can analyze the performance of custom campaigns, A/B tests, and referral traffic.
For example, UTM tags are added to links that are shared on social media to track which platform drives the most traffic.
3. Email click tracking
Track which links within an email are clicked, how many times they’re clicked, and which recipients interacted with them.
In email analytics, each link is embedded with a unique tracking URL or redirect, so when a user clicks it, the system logs that action before redirecting them to the final destination.
Monitor clicks on ads, banners, or campaign landing pages to measure ad performance, CTR (click-through rate), and ROI. This data is essential for assessing which advertising campaigns or creatives drive user engagement and conversions.
This type of link tracking is useful for identifying the ads that resonate best with the target audience, allowing teams to further optimize them for better conversions.
Pro Tip!
Use VWO’s On-Page Surveys alongside click tracking insights. If you notice unusual behavior, you can trigger a survey right there to ask visitors what they were trying to do. This gives you instant context behind confusing interactions.
5. Event-based click tracking
Capture key events triggered by visitors, such as clicks on a button, dropdown, banner, video, or navigation menu.
Often used in analytics and CRO tools to track specific actions within a session and map complete interaction journeys.
It tracks predefined actions, such as clicks on the “Add to Cart” button or on the ‘Submit Form’ button, to provide detailed insights on user interactions.
6. Mobile tap tracking
Measure where users tap on a mobile screen within responsive sites or apps.
For instance, you can track how far users scroll on a particular web page with Scrollmaps, or compare how users interact with different areas of a landing page with Click Areas.
VWO Web Insights also enables you to watch session replays in a single hub to understand their complete journey.
Apart from this, you can also track how users tap, swipe, and navigate your mobile app with VWO Mobile App Insights.
Based on these valuable insights, you can validate design hypotheses, prioritize optimization decisions, and improve the user experience without relying on assumptions or guesswork.
It enables you to see where users click, what they ignore, and how they interact with key website elements.
Also, with tools like VWO, you can combine click tracking with session recordings to see the exact actions visitors perform on your website.
Schedule a demo now to explore how you can track user behavior with VWO.
Frequently Asked Questions (FAQs):
Q1. What are examples of website click tracking?
Some common areas where you can track clicks are: Navigation menus to see which pages attract the most visits. CTAs like Sign Up or Buy Now buttons to measure conversion intent. Landing page images or banners to check where users click. Non-clickable areas (dead clicks) to identify UX friction points.
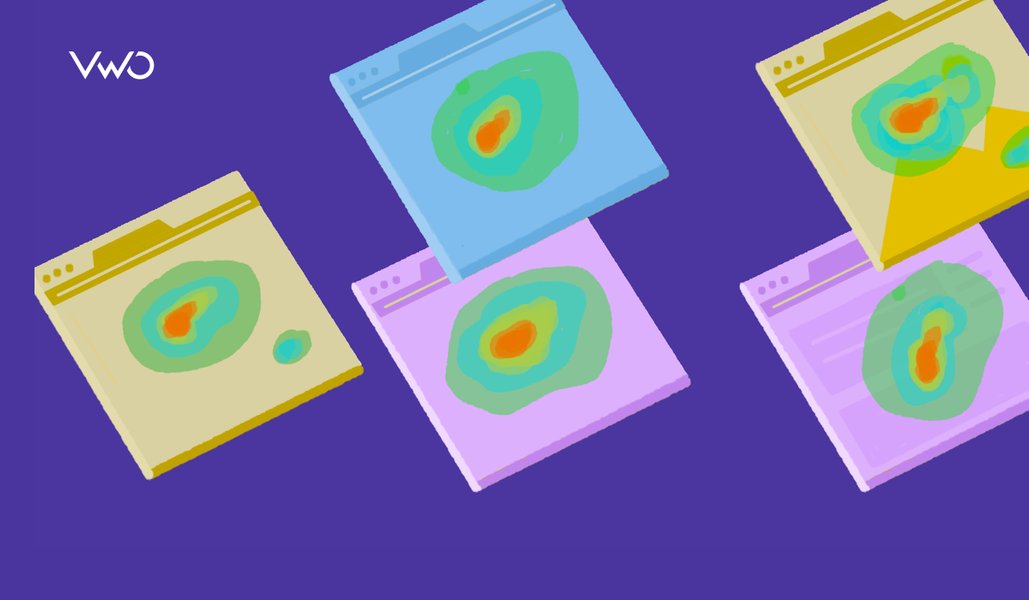
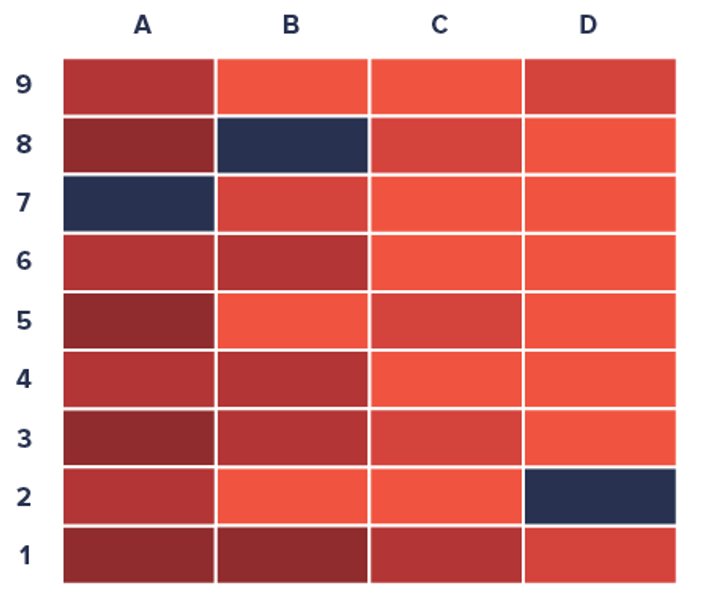
Q2. How are click trackers different from heat maps?
A click tracker logs individual visitor clicks as data points, while heatmaps visualize those clicks using color gradients. In other words, a click tracking software provides raw data. But, heat maps show the pattern and help teams quickly spot high-engagement areas or zones that users ignore.
Q3. How do I track clicks?
First, you need to embed a tracking code on your website. This click tracker code listens for user interactions (like onclick, or other mouse movements), records them, and sends the data to an analytics tool for visualization. Platforms like VWO make this process seamless with pre-built tracking scripts.
Q4. What is click monitoring?
Click monitoring is another term for tracking clicks across digital assets such as websites, emails, and campaigns to evaluate engagement and performance. It helps identify which elements users interact with most and whether those interactions lead to desired outcomes.
Q5. How does email click tracking work?
In email tracking, each clickable link is rewritten as a unique tracking URL. When a recipient clicks, the email service provider logs the action before redirecting to the final page. This type of link tracking helps marketers measure engagement rates, test CTAs, and segment audiences based on click behavior.
Hi, there! I’m an Associate Manager of Content at VWO with 6 years of experience in B2B and B2C marketing. I work across blogs, SEO, thought leadership, newsletters, landing pages, and a video podcast I built and manage from scratch. At VWO, I’ve gained expertise in CRO, experimentation, user behavior research, and personalization, creating content that makes complex ideas clear and actionable. Outside of work, I enjoy experimenting with memes and short-form video on Instagram.
Uncover hidden visitor insights to improve their website journey
One of our representatives will get in touch with you shortly.
Awesome! Your meeting is confirmed for at
Thank you, for sharing your details.
, you're all set to experience the VWO demo.
I can't wait to meet you on at
Account Executive
, thank you for sharing the details. Your dedicated VWO representative, will be in touch shortly to set up a time for this demo.
We're satisfied and glad we picked VWO. We're getting the ROI from our experiments.
Christoffer Kjellberg
CRO Manager
VWO has been so helpful in our optimization efforts. Testing opportunities are endless and it has allowed us to easily identify, set up, and run multiple tests at a time.
Elizabeth Levitan
Digital Optimization Specialist
As the project manager for our experimentation process, I love how the functionality of VWO allows us to get up and going quickly but also gives us the flexibility to be more complex with our testing.
Tara Rowe
Marketing Technology Manager
You don't need a website development background to make VWO work for you. The VWO support team is amazing
Elizabeth Romanski
Consumer Marketing & Analytics Manager


![Top 10 Shopify Heatmap Apps [With Features – 2026]](https://static.wingify.com/gcp/uploads/sites/3/2020/04/Feature-image_Shopify-Heatmaps-All-you-need-to-know.png?tr=h-600)