VWO partnered with Christopher Nolan for this exclusive Masters of Conversion webinar to share his experience and emphasize the learnings of failed experimentation.
Christopher Nolan is a data-driven growth strategist at ShipBob, which is a tech-enabled fulfillment service company. Following are the key takeaways from the session:
Download Free: A/B Testing Guide
Experimentation and growth strategy
Chris’ focus has been growth during the course of his entire career and he deems experimentation and insights fundamental to grow in any industry. He advocates building an essential experimentation ecosystem as a foundation to test, track, and analyze your test results with confidence backed by data. The results could either be good or bad.
Key learnings from bad test results
- When you build a strong foundation for your testing by identifying the correct combination of tools, you will have confidence in your data.
- It’s not enough to call a test a failure when it doesn’t meet your KPIs. You need to take a step back and analyze why something that everyone agreed had benefits failed. When you do this, you will derive a ton of value that will guide your subsequent tests. An integrated testing system with analytics and tag management tools will help you with this analysis and bring forward important insights.
- As with failed tests, it is necessary to analyze the ‘why’ of test results even when a test is a success. Don’t take the results at face value and dig deeper into what got you there.
- When you’re communicating test results to the leaders in your company, show them the confidence you have in your data. Talk about your test results against the KPIs, and the insights you derived from the same. Be prepared with the next steps; tell them what you plan to do with these insights. With time, teams will be as happy with insights, as they are with positive results.

Pros and cons of A/B testing set-ups
An efficient experimentation set-up comprises an A/B testing tool to test your hypotheses, integrated analytics to gauge user behavior and site engagement, and a tag management tool which is a developer-less code implementation software that allows you to inject scripts.
Pros
- With a testing set up (such as VWO) in place, it is easier to define goals and create hypotheses based on your business’ KPIs, and replicate the same across tests.
- The testing set up offers you built-in visual reporting tools, such as heatmaps, scrollmaps, etc.
- The set up enables you to derive insights from raw data with the help of its built-in statistical significance measurement tool.
Cons
- You can only track user-defined goals, which means you need to define a goal before the test in order for it to be tracked.
- There is some restriction on what you can track in your goals and the number of ways in which you can slice your reporting is also limited.
Advantages of CMS and Web Analytics integrated testing tool
- It is easier to track customer data on the web pages you are testing by installing the tag manager high on the page.
- It is easier to install tag managers within a CMS like WordPress, without needing a developer per se, as CMS offer plenty of plugin options.
- You can form segments and custom dimensions within the CMS if it is integrated with Google Analytics, which can help track user behavior to achieve your business goals.
Biggest failures led to the biggest testing wins
The BIG failed test by Chris was on BigCommerce’s pricing page. And that led to Chris’ biggest testing win.
Chris took what he calls as the “big swing” by redesigning the pricing page at BigCommerce, a SaaS company. The “big swing” failed as it resulted in a 4% decrease in the primary KPI – the trial conversion rate, and a 25% decrease in the demo conversion rate, which was a secondary goal. However, with the help of heatmaps, scrollmaps, and navigation summaries, Chris gathered insights that helped him find what was impacting the KPIs. These insights were:
- Mobile users liked the new design
Using scrollmap, it was found that visitors were finding it easier to scroll the pricing page to see all the features and plans before they made a decision in a shortened version for the mobile variation.
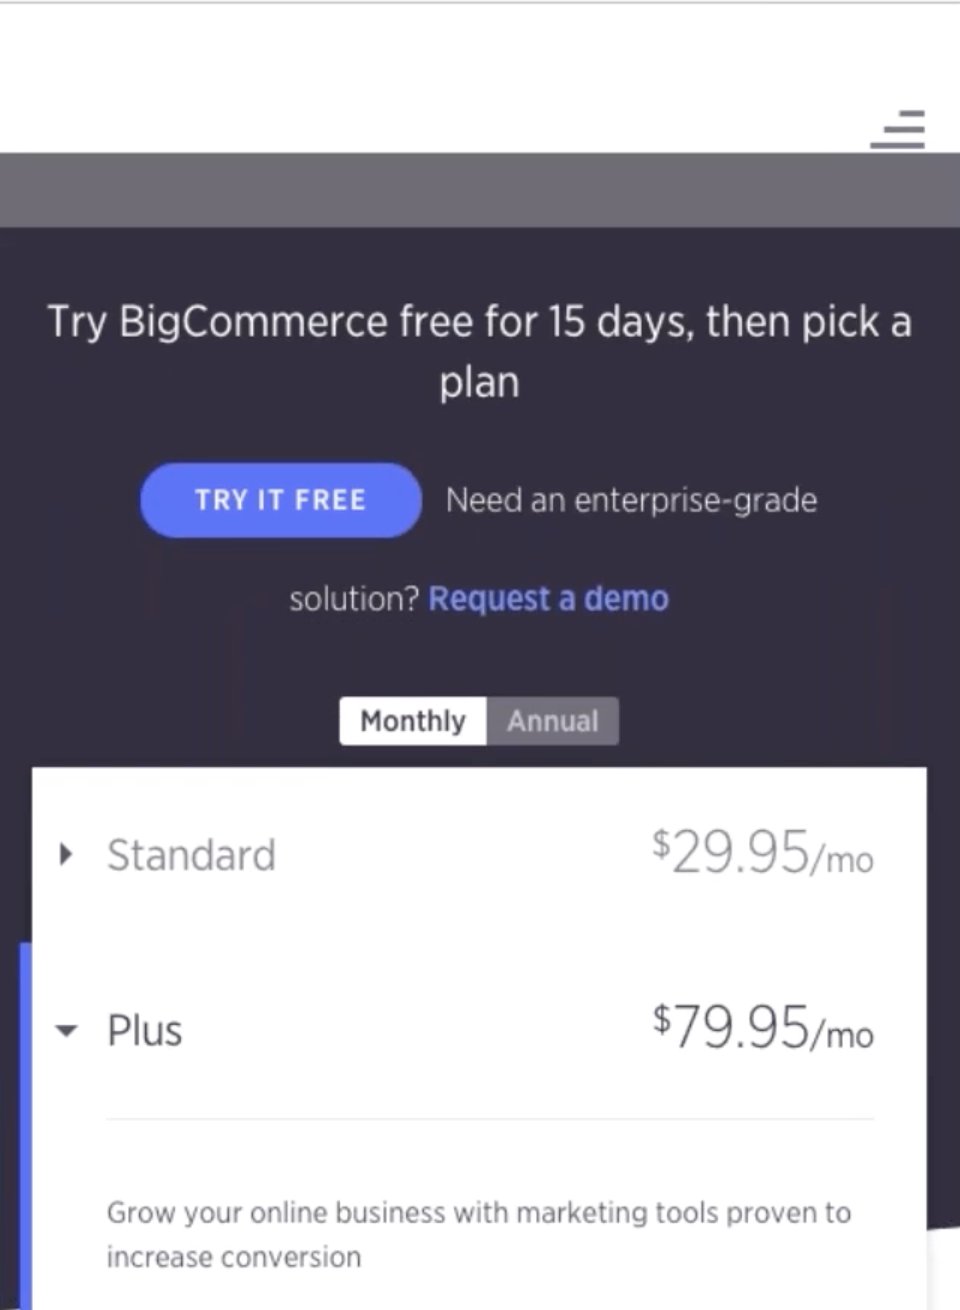
Image Source: BigCommerce
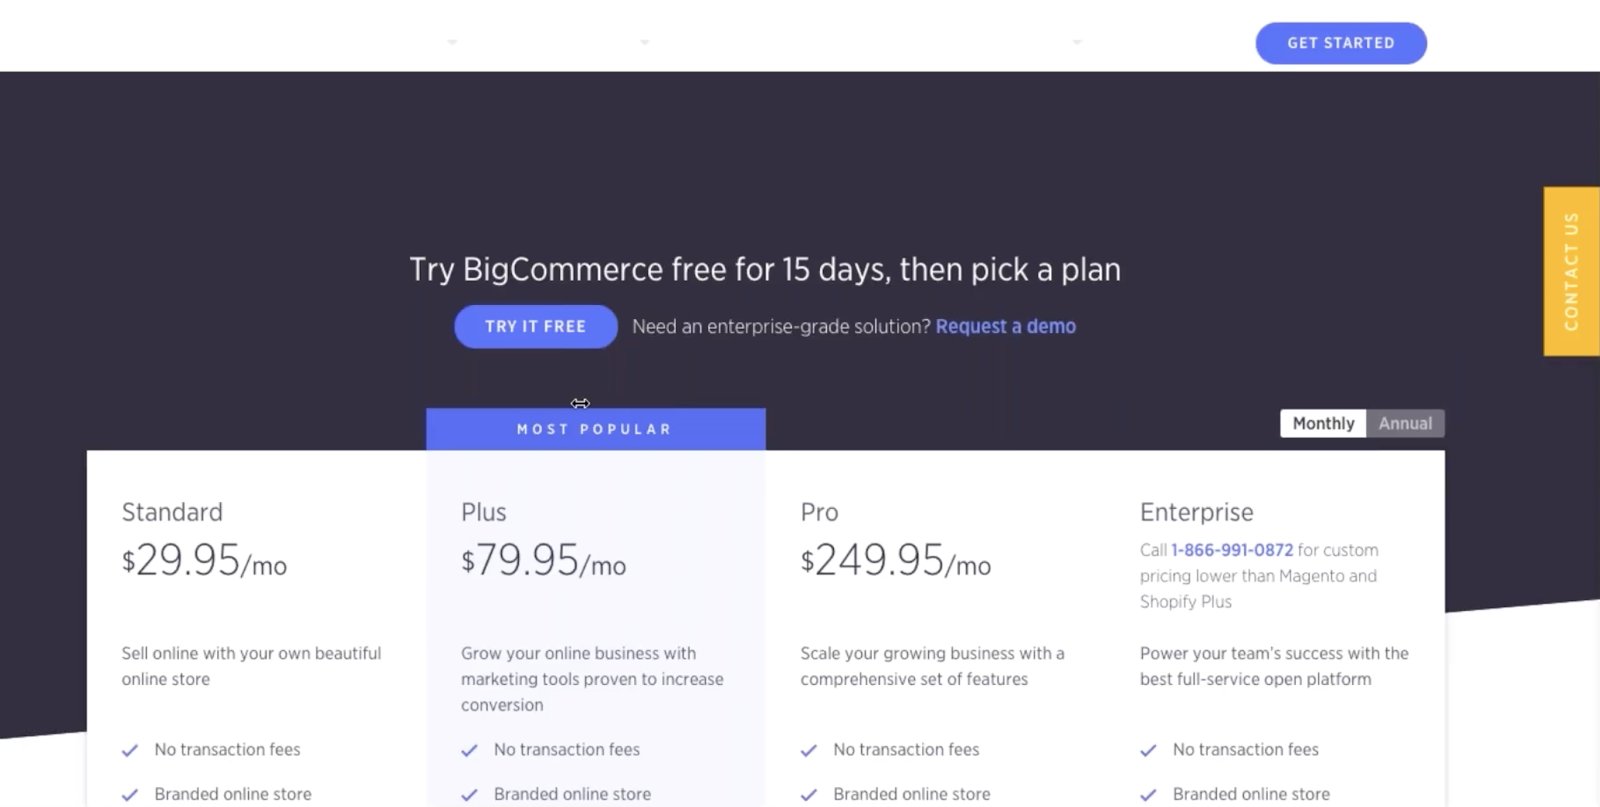
Image Source: BigCommerce
- The payment link is incredibly important
It was found during the navigation summary of the control version that visitors were clicking on a small link (the ‘Learn more’ link shown in the image below) by scrolling down. This link was removed in the variation.

The link ‘Learn more’ became the “money maker” (revenue maker) for the pricing page as it drove massive taps
Image Source: BigCommerce
- Toggles between Monthly and Annual plan modes drove more taps
The monthly-annual toggle on the pricing page drove more taps and scroll depth that correlated with trial conversion that did occur. However, this correlation could not be deduced from the heatmap as it only showed user behavior inferring that the KPIs were not met.

Image Source: BigCommerce
These insights led the team to create a V2 of the pricing page. This page had the toggle placed at the left bottom of the page and payment link retained from the control, based on the navigation summaries of the pricing page.
It saw a 15% lift in the trial conversion rate and 45% lift in the demo conversion rate.
Impressive, right?
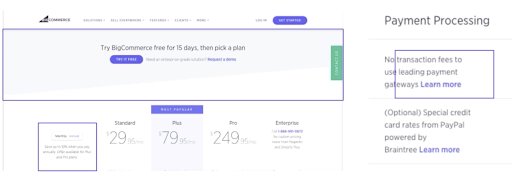
Image Source: BigCommerce
The successful test of pricing page at ShipBoB
Previous learnings anchor your next experiment – when Chris joined ShipBob, the first thing he looked at based on his experience was once again the pricing page.
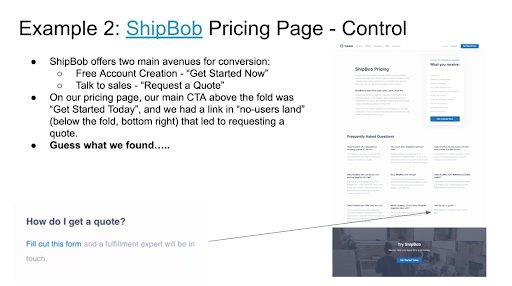
The form abandonment rate at ShipBob’ pricing page was 30%. Instead of testing the ‘Get started here’ call-to-action(CTA) button, which was placed above the fold and was the main CTA, he ran a test for the CTA copy ‘Request a quote’ link.
This link was placed in a no man’s land at the bottom right of the page, and 11% of all users landing on that page were tapping this tiny link.
Chris’ learnings at BigCommerce paid him well. He chose to make ‘Request a quote’ link as the main CTA instead of ‘Get started here’ for creating accounts. It resulted in a massive 104% lift in their new ‘Request a quote’ link clicks, using link tracking in Google Analytics.
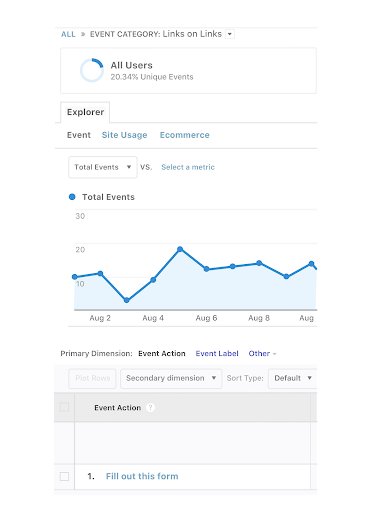
Image Source: Google Analytics
His variation was a winner. However, learning from the insights, which included intensive study of the navigation summaries, tracking link, and scrollmaps data of the page in the analytics, led him to take a decision to maintain the conversion rate.
After a successful test, he found a link that he thought of getting rid of from his winner variation (shown in the image below). But through link tracking events configured in GA, it was found that users were still interacting with that small link at the bottom of the page, contributing to the overall conversion.
Download Free: A/B Testing Guide
Effectively communicate test results to the leadership
- Highlight the importance of the test and your main KPIs.
- Bring on the table the key insights from the test results.
- Show your variations in the form of images (screenshots) with KPIs, followed by an insight, if you have one. For example, in Chris’ case at BigCommerce:
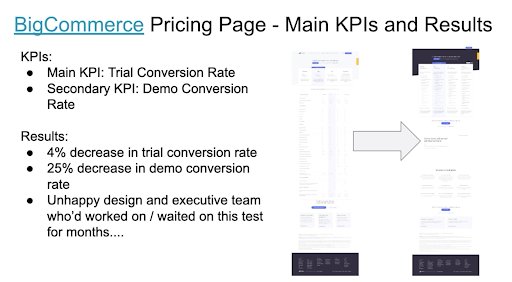
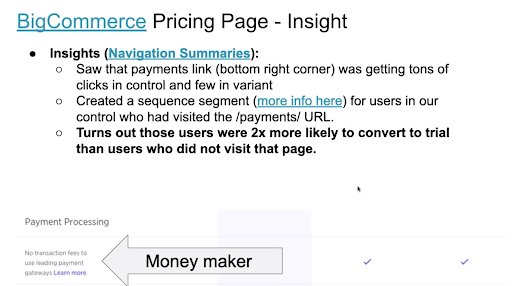
Image Source: BigCommerce
- Show the methodology if you have Product Heads and Chief Technical Officers in the room. For example, if they ask you how you tracked the link, you can show them the event you created along with the data in analytics.
- Link your data to your insights for credibility: If you have the Google analytics data pulled into an Excel spreadsheet, link your insight to it. It may be messy or raw but that is going to give you confidence that you’re not pulling these numbers out of thin air.
- Talk about specific successive plans to answer their ‘What’s next?.”
Learn from GTM and GA in test results
Use Google Tag Manager and Google Analytics in your testing to their full potential by digging into and deriving insights from:
- Navigation summaries
- Video engagement
- Chatbot engagement
- Scrollmap and link tracking
- Form fill engagement
- Custom dimension by pushing GA client ID
VWO and testing
VWO produces tools that help businesses adopt experimentation and fosters a company-wide culture of experimentation within. Everyone has to go through the beginner phase while embracing the testing culture and encounter more failures than wins. But that’s where the true value and potential for growth lie. Don’t let the failed tests discourage you, instead observe them keenly to look for opportunities posing unbound potential that’s waiting to get tapped.
