It wouldn’t be an exaggeration to say that we at VWO are very passionate about experimentation.
Not only have we built a product around A/B testing and conversion optimization, but we are always looking for ways to run experiments on our website.
Recently, we got our entire team to actively research and contribute ideas for optimization on our website and ran multiple tests. This post is a narrative of what we did after.
Download Free: A/B Testing Guide
Who Is This Post for?
This post will help SaaS growth-hackers, marketers, and optimization experts to predict the business value from an a/b test.
The aim of this post is to not only share the tests we ran on our website, but also introduce a revenue-based framework that predicts the business impact of an A/B test and prioritizing on the basis of it.
Revenue-Based Optimization
Need for a Model
After we propelled our team to suggest ideas for testing, we had more than 30 hypotheses looking at us, but no distinct way of knowing which of these to take up first. Of course, there is a range of prioritizing frameworks available, but we particularly wanted to look at the ones that would directly impact our revenue.
This framework helped us project the potential impact on the revenue from each test. Here’s what we did:
Step 1
We decided to identify high-impact pages and winnow the pages that were not as important for our business, that is, pages where no goal conversions take place. We looked at Google Analytics for pages with the:
- Highest Amount of Traffic
(We used “New Users” to nullify visits by existing customers.) - Highest Number of Goal Conversions
(Goal conversion, which contributes to your overall business goal, is the main goal for your website. In our case, this meant all qualified lead-generating forms. A free trial or request a demo qualifies a visitor as a lead with a genuine interest in our product; or, as the industry popularly refers to it, a Marketing Qualified Lead.)
This gave us a list of pages which were high-value in terms of, either traffic generation or last touch before conversions.
We identified the following key pages:
- Free-trial page
- Request-a-demo page
- Homepage
- Pricing page
- Features page
- Blog pages (All)
- Contact-us page
Step 2
Our main objective was to project an estimated increase in the revenue due to a particular test. If your test increases the conversion rate by say 20%, what would this mean for your business and, in turn, the revenue?
Note: You should use data from the recent 3–6 months, and the average (mean) of each stage of your Marketing funnel, which are explained below. This is to accurately reflect what to expect from your testing and be relevant to your business.
For each of the “Key Pages” we identified in the first step, we also dug out the corresponding numbers at each funnel stage. We’ve explained each stage of the funnel and how it is calculated:
a) Key Page Traffic: The total number of pageviews per Key Page (new users in our case). You can find the data in Google Analytics.
b) Total Conversions: The total number of leads generated from each particular page. If there is an additional qualification your company follows, source this data from your preferred CRM or Marketing Automation software. For example, at VWO, we use Clearbit to qualify our leads in Salesforce.
c) Opportunities: The total number of opportunities generated for your sales team. This data will be available in your CRM; make sure to count qualified opportunities only.
d) Customers: The total number of customers created in a month.
e) MRR (New): Or monthly recurring revenue, means revenue booked on a monthly basis; you can use this to estimate annual recurring revenue, or ARR, as well.
Step 3
Now that we had all the numbers needed in our arsenal, I decided to calculate some more internal benchmarks. This gave us the performance of our marketing and/or sales funnel.
- We computed the conversion rate of a particular page, using the following formula:
Existing conversion rate = (Total Conversions Key Page Traffic); this is represented as % - The conversion of your leads into opportunities:
(Opportunities ÷ Total conversions) × 100, represented as % - The conversion rate of opportunities into customers:
(Customers ÷ Opportunities) × 100, represented as % - The average revenue per user or ARPU:
Total MRR ÷ Total number of paying customers
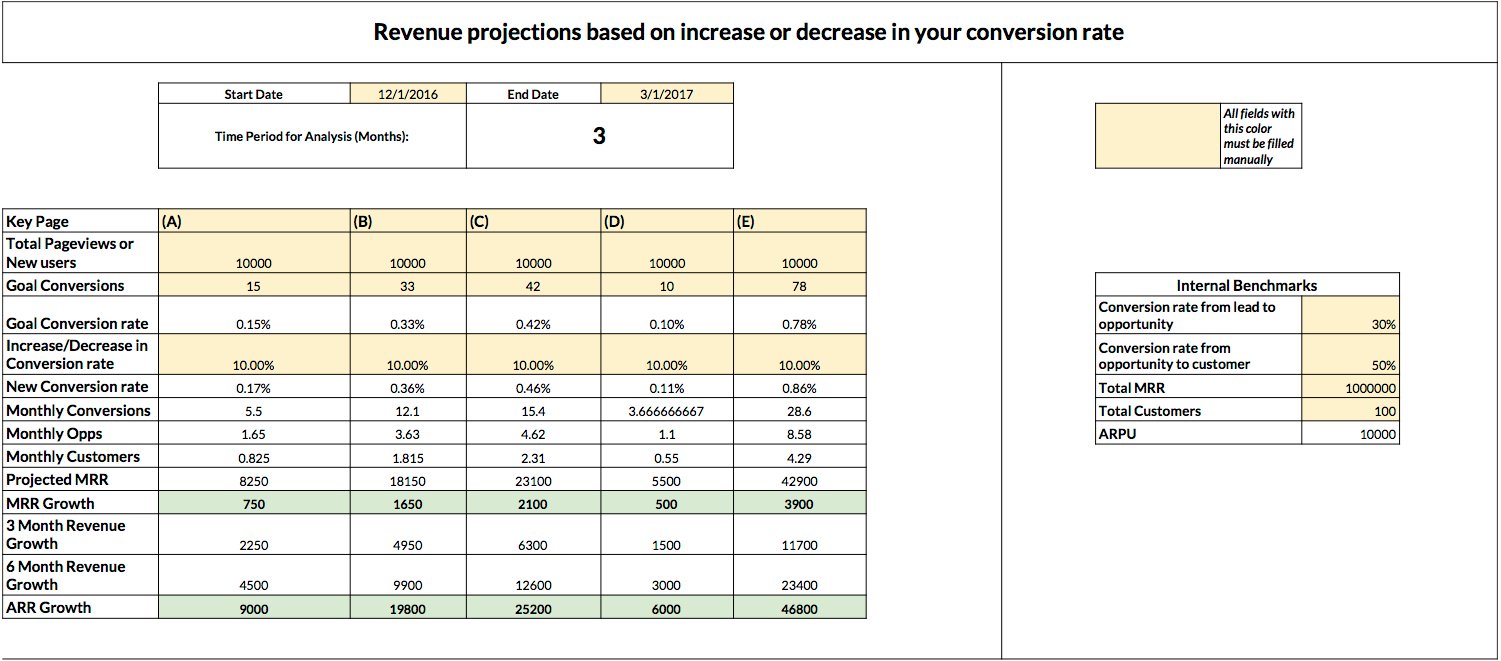
This is what our final dashboard looked like:
The model uses all of that data and projects how much revenue increase or decrease you can estimate based on your test results. This estimate can give you a good idea of where to begin or prioritize your testing.
Step 4 (Optional)
This is where it may get tricky. At VWO, we sell both Enterprise plans and Standard plans. So to be fair, we must estimate each cohort with separate data and individual conversion rates.
For example, Opportunity creation % for an Enterprise plan may be lower, but a Standard plan is easier to convert. You may want to decide what type of plan do you want to focus on.
We, for instance, used website traffic and Alexa rank as the benchmark for lead qualification. We attributed more value to the leads that came in through key pages and prioritized them.
This led us to the next step, which is the qualification rate of the said lead of high value. This rate may be in the range 30–50%, depending on your definition.
It was interesting to note that each page had a different qualification rate. For example, we get better quality leads from our Request a demo page than we do from our free trial or blog post page.
Download Free: A/B Testing Guide
Tests Conducted:
After we had the model in place, we played around with the increase or decrease in our conversion rates. This was to identify what would be our best optimization opportunities?
The free trial pages and the home page were among the high-priority pages, in terms of the impact of revenue. (Unfortunately, I can’t share the exact numbers with you.) We first looked at the hypotheses on the free trial page:
Test 1 – Free Trial Page
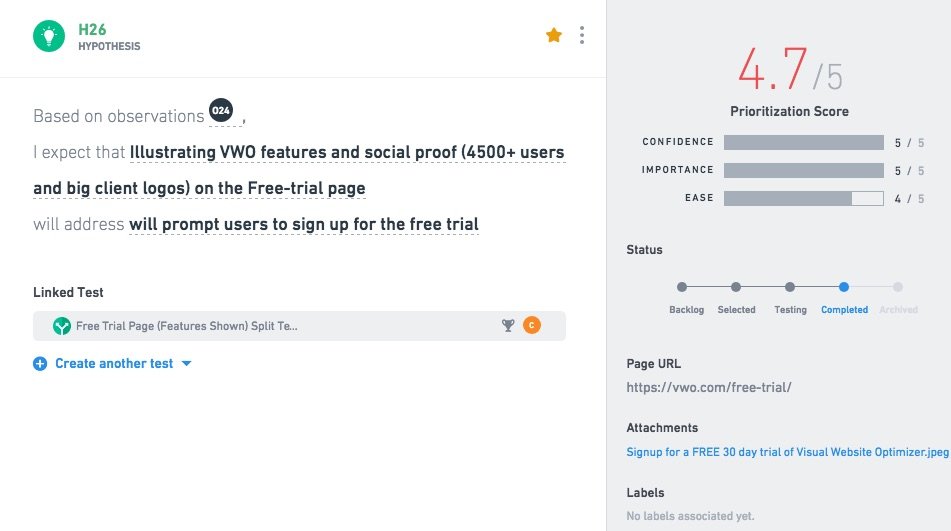
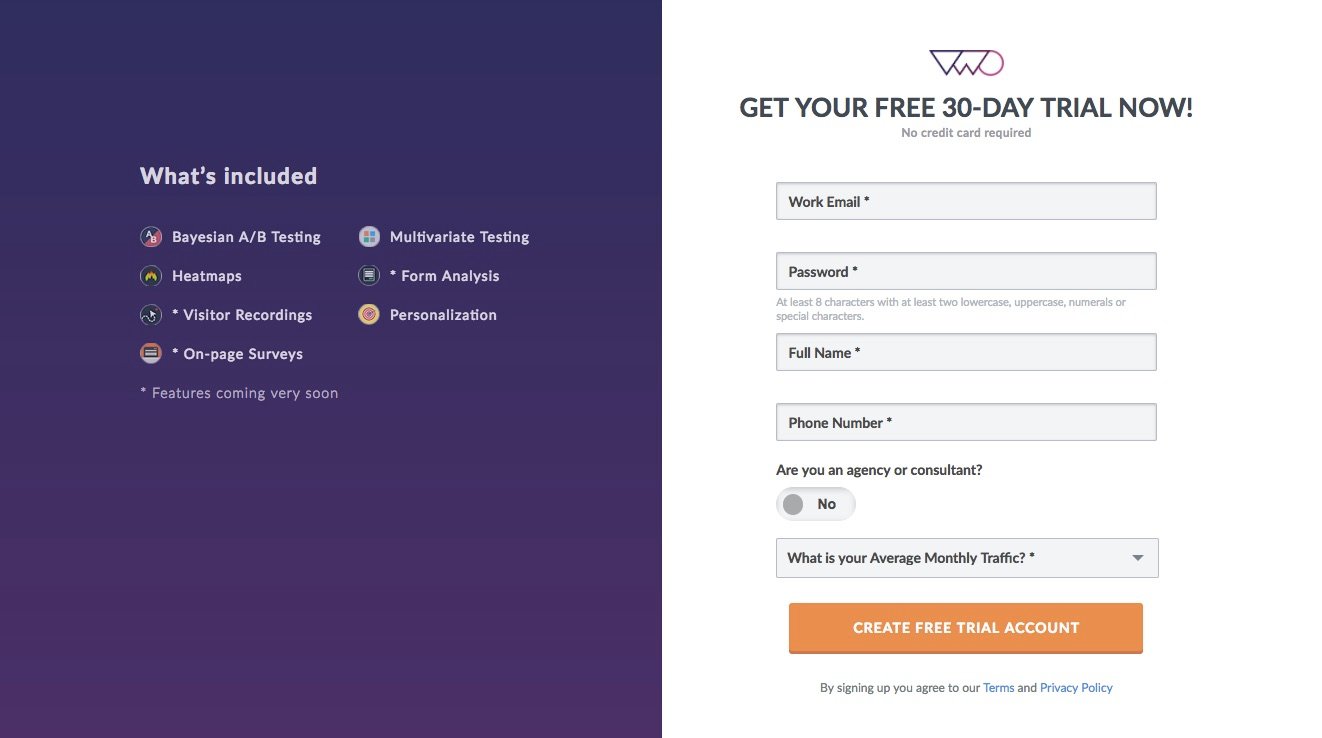
Our hypothesis was “Illustrating VWO features and social proof on the free trial page will prompt users to sign up for the free trial.”
Here is a screenshot of what it looks like in VWO.
Bonus tip: VWO has recently launched a new capability called PLAN that lets you manage and prioritize your testing hypotheses. To learn more about this capability, visit the VWO Plan product page.
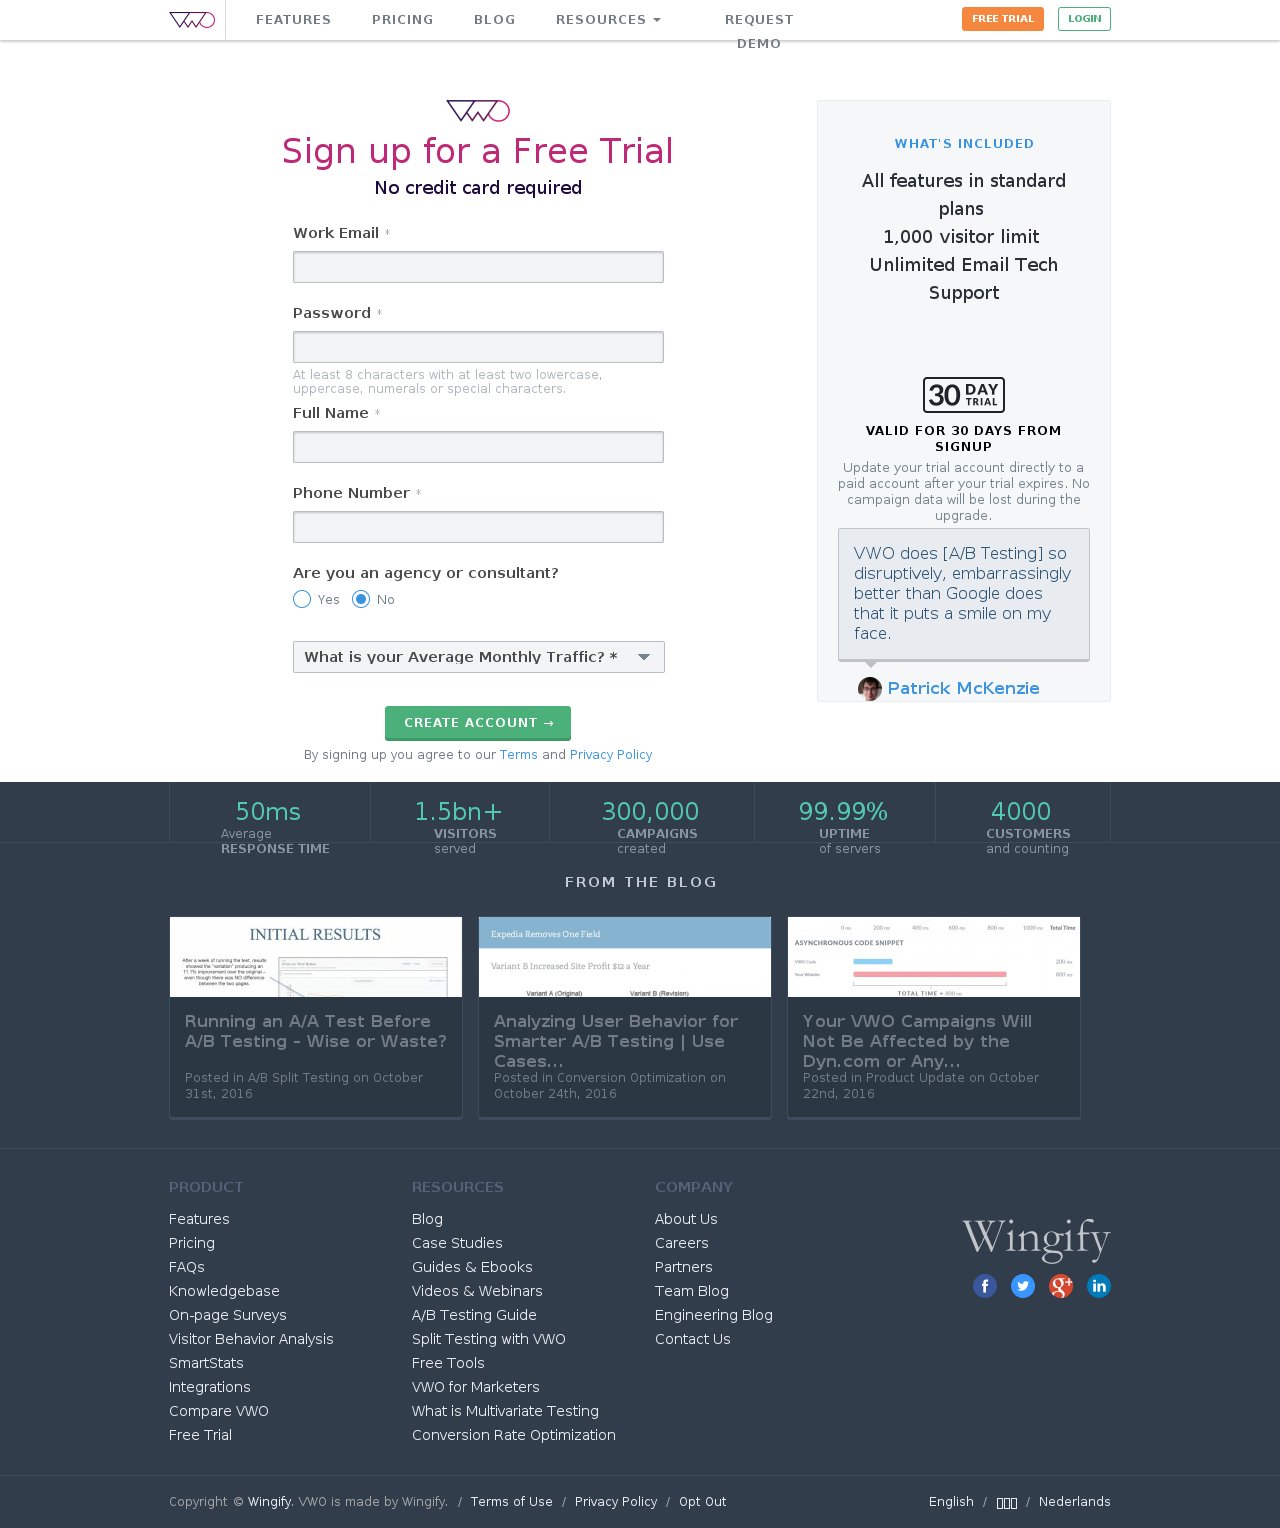
This is what the control looked like:
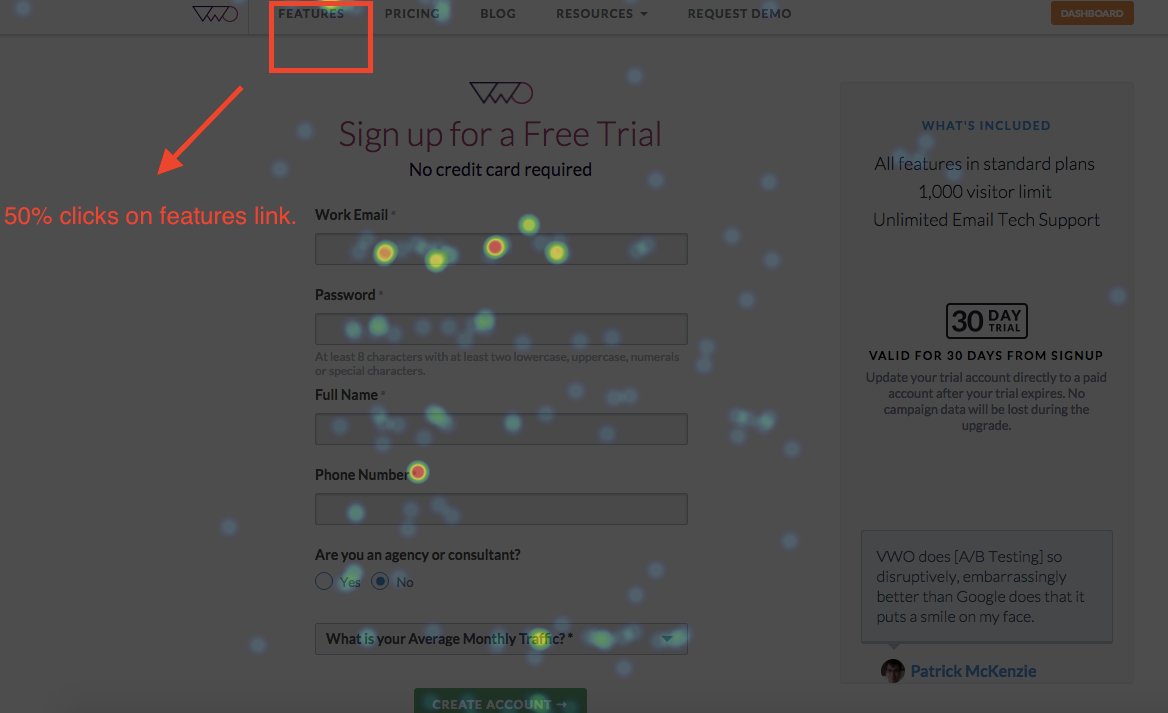
Our heatmap data also showed a lot of users clicking the features page after accessing the free trial page.
Screenshot of heatmap data:
We created a variation which included the features we offer to solve this issue. Here’s a screenshot of the same.
This is our current free trial page:
We ran the test for over 2 months. The result was an increase of 6% in our conversion rate, which led to increased revenues.
Test 2 – Request a Demo CTA (A/B Test)
The main CTA on the homepage has been the free trial CTA. The headline on the homepage was “A/B Testing Software for Marketers.”
The hypothesis for the test was “We will get more qualified leads through a request a demo CTA on the homepage.”
This is what the control looked like:
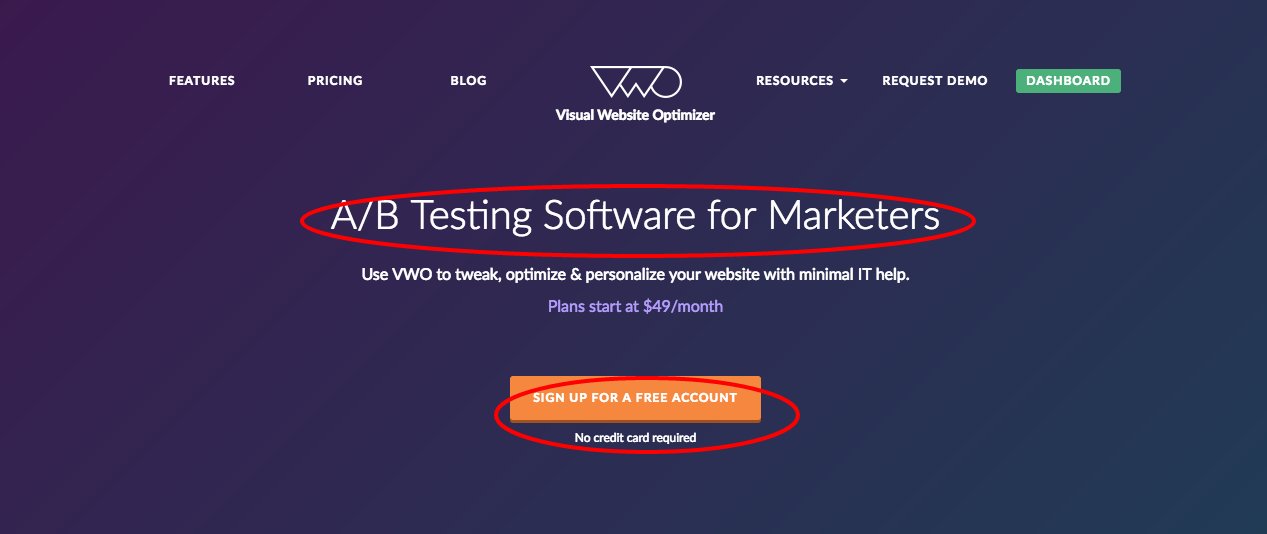
We came up with a more targeted copy and changed the existing CTA to Request A Demo. Here is what the variation looked like:
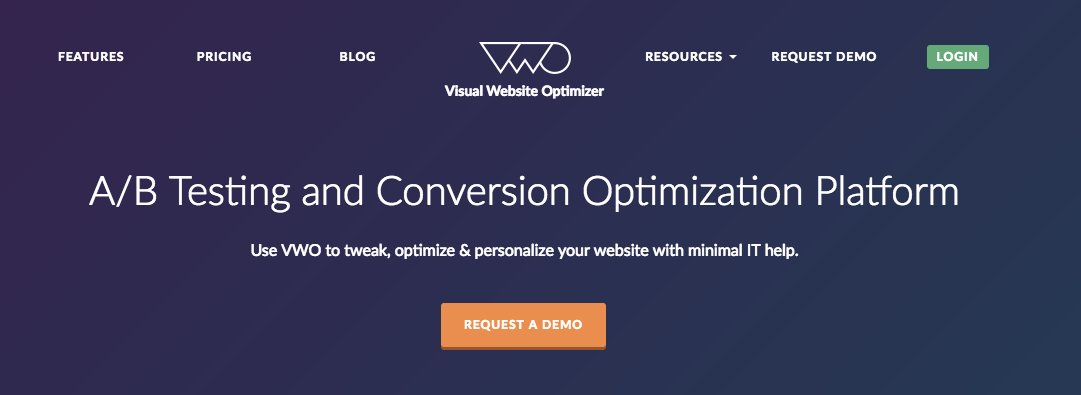
We also wanted to change our positioning due to our foray into Conversion Optimization. The results from this test were that our variation beat the control and had more than 31% improvement in the conversion rate.
Based on the first example, we have already implemented the new free-trial page as our main free-trial page now. Based on the second test, we updated our home page.
All in all, this model helped us correctly predict the best optimization opportunities, make our testing better, and more strategically aligned to business goals.
Let me know your experience with this model and how you go about testing.
Would love to know your feedback on this. Please email us at marketing@vwo.com!
Note: The author owns screenshots used in the blog.
Categories: