Nature vs nurture.
Do you know what this age-old debate is all about?
Intellectuals are divided on whether human personalities are predominantly influenced by genetics (nature) or by external factors such as upbringing and life experiences (nurture).
Interestingly, despite years of discussion, this debate remains without a clear victor.
And this is just one example. There are numerous ongoing debates yet to be settled.
For CRO enthusiasts like us, the perennial discussion around quantitative versus qualitative research is one such hot debate topic.
But do we have to choose one over the other? Can’t they work in tandem?
In this blog, I will tell you when to use which research method and how to combine them to get the best of both worlds.
Let’s start.

What is quantitative research?
Quantitative research is centered around numbers, focusing on ‘what’ and ‘how many.’ This method helps us understand how well a website is doing in turning visitors into customers. By utilizing methods like surveys, polls, and experiments, quantitative research helps you gather data and analyze it to identify patterns and trends. This enables you to make informed decisions based on concrete facts and figures.
Why is quantitative research important?
You can’t improve what you don’t measure. And quantitative research helps you measure. There are business cases where you will find no substitutes for quantitative research.
Performance tracking
Quantitative research facilitates ongoing monitoring of optimization efforts. Tracking key metrics such as bounce rate, click-through rate, and conversion rate helps you gauge the impact of modifications you are making on your website and refine strategies accordingly. In other words, quantitative data points reflect whether visitors are engaging with your website as intended and positively impacting your key metrics.
Objective evaluation
This type of research ensures an unbiased assessment of website performance. By relying on numerical data rather than subjective opinions, you can objectively evaluate the effectiveness of your website, leading to informed decision-making and more effective optimizations.
Quantitative research examples
Build a question around a metric and then assess its performance. This way, you will find what you’re looking for instead of getting lost in an ocean of numbers. Here are some examples of doing it:
- How many conversions (e.g., purchases and sign-ups) occur on my website daily, weekly, or monthly?
- What is the average session duration for each page on my website?
- What is the bounce rate for the checkout page?
- How many unique visitors does my website receive each month?
- What are the most popular pages on my website, based on page views?
- What channels are visitors using to land on my website?
Now, how do you interpret the data and find questions to these answers?
Keep reading, and you’ll know.
For example, to find the bounce rate for the checkout page, log into Google Analytics. Then, go to the relevant section and filter for the checkout page. The bounce rate tells you how many visitors drop off without taking any further action. If it’s below 55%-60%, it’s okay. But if it’s higher, you need to delve deeper into the problem, like where exactly the problem is occurring and what pain point the visitor is facing.
Such research data gives you solid groundwork to build your improvement plan.
Quantitative research methods
Let’s explore simple methods to access the important numbers for your quantitative research.
Website analytics
Google Analytics (GA) is a go-to tool for website analytics data, but you can also use other tools like MixPanel. You can track metrics like page views, bounce rate, and conversion rate. By analyzing this data, you can find where your site needs help—like pages where people leave fast or don’t buy—and make improvements.
Survey ratings
Closed-ended surveys offer predefined options for respondents to choose from, making it easier and quicker for them to provide feedback on their website experience. This method efficiently gathers the numbers you need to understand visitor sentiment. Here is a rating-based survey question you can ask:
On a scale of 1 to 5, how would you rate your recent website experience?
- Very Dissatisfied
- Dissatisfied
- Neutral
- Satisfied
- Very Satisfied
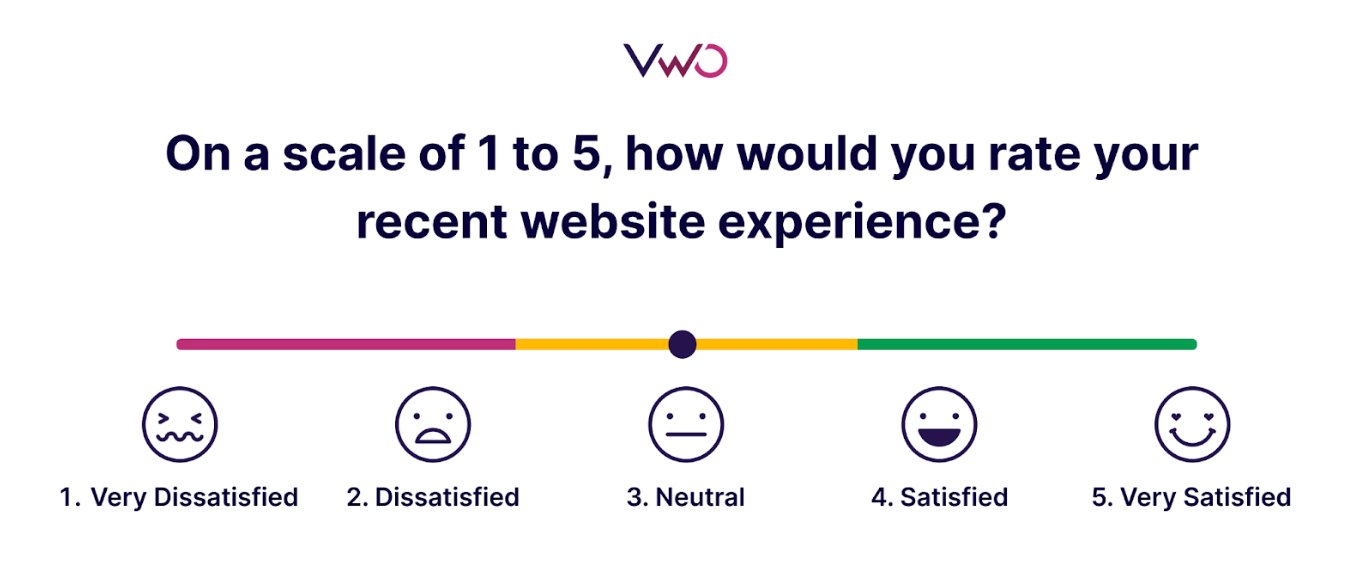
Ratings can provide a general indication of how satisfied visitors are with your website. Higher ratings generally indicate greater satisfaction, while lower ratings suggest areas for improvement.
Experiments
A/B testing and other types of tests like multivariate testing are quantitative research methods because they rely on data to make statistically significant conclusions. Here’s how they work – Let’s say you are running an A/B test on your website to determine which version of the home page leads to more conversions – the original or the variation. After running the test for a set period, let’s say the variation resulted in a 24% more conversion rate than the control. Based on this quantitative data, you conclude that the variation is more effective at driving conversions.

What is qualitative research?
Instead of just looking at numbers, qualitative research digs deeper to uncover the reasons behind their actions. It is all about gathering stories, opinions, and observations from target audiences to understand their thoughts and feelings. This helps businesses get a clearer picture of what their customers want and why, so they can make better decisions to meet their needs.
Why is qualitative research important?
Only qualitative research provides the depth needed to validate the problems on your website by going beyond mere numbers.
Understanding visitor behavior
Qualitative research allows you to delve deeper than numbers and uncover why visitors behave the way they do. By exploring user needs, preferences, and motivations behind their actions, you gain valuable insights for tailoring website content, features, and design elements to better meet expectations and enhance the overall user experience.
Validating qualitative data
By providing a subjective view of visitor experiences, qualitative research can help validate findings from quantitative data. This ensures that optimization efforts are grounded in visitor insights.
Qualitative research examples
Here are some examples of how qualitative data can be used to infer the underlying problems or issues on your website.
- A visitor praised the clear and intuitive layout of your website but suggested improvements to the descriptions on your service page in response to your survey question.
- As indicated in the heatmap, the hot red color for the ‘Continue shopping’ button and the cool blue color for the ‘Proceed to checkout’ button show varying levels of interaction with these buttons.
- Observing visitors struggling to find something during a usability testing session is a form of qualitative research.
Qualitative research methods
Which methods lead us closer to observing and understanding visitor behavior? Let’s delve into them below.
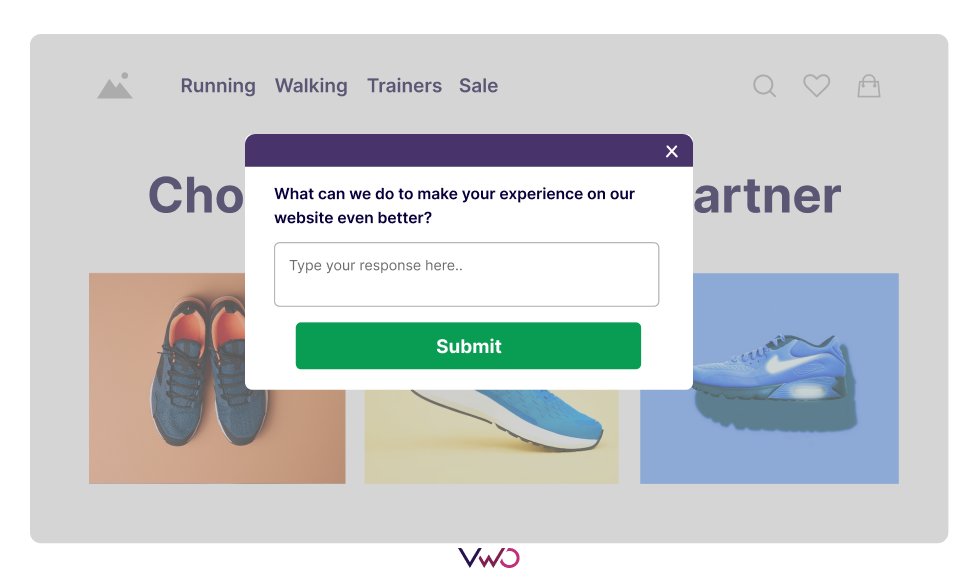
Open-ended surveys
Open-ended surveys are valuable because they give clear direction and go beyond ratings. They allow visitors to explain exactly what they liked and didn’t like about their experience with your website. If you see a visitor suggesting the pricing page needs improvement for a better comparison of plans, take note. And if you see more visitors echoing the same thought, you’ll know it’s a clear case of a collective pain point that must be addressed. Learn how VWO Surveys uses AI to generate summaries of your survey responses to bring you key insights without manual effort. Take a free trial to explore the feature and see if you like it.
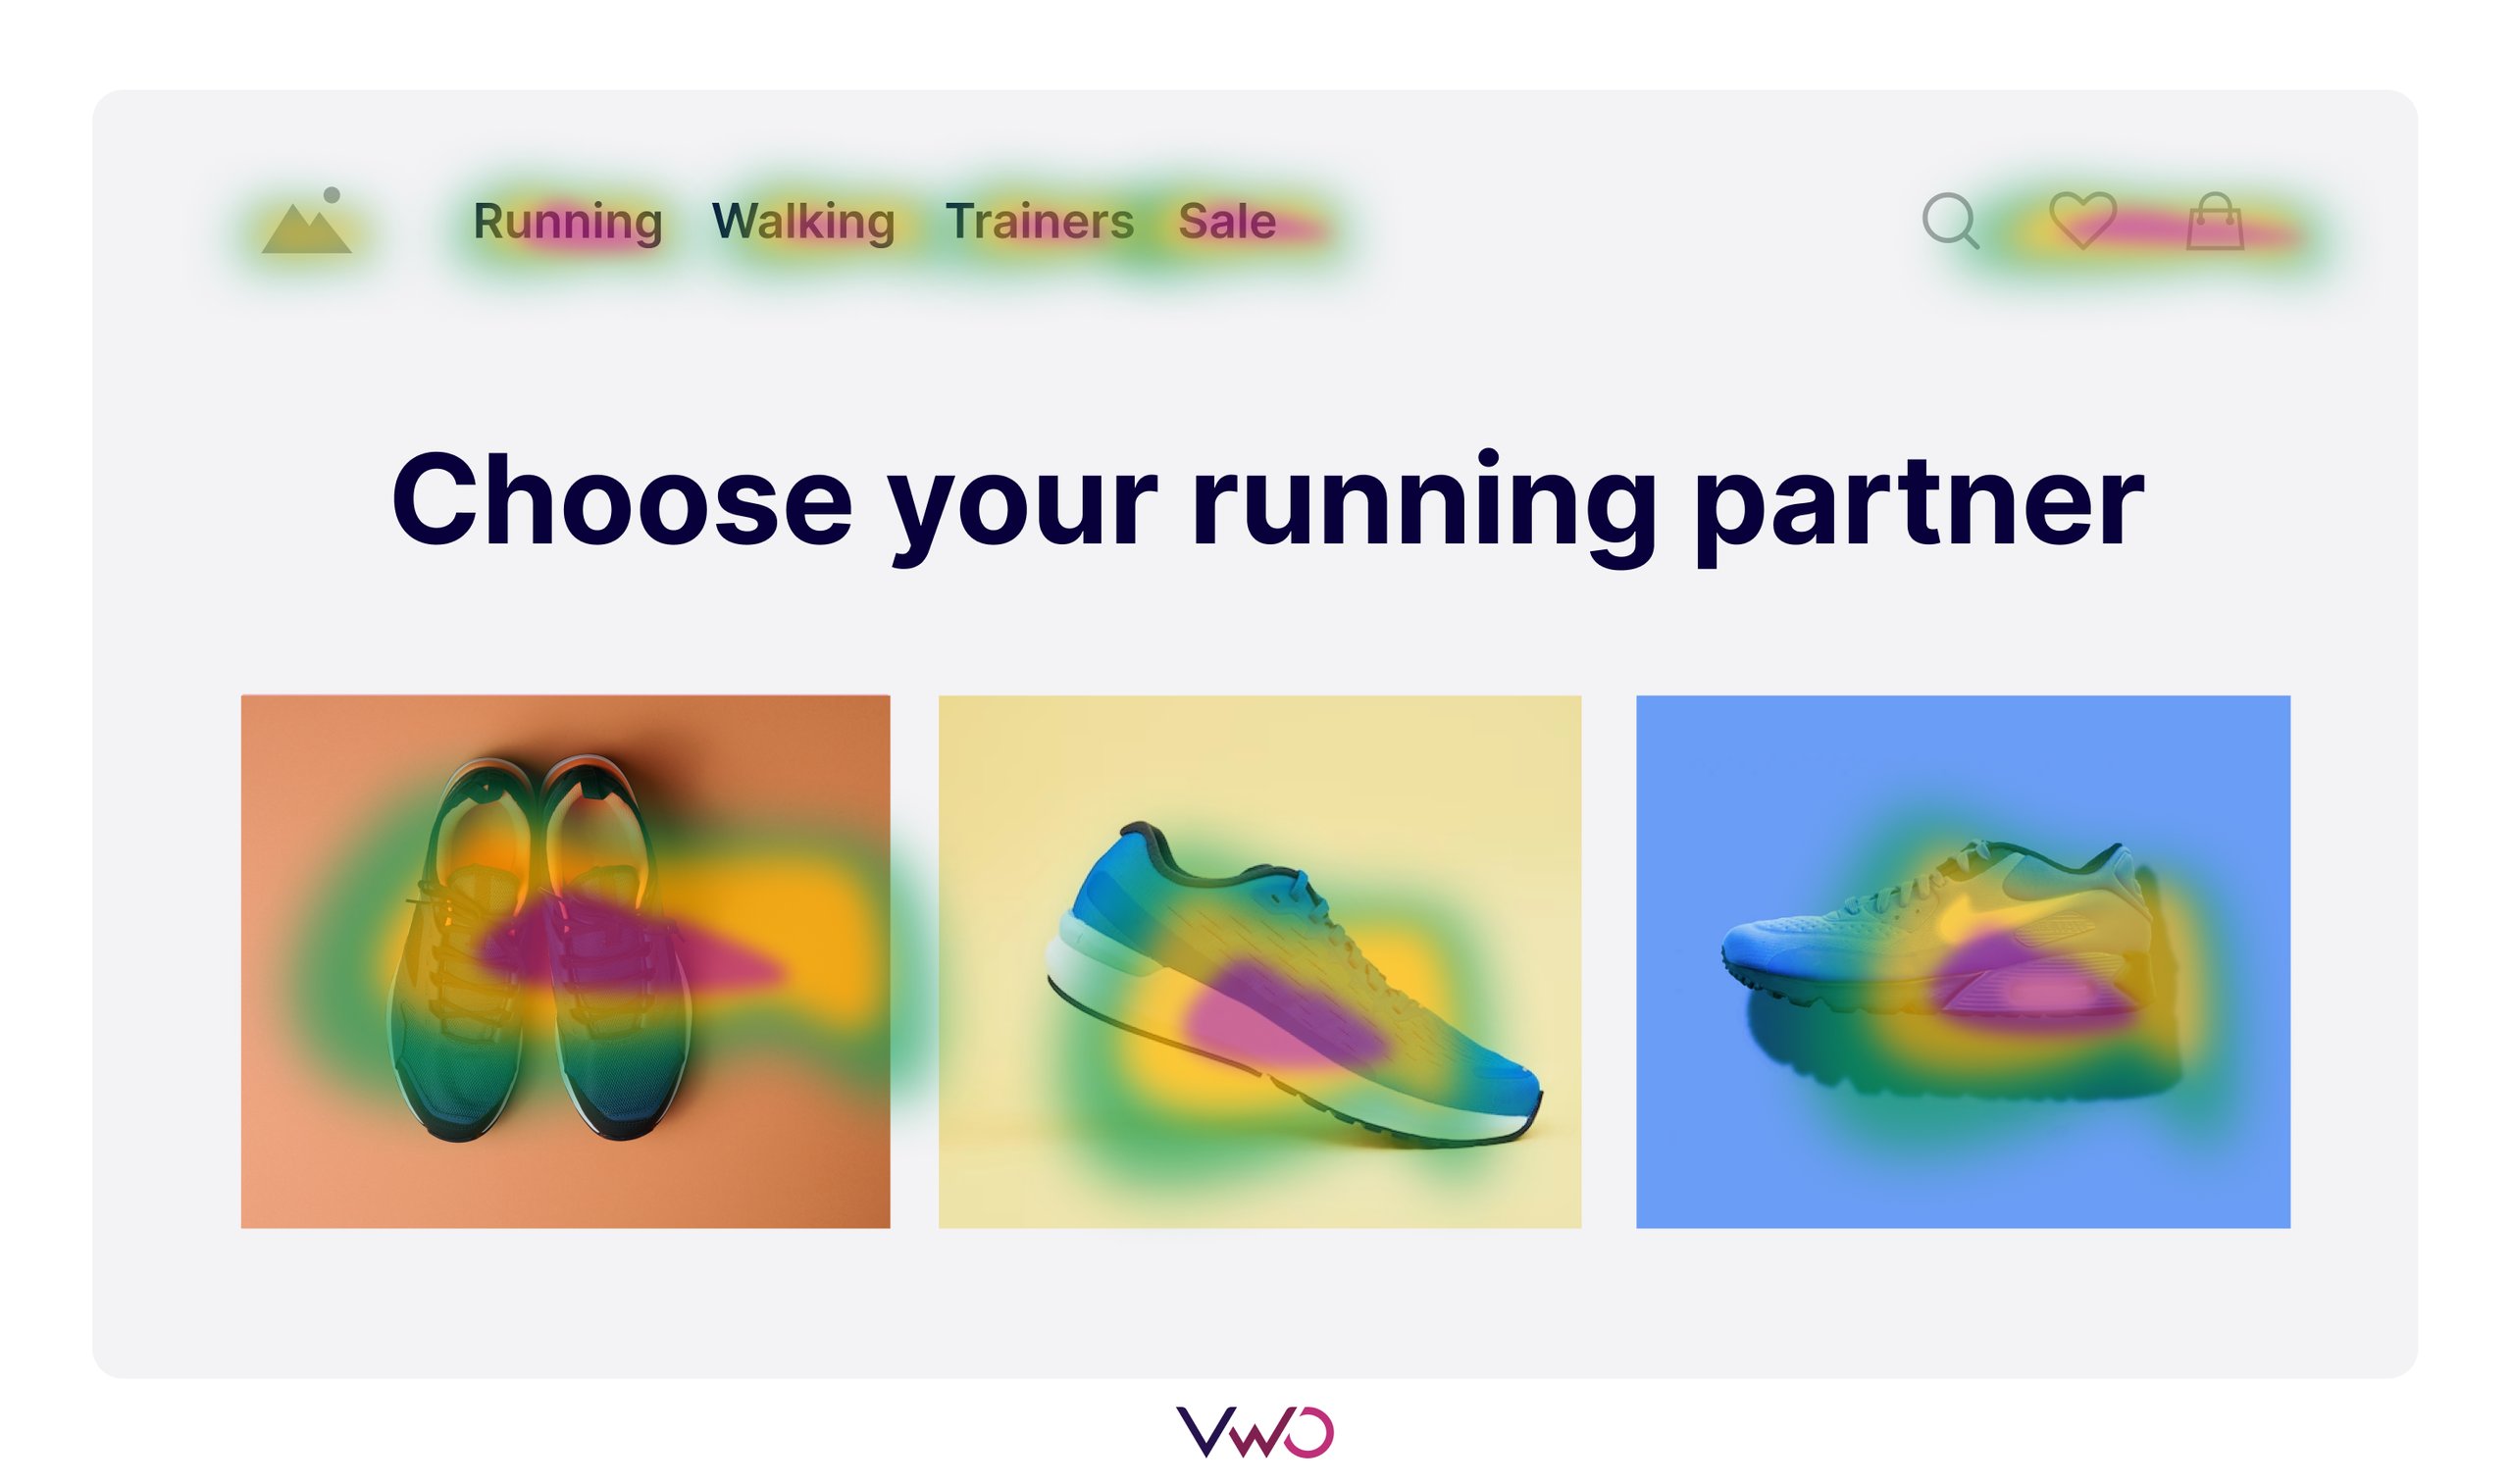
Heatmaps
Heatmaps provide a visual representation of visitor behavior on your website through color coding. Warm red indicates high engagement, while cool blue signifies low engagement. Each level of visitor interaction is explained through colors. They are convenient for beginners who may not be comfortable reading data yet and need a visual aid to make sense of visitor behavior.
Clickmaps (no. of clicks on areas)
Clickmaps fall under the umbrella of heatmaps, and they specifically display the “number” of clicks on individual elements on a website. By analyzing the clickmap, you can identify which elements get the most interaction, thereby indicating visitor behavior.

Session recordings
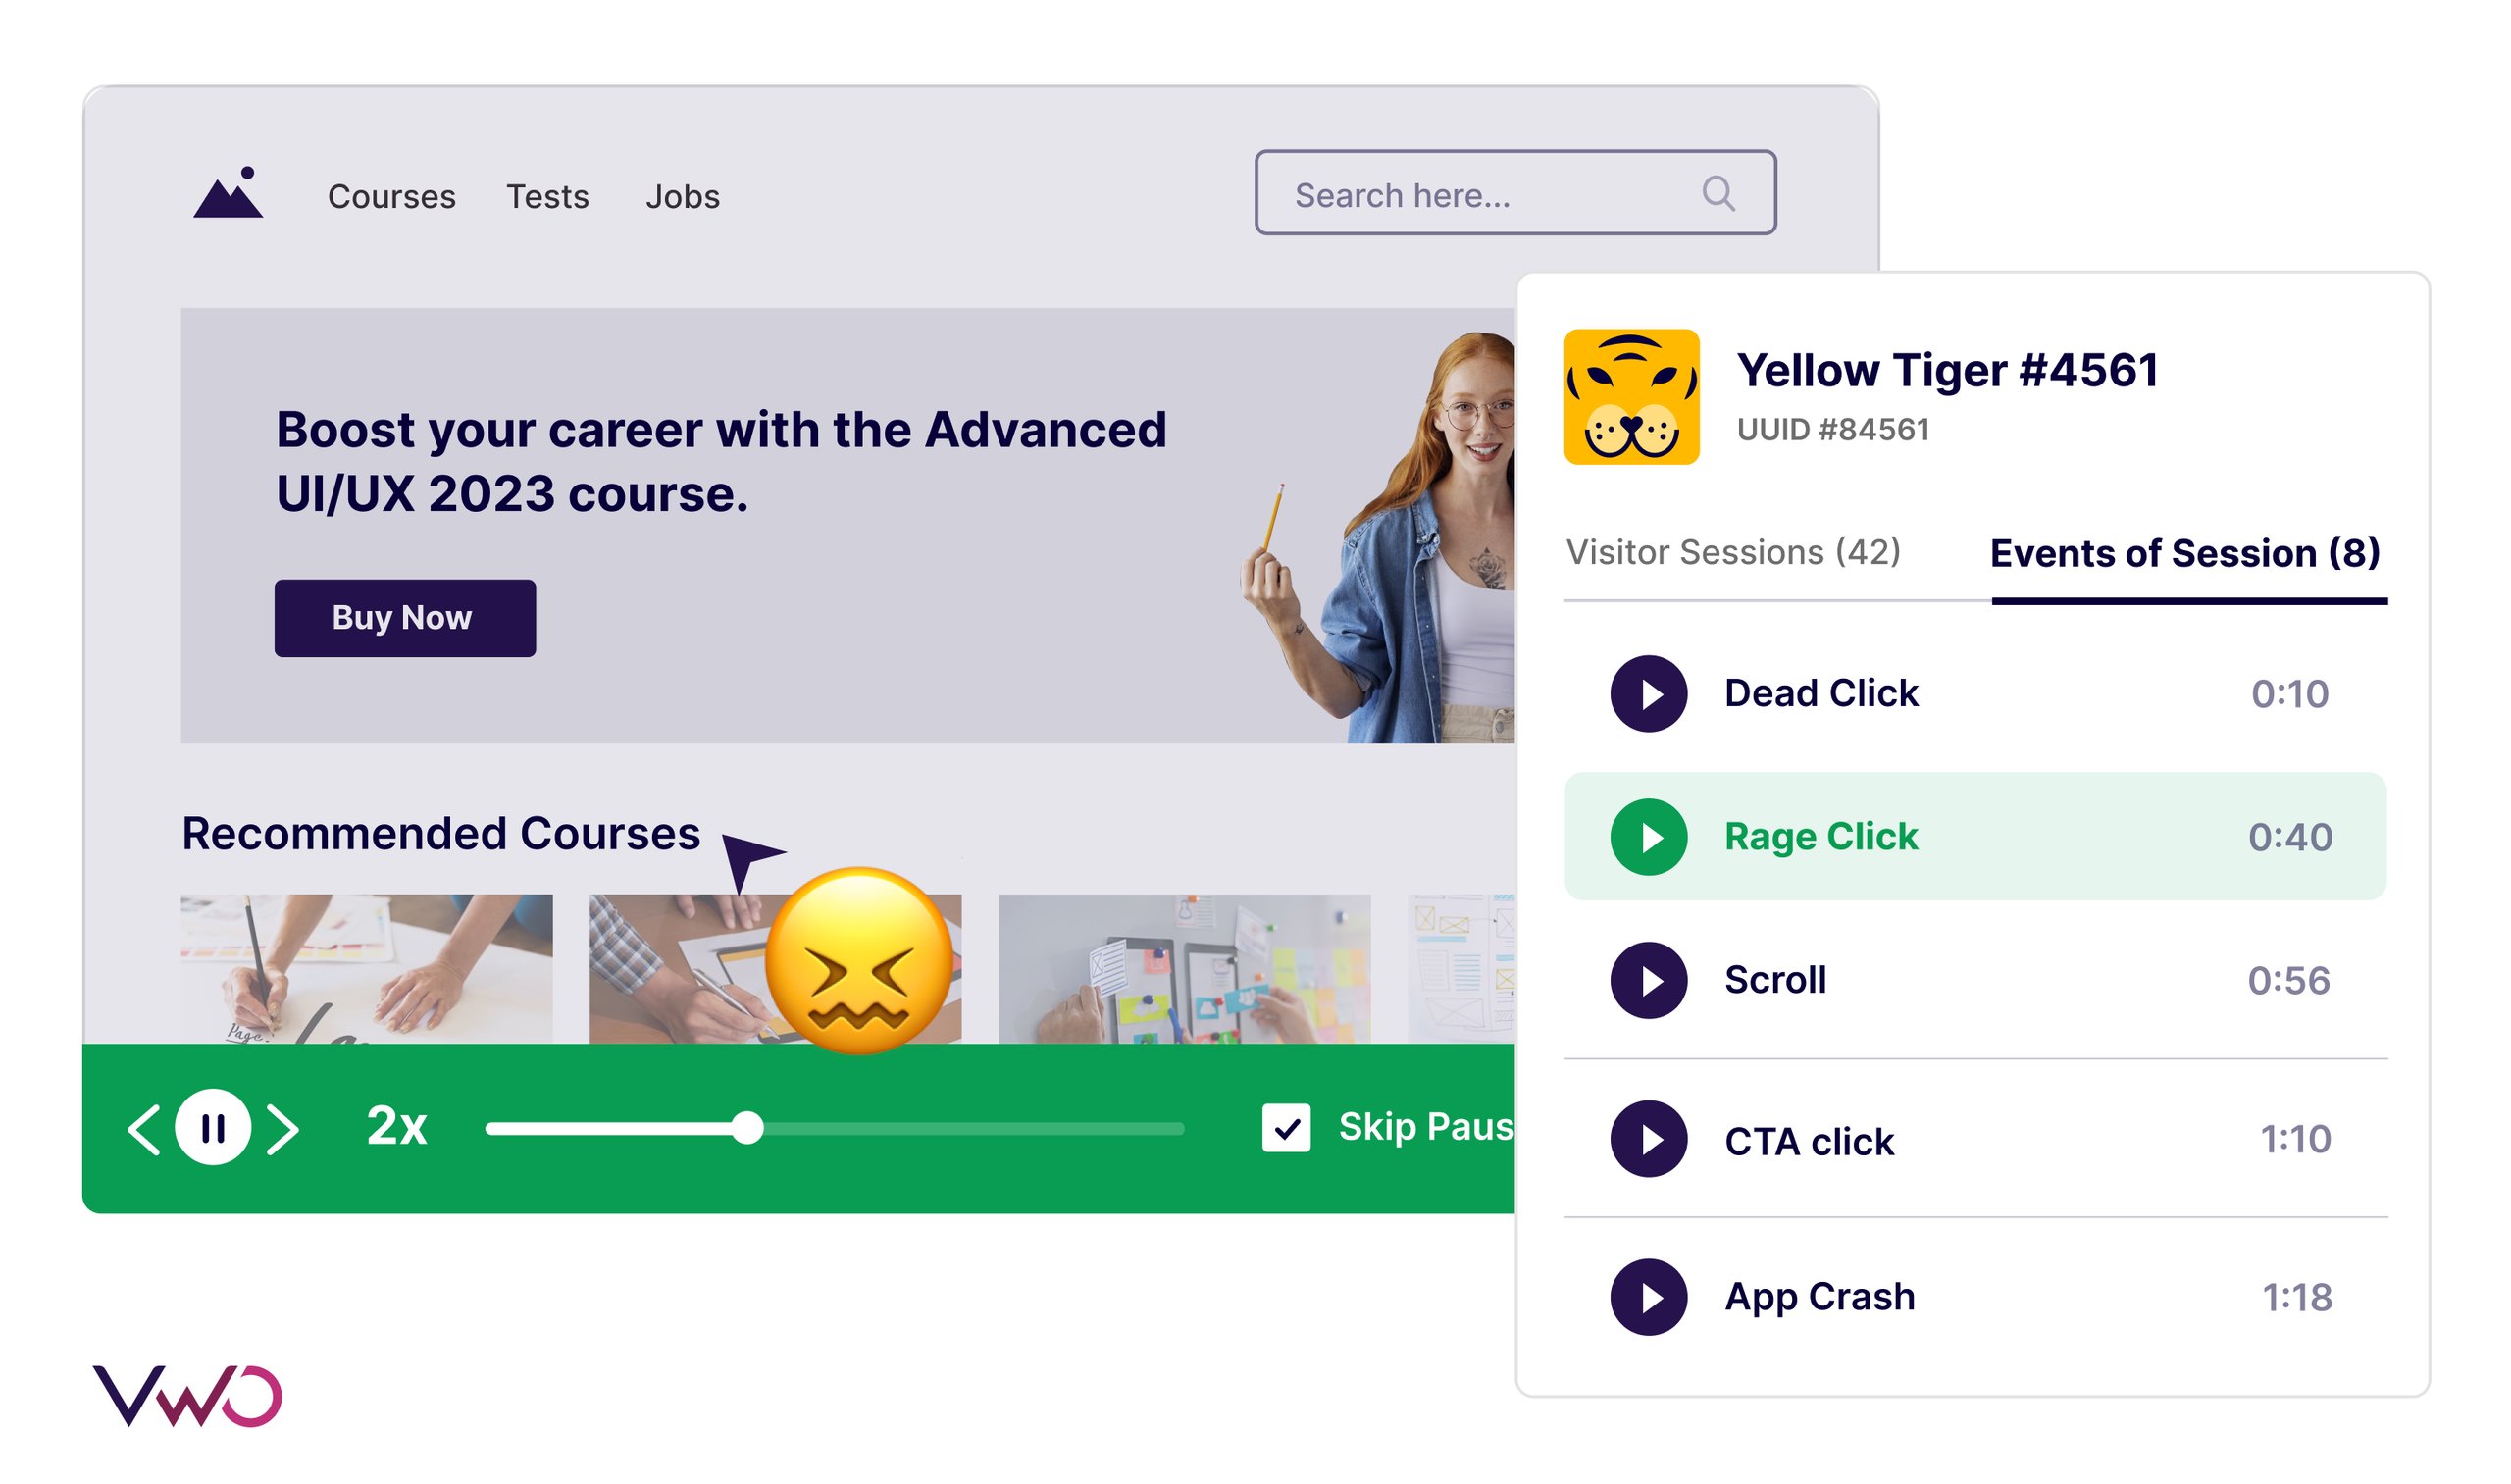
Session recordings not only show what visitors interact with but also where they pause or hesitate. Each movement tells a story about their pain points or ease in engaging with navigation, forms, and other elements. You can also track rage clicks and dead clicks to observe where they encounter difficulties.
Imagine watching recordings and noticing visitors repeatedly clicking on a product link, resulting in what we call a rage click. You immediately connect the dots and realize that due to this friction, the bounce rate on the homepage is high because visitors can’t take the next step. Consequently, they get frustrated and drop off from the homepage.
VWO Insights – Web not only provides all these features for you to maximize visitor insights, but now it also enables quick analysis of recordings and heatmaps directly on the dashboard. Read more about the VWO Insights Dashboard in our blog.
Usability testing
Usability testing is when you observe users interacting with a product, gathering feedback, and using this data to make the product more user-friendly.
For example, let’s say you’re a UX researcher for a finance company. By observing users as they navigate through tasks like searching for investment information or completing transactions, you can uncover usability issues and references from users themselves in real time.
Qualitative data gathered from these tests, including visitor feedback and behavioral observations, guides improvements to the website’s layout, functionality, and content.

Quantitative research vs qualitative research
You don’t have to pick just one between qualitative research and quantitative research. In fact, you shouldn’t. From the above discussion, it’s clear that both methodologies solve different kinds of problems and answer different types of questions. You can’t simply rely on leveraging one over the other to compensate.
What’s the point of getting all the data if you don’t identify visitors’ pain points and aspirations? Similarly, what’s the point of the observations if you don’t know where this friction is affecting and how it’s affecting business KPIs? They have to work side by side to give you a solid research-backed optimization strategy.
Look at what experts have to say about quantitative vs qualitative debate:
You really have to ask open-ended questions and try to get a sense of where the customer’s head is at. However, if you have some known data pieces already in place. So maybe you have some secondary data available. Somebody else has done the research, or it’s a product that’s already in the market and you wanna know a little bit more about it. At that point, quantitative would be relevant.
Laura Amin, Senior Product Marketing Manager, ecobee
Without actively observing human behavior, many insights wouldn’t surface. Currently, a significant issue is the erosion of trust among people, which profoundly impacts their entire journey once trust in the business is lost. Research remains the primary method for revealing these insights and quantifying the scope of opportunities. This involves utilizing both quantitative research and analytics to understand the extent of the issue and determine which audiences are affected.
Chris Gibbins, Chief Experience Officer Creative, CX
How can quantitative research and qualitative research be used in UX research?
Let’s look at some companies that used both quantitative and qualitative research to improve their UX and CRO results.
U-Digital increased mobile conversions by 21.46% with insights from quantitative and qualitative research
At U-Digital, during the analysis of the client’s website conversions, the team examined page values with Google Analytics. They observed that mobile conversion rates were lower compared to desktop. Next, they employed VWO Heatmaps to pinpoint friction areas. This approach enabled them to uncover deeper issues with underperforming page elements.
Upon analysis, they discovered that the add-to-cart button was not sticky, often disappearing from view when visitors scrolled. The team hypothesized that making the button sticky at the bottom of the page on mobile could improve the click-through rate to the shopping cart.
Consequently, they conducted a 23-day A/B test with 7,200 visitors. The winning variation led to a significant 21.46% increase in overall mobile conversions.
RuneScape increased purchases by 10% by combining quantitative and qualitative data
RuneScape, an online role-playing game, discovered through analytics that 50% of their traffic comes directly to their site. This is attributed to RuneScape’s dedicated user base, many of whom have been playing for years.
Recognizing the importance of optimizing their website, they brought a CRO team on board. One key area of focus was the Treasure Hunter page, identified as having significant potential for improvement. After analyzing visitor behavior using heatmaps, the team noticed that many users were attempting to interact with a non-clickable section called ‘Get Keys.’
Further investigation revealed that visitors often returned to the Treasure Hunter page after visiting the Payment page, indicating a lack of information about treasure chest packages.
To address this, the team hypothesized that providing additional details on the Treasure Hunter page would increase conversions on the Payment page. Implementing this variation resulted in nearly a 10% increase in purchases compared to the original page
Your next steps
The sweet spot in user research is found by combining quantitative and qualitative methods.
While quantitative research spots issues on your website, qualitative research dives into why these issues exist, offering valuable insights into visitor behavior. If you’ve been relying solely on quantitative data, it’s like trying to navigate with only one eye open. By embracing qualitative analysis with VWO, you’ll gain a full panoramic view of visitor behavior.
With VWO’s comprehensive features, qualitative research becomes more accessible and insightful. Start your free trial today and improve your understanding of visitor experiences.
Categories:


![10 Best Enterprise Analytics Platforms [2026]: Expert Picks with Reviews and Comparisons](https://static.wingify.com/gcp/uploads/sites/3/2025/08/Feature-image-10-Best-Enterprise-Analytics-Platforms_-In-Depth-Reviews-and-Comparisons.jpg?tr=h-600)