When users sign up, it may seem like the hard part is over. But this is exactly where the real work begins.
You don’t have unlimited time to prove your value, and those first few interactions matter. Every friction point or unnecessary step gives users a reason to drop off and never come back.
An onboarding funnel is the tactical path that moves users from initial curiosity to full activation. It is the single greatest lever you have for determining whether a user stays or disappears.
By the end of this guide, you’ll learn how to map your funnel, pinpoint drop-offs with surgical precision, and run the experiments necessary to turn your onboarding into a reliable growth engine.
What is an onboarding funnel?
An onboarding funnel is a structured framework that maps the steps new users take from sign-up to activation/product adoption. It measures how effectively users move through setup, core feature adoption, and early value realization.
By breaking the user onboarding process into measurable funnel stages, such as account setup, first key action, and early feature use, you can monitor where progress stalls or momentum builds.
The primary goal of a well-structured onboarding funnel is simple: help users reach value quickly to reduce churn and increase the likelihood of long-term customer retention.
Benefits of a well-designed onboarding funnel
A well-structured onboarding funnel is the bridge between a user’s initial curiosity and their long-term commitment. Optimizing it provides several measurable benefits:
Shortens time-to-value (TTV): A streamlined onboarding journey helps users reach their first “Aha!” moment (such as their first sign-up or data import) before they lose interest, accelerating value realization and improving activation rates.
Identifies friction points: Detailed funnel data shows exactly where users drop off, allowing product managers to identify and fix pain points in the onboarding flow.
Reduces early churn: Most SaaS product churn happens in the first few days. A smooth onboarding experience prevents frustration, builds confidence, and prevents early abandonment.
Drives deeper engagement: Users who understand the value proposition and key features quickly are more likely to explore new features and integrate the tool into their daily workflow.
Enables continuous optimization: The funnel operates as a living system, providing data to help you optimize the entire process and improve conversions and retention over time.
Steps of the user onboarding funnel
The onboarding funnel begins after users sign up. Its purpose is not acquisition, but activation and early user retention. While every business is unique, a well-structured onboarding funnel typically follows a set of common steps.
Let’s look at these steps through the lens of Canva‘s real-world onboarding journey:
All screenshots featured here are sourced from Canva.
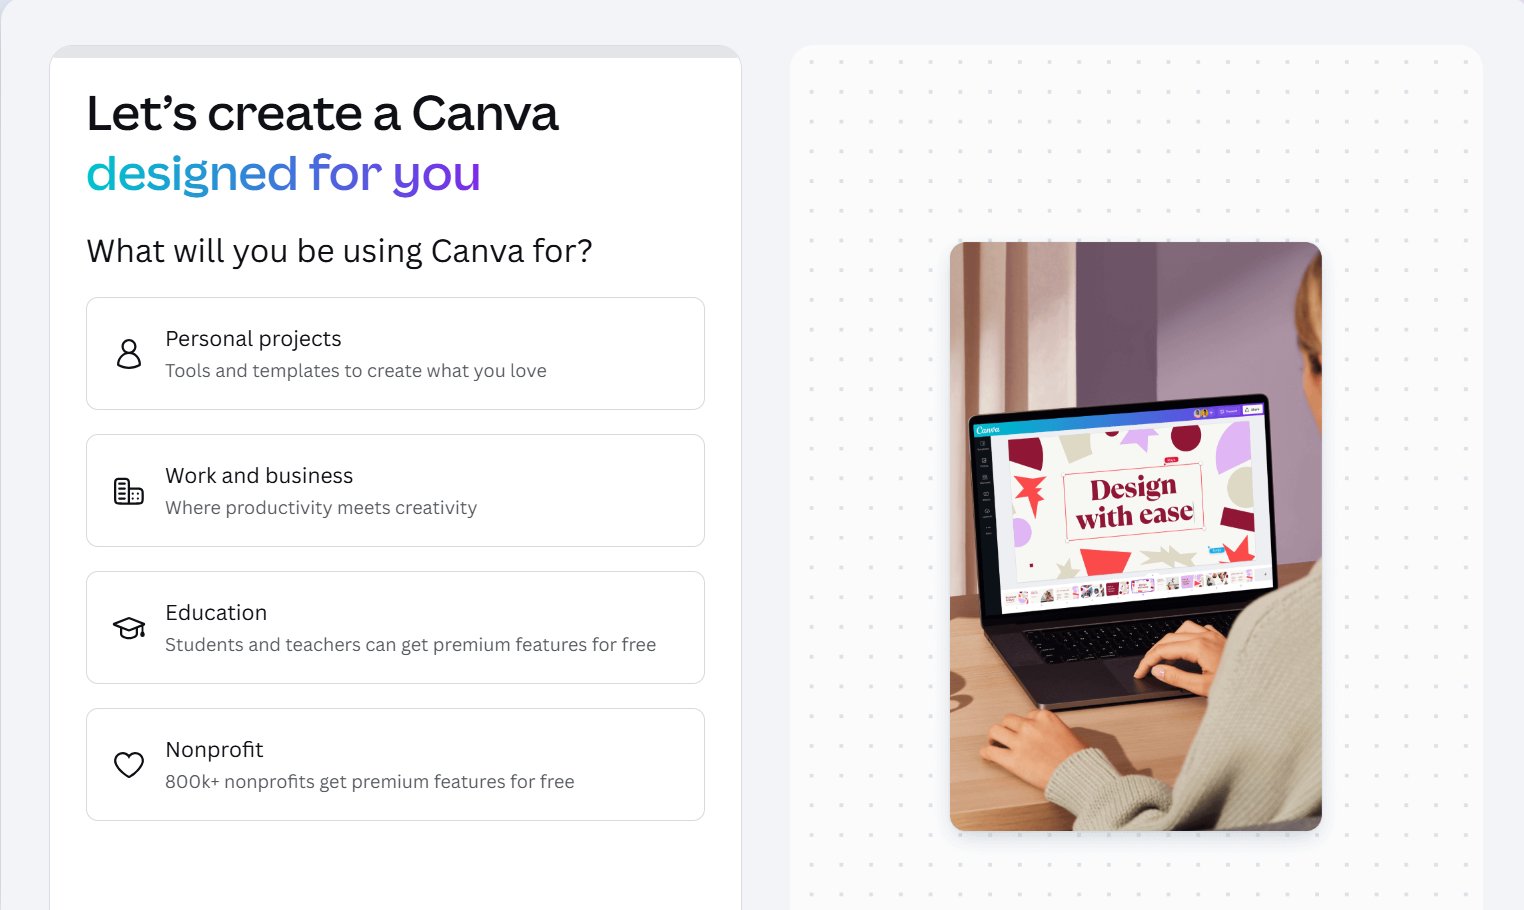
Step 1: Account setup
New users configure their profile or workspace. For example, for a project management tool, this might include creating a workspace, naming a project, or setting preferences. If users abandon at this point, there is friction in your initial setup.
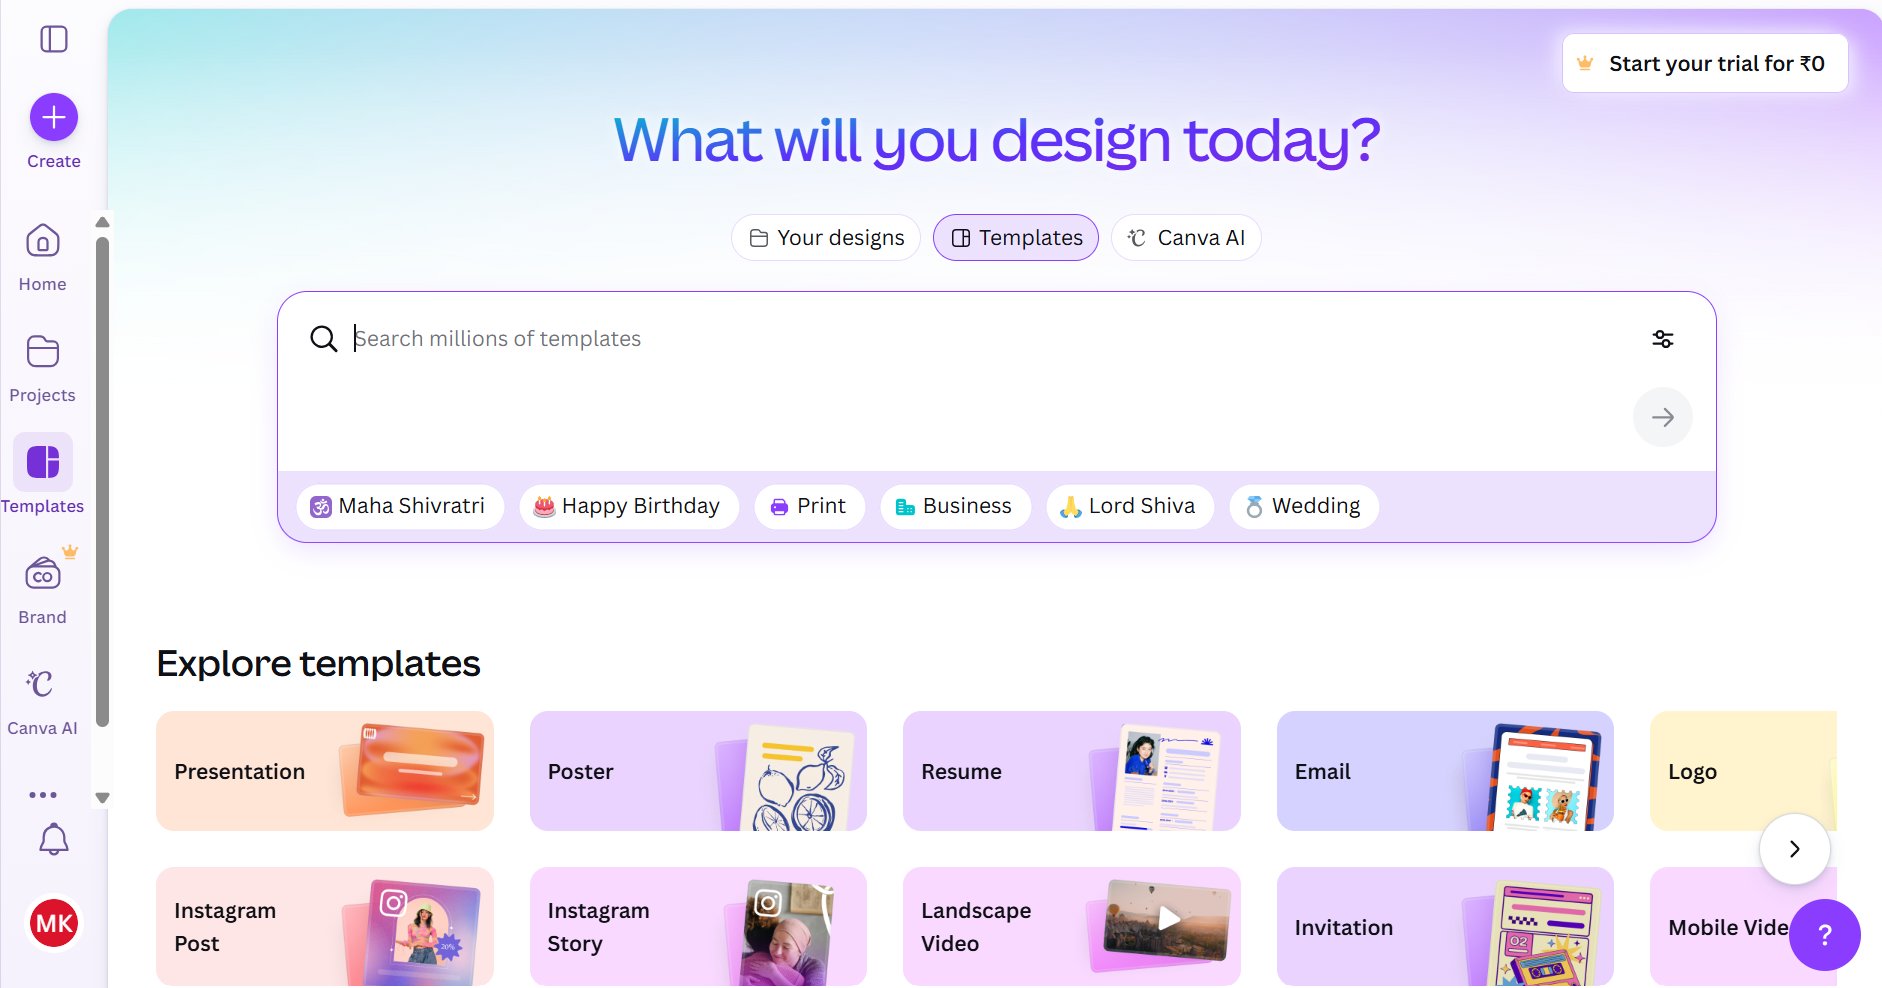
Canva asks, “What will you be using Canva for?” (e.g., Personal, Work, Education). This allows them to create a personalized experience and gather basic information to categorize new users.
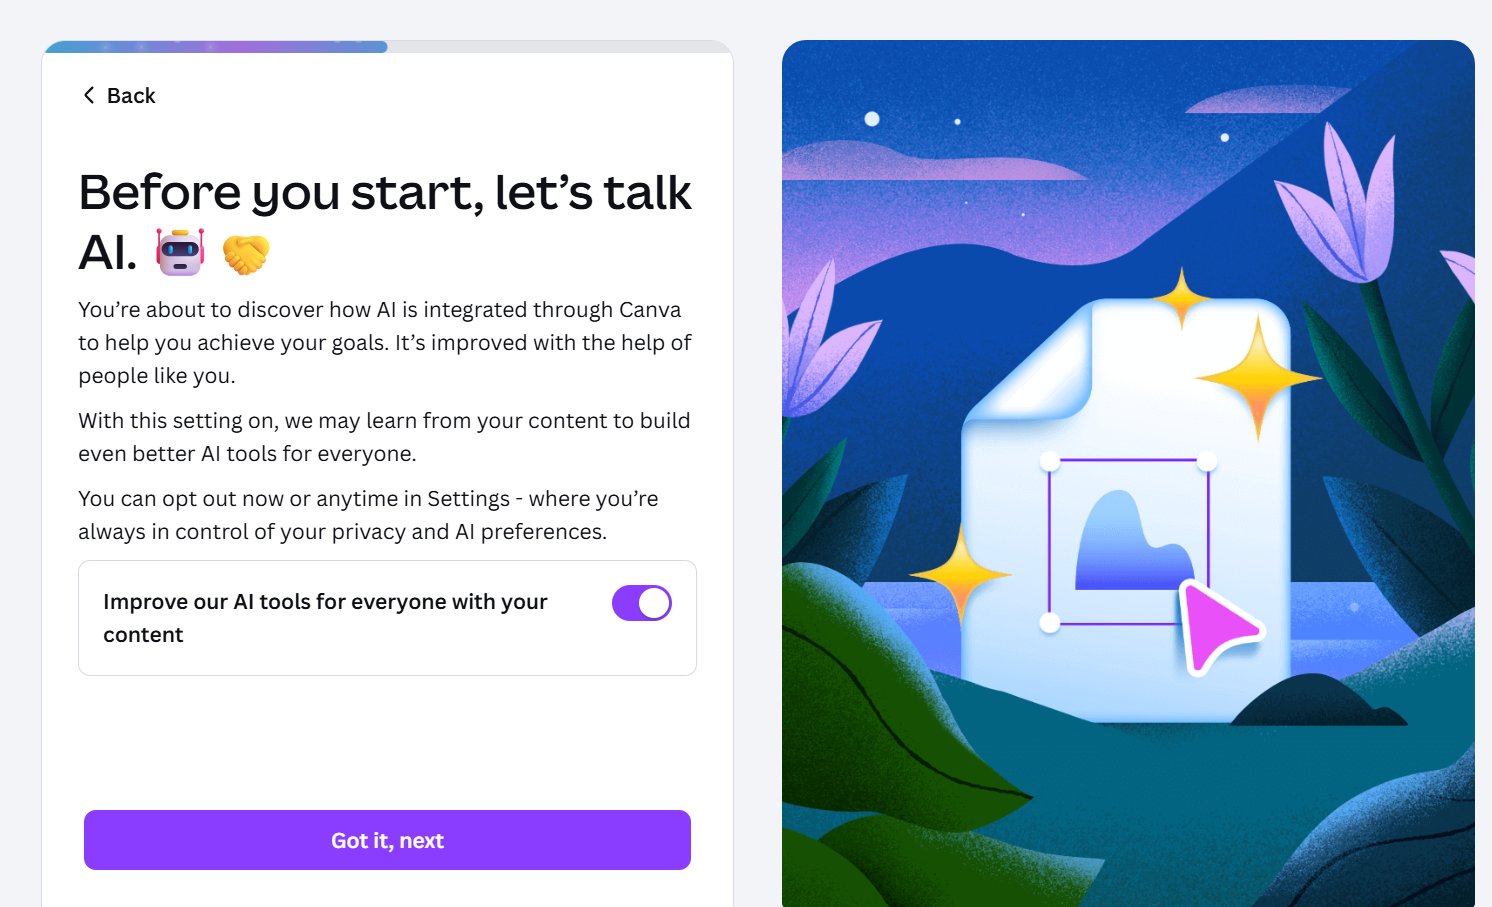
Step 2: Product education (The guided tour)
Through onboarding content, video tutorials, or interactive tooltips, users learn to navigate key features. This stage closes the gap between “logging in” and “taking action.”
Canva introduces key features, such as its AI integration. This form of onboarding content sets expectations and prepares the user for the platform’s capabilities.
Step 3: Activation event (The “Turn-On” moment)
Activation is the pivotal point where a user moves from “looking around” to “getting it.” This is the first meaningful action that both demonstrates and confirms your product’s value. It is the moment the user realizes your value proposition is real, having just experienced it firsthand.
Activation occurs when a user completes a meaningful task that confirms the product’s utility, such as:
Importing their first dataset
Inviting a teammate
Creating a live dashboard
For Canva users, the “Turn-On” Moment occurs when they realize they can choose from millions of professional templates and create high-quality designs in seconds. Activation often means downloading or sharing their first design.
Canva Activation Event
Activation, or the moment of value perception, is crucial as it’s a great point to improve conversion and enhance the performance of all other phases. To maximize its impact, teams must align around this milestone, ensuring effectiveness and cohesion, especially as startups scale and function risk operating in silos.
David Isaac Mathews, Chief Growth Officer. (Source: Webinar)
Step 5: Core feature adoption & engagement
Users move beyond the basics to interact with advanced features. This stage is where users engaged with the product separate themselves from those likely to churn. This stage separates trial users from those likely to stay.
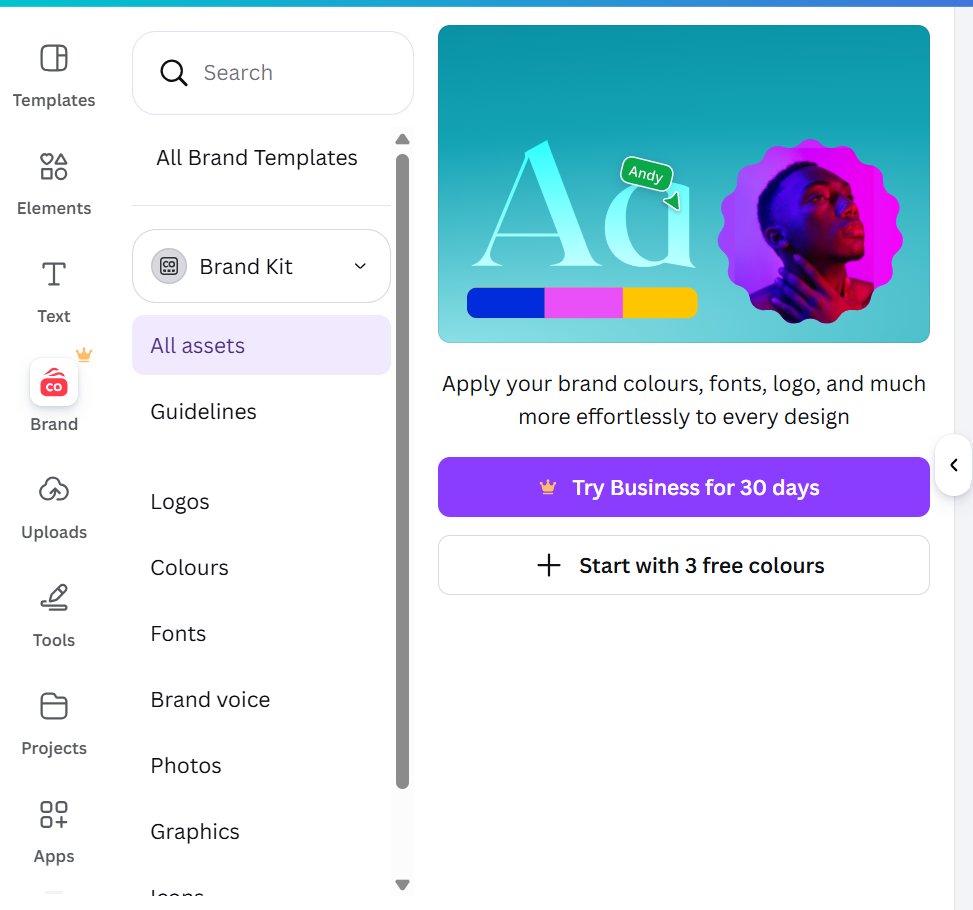
Canva encourages the use of advanced features, such as the “Brand Kit,” to save custom colors and logos.
Step 6: Habit formation & retention
Users return and interact again within a defined timeframe (e.g., Day 7 or Day 30). At this point, the onboarding journey has successfully transitioned into long-term customer retention.
When Canva prompts users to “Try Business for 30 days” or to save brand assets, it converts them into long-term paying customers.
Note: If users stall before activation, your onboarding flow lacks clarity. If they stall after activation, the product value needs reinforcement through improved onboarding.
How to map your user onboarding funnel
Mapping your onboarding funnel involves defining the behavioral path that leads to activation and measuring how effectively users move through it.
1. Start with the activation goal
Identify the action that signals meaningful product value; the behavior that separates retained users from those who churn.
In Canva’s case, activation often occurs when a user downloads or shares their first design. In a project management tool, it may involve creating and assigning a task.
This activation milestone anchors the entire onboarding funnel. Without it, you’re tracking activity, not progress.
2.Segment personas and intent
Not all users arrive with the same goal. Some seek speed. Others seek depth. Some explore casually; others arrive with urgency. Each persona may require a slightly different onboarding path. Segment users based on:
Use case
Industry
Company size
Early behavioral signals
VWO’s advanced segmentation enables deeper behavioral analysis within your funnel reports. You can create highly specific segments using parameters like device type, URL query parameters, and custom business events. With flexible filtering logic, you can narrow down performance data to precise user groups and uncover how different segments behave during onboarding.
For example, a marketing manager and a freelance designer may sign up for the same product, but expect entirely different outcomes. Mapping a single “average” onboarding flow ignores that reality.
Pro Tip!
Define role-based custom attributes (like user_role) in VWO to segment users and tailor onboarding flows to their intent. Each persona reaches value faster instead of navigating a one-size-fits-all journey, leading to better conversion and retention.
3. Identify entry points
Track where users originate (organic, paid, or referral). Acquisition source often shapes user behavior during onboarding.
Users from paid campaigns may expect faster results. Organic users may explore more deeply. Mapping entry points helps you interpret drop-offs more accurately.
4. Reverse-engineer the path to value
Once activation is defined, work backward. Identify:
The actions users must complete beforehand
The decision points that introduce friction
The onboarding elements that guide movement
This outlines the sequence of micro-actions that move users closer to value:
Setup → First Interaction → Feature Discovery → Activation
Each stage should represent a measurable behavioral shift, not just a completed screen.
5.Make the funnel measurable
Translate each stage into trackable metrics. Focus on:
Activation rate: percent of new users who reach the target outcome.
Stage conversion rates: the percentage of users who move from one stage to the next.
Time to activation: median time from signup to activation.
Retention cohorts: retention over subsequent time periods ( week/month) for specific user groups who activated vs those who didn’t.
Feature engagement: frequency and depth of core feature use after activation, often by monitoring taps, clicks, or tracked events.
Measurement transforms your onboarding funnel from a conceptual journey into a performance system.
Use behavioral insights, such as heatmaps or session recordings, to uncover pain points. Then, validate improvements through experimentation before scaling changes.
6.Visualize the flow
Create a clear representation of the funnel (linear or branched) showing stages, conversion rates between stages, and alternative paths (skips, detours). Use a template or flowchart tool to keep it shareable.
Visualization aligns teams. It makes drop-offs visible and prioritization easier.
7. Hypothesize and experiment
For each major drop‑off, write a hypothesis, design an experiment (A/B test, copy change, and feature test), and measure impact on the funnel.
How to analyze your onboarding funnel
Once your onboarding funnel is mapped, analysis becomes the bridge between observation and action. This is where data transforms assumptions into decisions. VWO Funnels let you create custom funnels and track user progress through clearly defined stages.
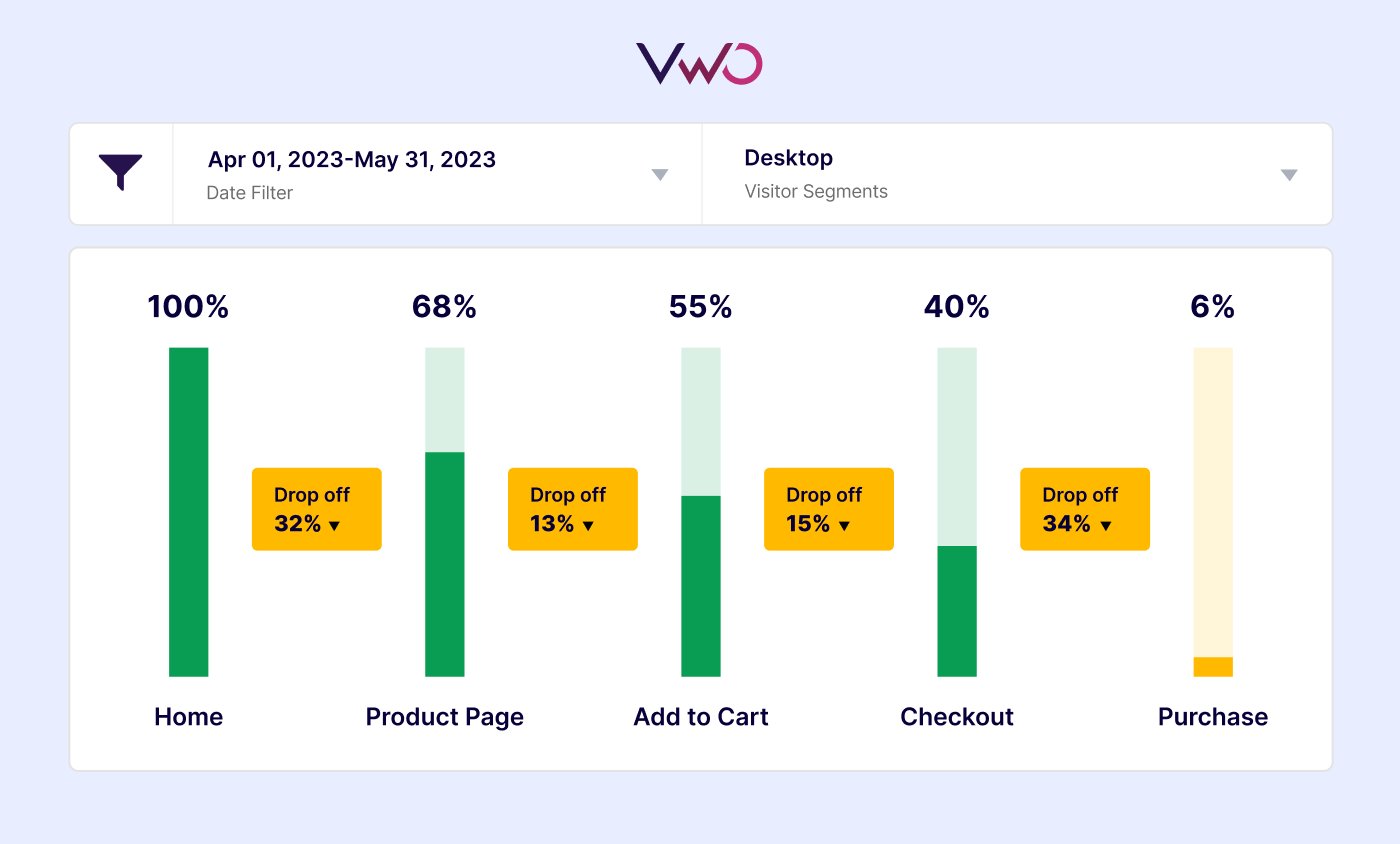
Identify drop-offs withVWO Funnels
With VWO Funnels, you can define each onboarding stage as a measurable event/goal. Once configured, the Funnels Dashboard offers a visual representation of the user journey.
The dashboard provides immediate visibility into:
Funnel management: Create new funnels, modify existing goals within the sequence, or clone a funnel to test a similar onboarding variation.
Tracking controls: Start or pause visitor tracking. This is essential when making updates to your product, so that your data remains untainted during maintenance.
Workspace organization: Pin high-priority onboarding funnels to the top of your list and use labels to categorize funnels by user segment or product line.
Data integrity: Clear existing logs and start collecting fresh data immediately using the Flush Data option if a significant change is made to an onboarding step.
Analyze performance with funnel reports
The Detailed Report tab provides the specific metrics required to evaluate onboarding health. Understanding these metrics is the key to identifying friction points.
Conversion and drop-off rates: The report shows the number of visitors who reached each goal and the percentage who exited the funnel at that stage.
Total vs. goal conversions: Analyze conversions based on the total number of visitors who entered the funnel versus those who completed the immediately preceding step. This helps distinguish between a broad-interest problem and specific step-level friction.
Segmented analysis: Filter funnel reports using User Segments and Report Segments, including time-based filters (day/hour) and revenue-based filters, enabling more precise analysis of funnel performance.
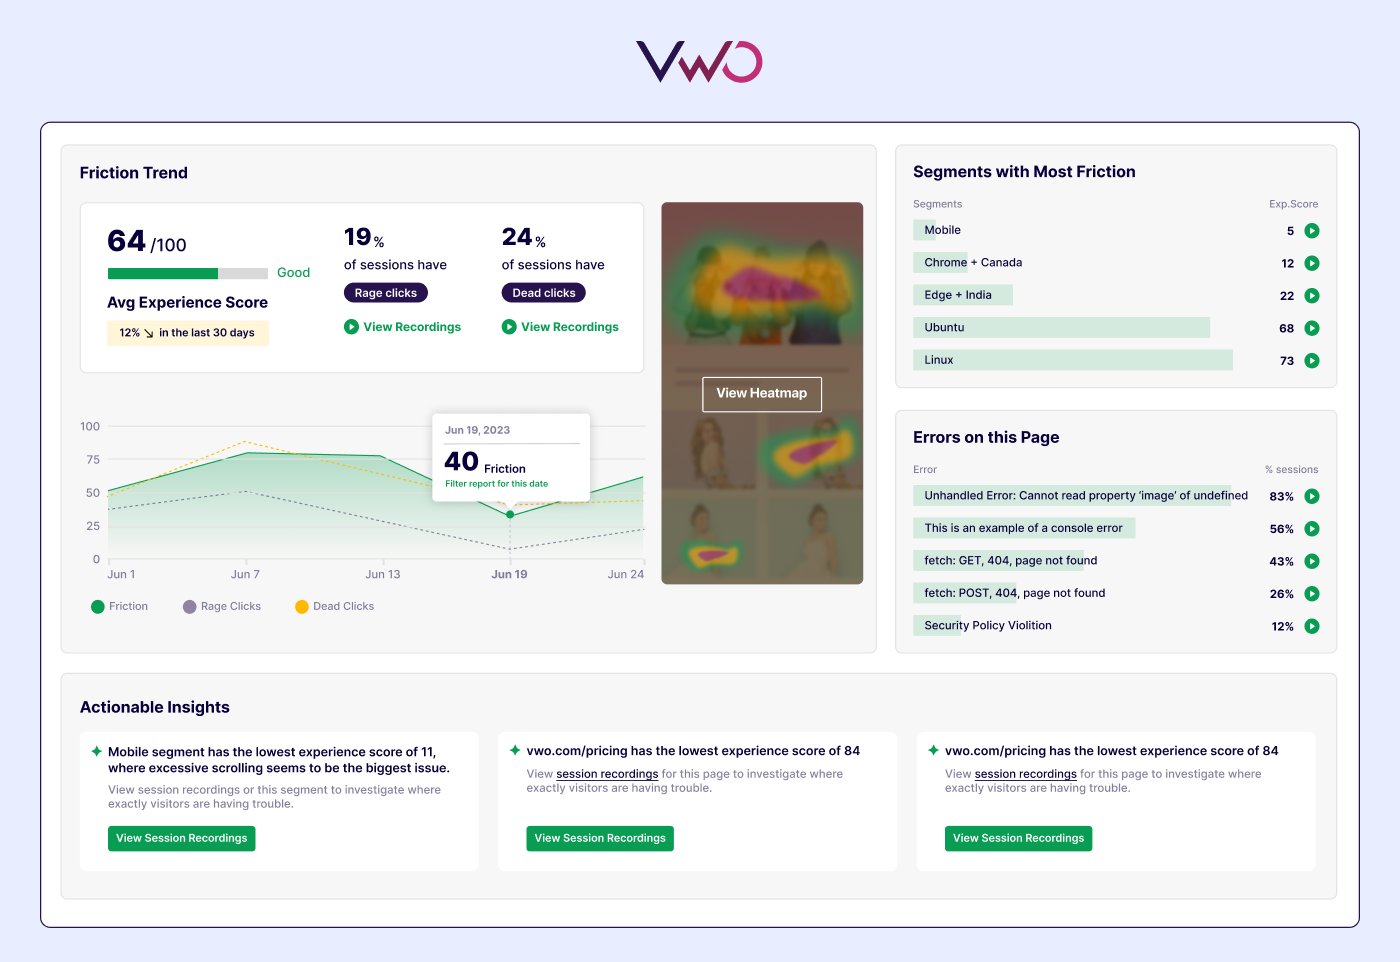
Understand the “Why” with VWO Insights
Quantitative data tells you where the leak is; behavioral insights explain why it’s leaking. Once you identify a friction zone in VWO Funnels, use VWO Insights‘:
Session Recordings: Observe real user interactions to reveal hesitation or confusion during navigation.
Heatmaps: See how users engage with onboarding screens. Are your most important calls to action being ignored?
Form Analytics: Pinpoint specific fields in your signup or setup forms that cause users to abandon.
Together, these tools help you distinguish if a drop-off is a clarity issue (confusion), a friction issue (too many steps), or a motivation issue (lack of perceived value).
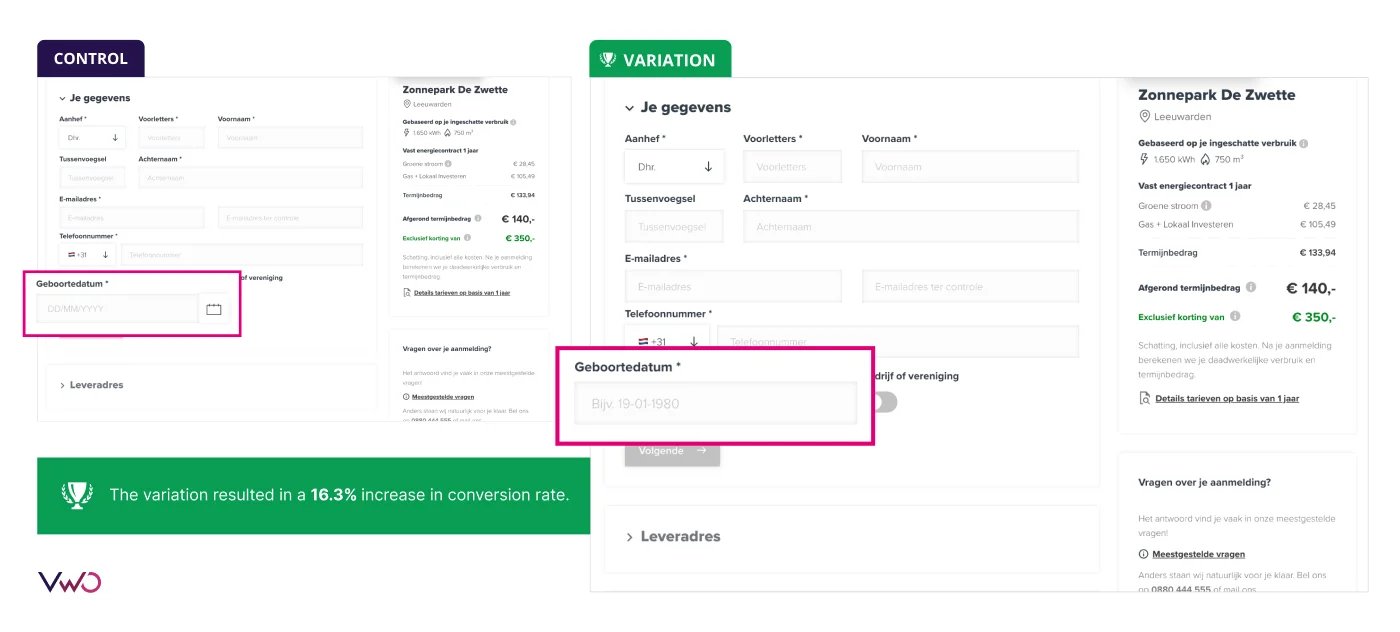
For instance, Vandebron used VWO Insights to find that a single “date of birth” field was causing major drop-offs on their sign-up form. Clickmaps, Form Analytics, and Session Recordings revealed usability issues with the calendar input. After simplifying the field and validating the change through A/B testing, they achieved a 16.3% uplift in sign-ups and reduced field-level drop-offs by 80%, demonstrating how a single friction point can affect the entire funnel.
Collect user feedback through VWO Pulse
In addition to behavioral analytics and experimentation, VWO Pulse enables teams to launch targeted micro-surveys at critical stages of onboarding. By collecting contextual user feedback, you can uncover hidden friction or unmet expectations, and then design data-backed experiments to validate improvements.
Validate changes with experimentation
Once friction points are identified, optimization must be evidence-based.
VWO Testing: Run A/B or multivariate tests to optimize onboarding UX (UI layouts, messaging, CTAs, etc.)
VWO Feature Management: For deeper product changes, such as a new onboarding checklist or personalized walkthroughs, you can run server-side tests to validate different onboarding logic or flows and measure their impact on activation and retention. Feature flags can also be used to roll out the winning experience gradually to specific segments, minimizing risk while accelerating your iteration loop.
A real example:
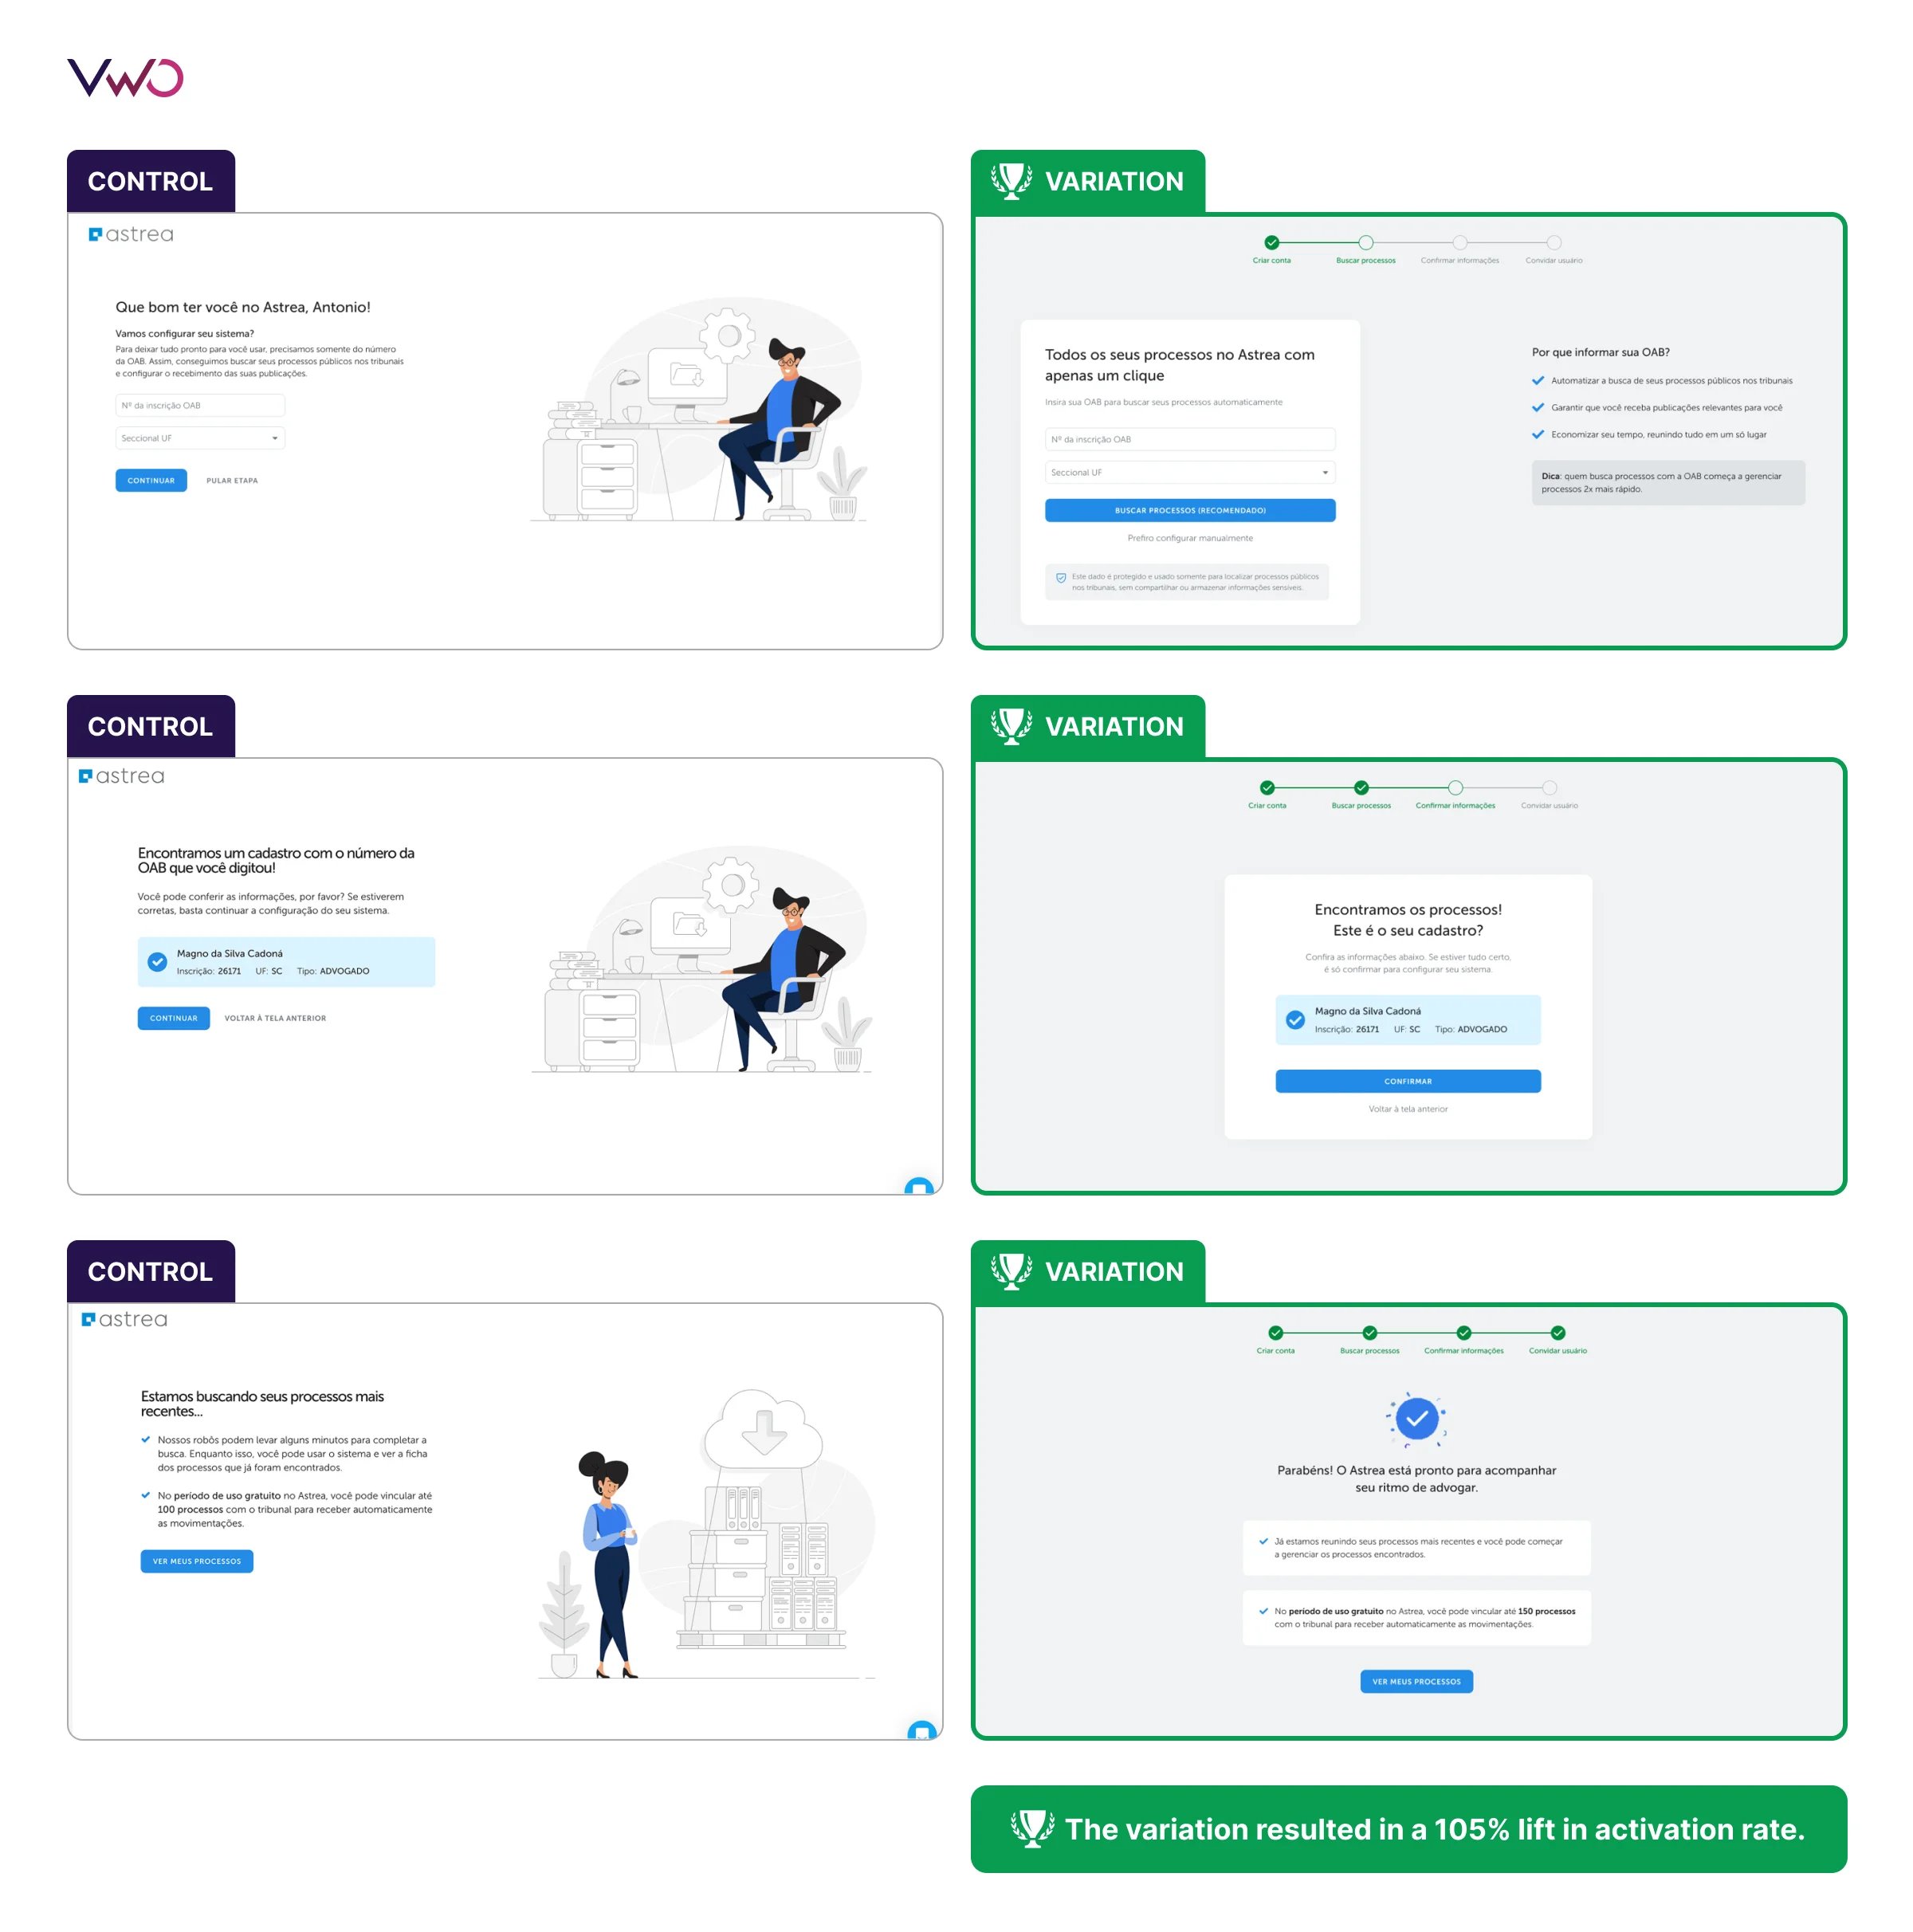
AURUM, a legal-tech platform through its product Astrea, helps lawyers streamline research using structured legal clippings. For new users, onboarding is defined by one key moment: processing the first clipping, which unlocks core value.
However, this step could take up to 48 hours, turning onboarding into a waiting period where early momentum faded.
By systematically experimenting and removing friction in how users reached value, AURUM transformed onboarding into a faster, more guided experience. This led to a 105% lift in activation, 300% overall activation growth, and a 125% increase in core engagement.
Tools for onboarding funnel analysis
Choosing the right stack is critical for turning your onboarding funnel into actionable insights. Modern SaaS teams rely on a mix of analytics, in-product guidance, and experimentation frameworks to measure, diagnose, and improve performance.
Product analytics platforms
Strengths: Robust funnel data and cohort analysis; event tracking with specific properties; segmentation by acquisition source or persona.
Best use: Establishing baseline conversion rates, identifying the exact stage where users drop, and running long-term user retention comparisons.
Examples: Mixpanel, Amplitude, VWO Funnels (as part of VWO Insights)
Strengths: Heatmaps, session recordings, form analytics, scroll tracking, and click tracking that reveal how users interact with onboarding screens.
Best use: Diagnosing why users drop off at a specific stage. While funnel analytics show where friction occurs, behavioral analytics explain what users were doing right before they left.
Examples: VWO Insights, FullStory
In-product guidance & onboarding tools
Strengths: No-code onboarding flows (checklists, tooltips, and tours); contextual triggers based on real-time user behavior.
Best use: Deploying guided experiences to reduce friction at identified drop-off points and shortening the time-to-activation.
Examples: Userpilot, Appcues
Experimentation & feature management
Strengths: A/B testing with statistical rigor; feature flagging for controlled rollouts of new onboarding stages.
Best use: Validating hypotheses about funnel improvements and ensuring that onboarding journey changes actually drive growth.
Examples: VWO, Statsig
Customer success & feedback tools
Strengths: Customer health scoring; qualitative feedback collection; video onboarding content.
Best use: Combining quantitative data with qualitative insights to understand the emotional or logical reasons why new users stall.
Examples: VWO Pulse,Vitally, Typeform
Explore the leading customer feedback management tools and find the right fit for your business.
Best practices for optimizing your onboarding funnel
Apply the following best practices to remove obstacles and accelerate the time it takes for a new user to become a successful customer:
Simplify sign‑up: Reduce required fields, offer SSO/social logins, and delay non‑essential steps. This reduces friction, leading more users to complete registration.
Guide to first-value fast: Highlight the key feature and use templates or starter content to shorten setup time and increase activation & retention.
Use contextual help: Add tooltips, checklists, or guided tours to provide support at the exact point of confusion, lowering drop-offs.
Segment onboarding paths: Tailor flows by persona, role, or acquisition source to match user needs and, in turn, improve relevance and conversions.
Measure time to activation: Track how quickly users reach the first value to highlight bottlenecks and optimize for faster value delivery.
Run continuous experiments: A/B test to validate onboarding changes and ensure data-driven improvements.
Balance quantitative & qualitative insights: Pair funnel analytics with surveys, session replays for the “where,” and support feedback for the “why.”
Iterate regularly: Treat onboarding as an ongoing process, not a one‑time project, to keep it effective.
Align teams: Ensure product, growth, and customer success collaborate on funnel improvements for smoother user journeys.
Establish ownership: Assign clear responsibility for monitoring metrics and running experiments to sustain funnel optimization as a priority.
Optimizing your onboarding funnel transforms early curiosity into measurable growth. When every improvement is guided by data and validated through experimentation, activation becomes predictable rather than accidental.
Ready to build a more reliable onboarding engine? Request a demo to see how VWO can help you drive activation and retention.
FAQs
Is an onboarding funnel necessary for user onboarding?
While users can technically “onboard” without a documented funnel, having one is essential for the business to measure success and systematically improve activation. Without a funnel, you cannot effectively identify friction points, calculate conversion rates, or understand why users are not adopting your product.
What’s the easiest way to create an onboarding funnel for your users?
Start by defining your activation milestone, the action that signals meaningful product value. Then map the key steps leading to it (e.g., sign-up → setup → first key action) and track them using an analytics or funnel tool to measure stage-to-stage conversions.
What is the primary goal of the onboarding funnel?
The primary goal of an onboarding funnel is to guide new users to activation, helping them experience product value quickly and increasing the likelihood of long-term retention.
Which metric is commonly used to evaluate the effectiveness of the onboarding funnel?
The most common metric for evaluating an onboarding funnel is the funnel conversion rate, typically measured as the percentage of new users who reach the activation milestone. Teams also track stage-to-stage conversion rates and time-to-activation for deeper insight.
What is an onboarding funnel?
An onboarding funnel is a structured framework that tracks how new users move from sign-up to activation. It breaks the onboarding journey into measurable stages to identify where users progress and where they drop off.
Hi, I’m Pratyusha Guha, manager - content marketing at VWO. For the past 6 years, I’ve written B2B content for various brands, but my journey into the world of experimentation began with writing about eCommerce optimization. Since then, I’ve dived deep into A/B testing and conversion rate optimization, translating complex concepts into content that’s clear, actionable, and human. At VWO, I now write extensively about building a culture of experimentation, using data to drive UX decisions, and optimizing digital experiences across industries like SaaS, travel, and e-learning.
Uncover hidden visitor insights to improve their website journey
One of our representatives will get in touch with you shortly.
Awesome! Your meeting is confirmed for at
Thank you, for sharing your details.
, you're all set to experience the VWO demo.
I can't wait to meet you on at
Account Executive
, thank you for sharing the details. Your dedicated VWO representative, will be in touch shortly to set up a time for this demo.
We're satisfied and glad we picked VWO. We're getting the ROI from our experiments.
Christoffer Kjellberg
CRO Manager
VWO has been so helpful in our optimization efforts. Testing opportunities are endless and it has allowed us to easily identify, set up, and run multiple tests at a time.
Elizabeth Levitan
Digital Optimization Specialist
As the project manager for our experimentation process, I love how the functionality of VWO allows us to get up and going quickly but also gives us the flexibility to be more complex with our testing.
Tara Rowe
Marketing Technology Manager
You don't need a website development background to make VWO work for you. The VWO support team is amazing
Elizabeth Romanski
Consumer Marketing & Analytics Manager


![10 Best Enterprise Analytics Platforms [2026]: Expert Picks with Reviews and Comparisons](https://static.wingify.com/gcp/uploads/sites/3/2025/08/Feature-image-10-Best-Enterprise-Analytics-Platforms_-In-Depth-Reviews-and-Comparisons.jpg?tr=h-600)