What’s the best way to truly understand how users interact with your product?
You could analyze basic metrics, assume which features are working, or rely on just a handful of user feedback.
But are guesses and assumptions enough?
The only way to be sure is to analyze user behavior, understand their journeys, and uncover what drives engagement or causes friction.
That’s precisely what product analytics tools are designed to do.
These tools go beyond surface-level metrics, offering actionable insights to help teams improve user experiences, boost retention, and maximize conversions.
To make your search easier, we’ve compiled a list of the 7 best product analytics tools of 2026, complete with features, pricing, and what sets them apart. Let’s explore!
The 8 best product analytics tools to know – Quick view
– Free trial: Yes, available. – Paid: Prices are not available on the website.
Top product analytics tools – Features in detail
1. Userpilot
Userpilot is an all-in-one platform integrating product analytics with user onboarding, in-app surveys, and feedback collection. It empowers businesses to track trends, identify feature popularity, and analyze user behavior over time.
Trend and funnel analysis help uncover where users drop off, pinpoint friction points, and optimize feature adoption, driving better engagement and revenue growth—all while reducing tech stack complexity and costs.
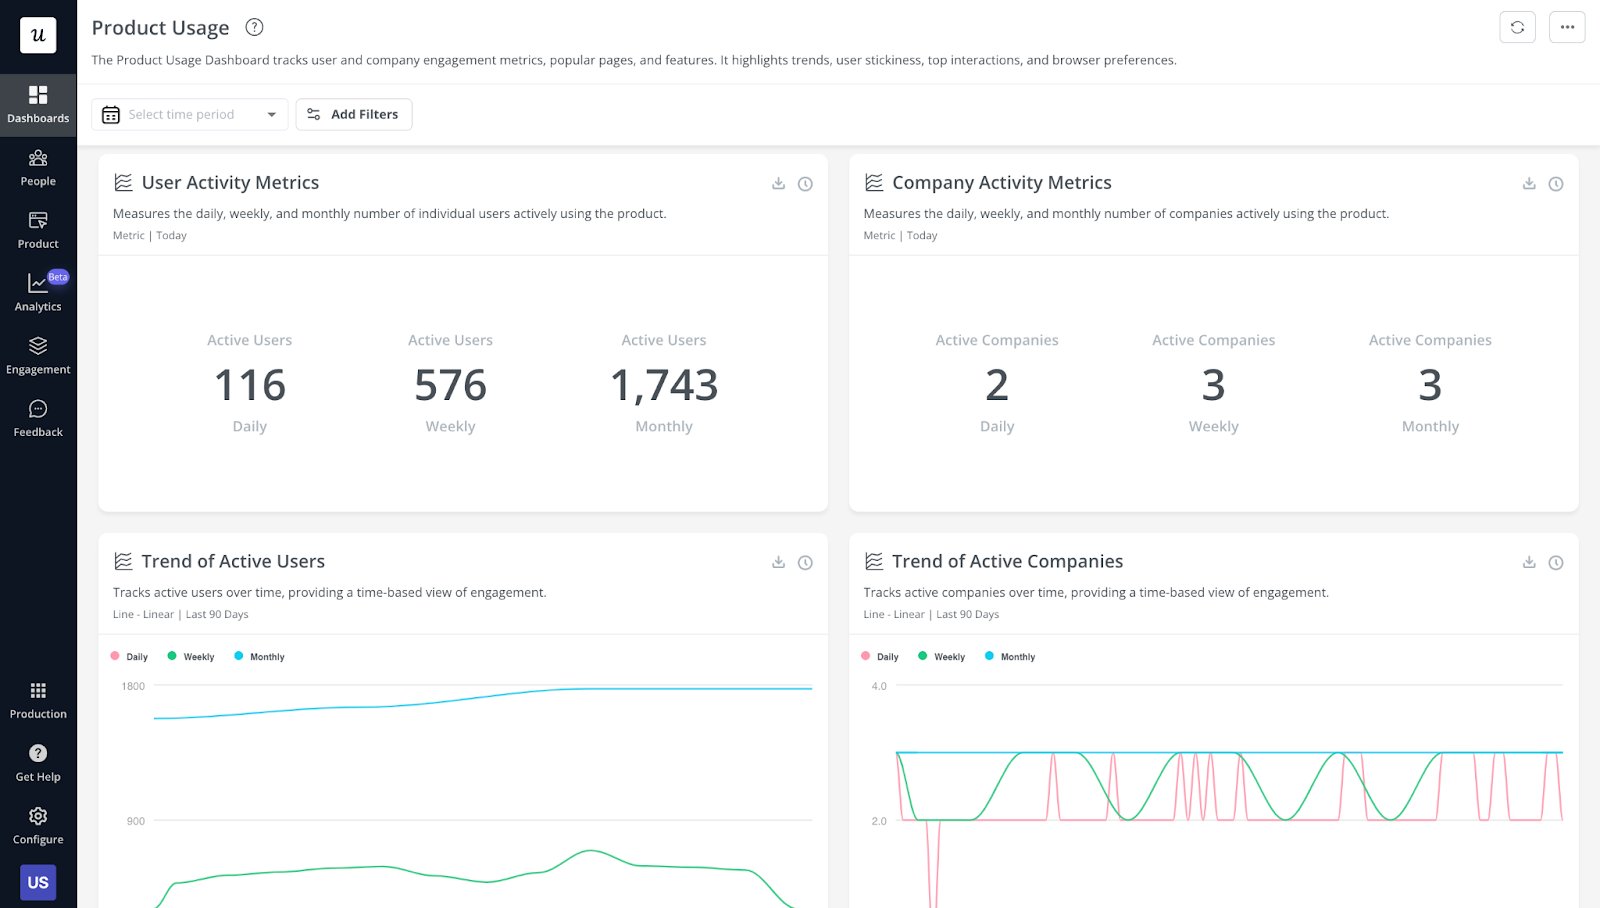
Dashboard overview:
Userpilot’s product usage analytics dashboard offers actionable insights into customer interactions, tracking critical metrics across segments and periods. It highlights user behavior trends, retention rates, and potential churn risks, enabling personalized experiences to enhance engagement and reduce churn.
Product Usage Dashboard
Features:
Event Autocapture
Path Analysis
Trend Analysis
Cohort Analysis
Funnel Analysis
Custom Dashboards
Session Replay
In-app Surveys
Pricing:
Plan Type
Details
Free Trial
14-day free trial
Paid Plan
Starts from $249/month (billed annually)
A customer experience as per G2 reviews:
The product is fairly easy to use for almost all things we want to do with it. Support is phenomenal for all the things that are not easy or straightforward. We use it daily to make business decisions. The new AI features make it even faster for us to derive information, and they even help find items we were not currently observing. Our developers had the product providing data from our system to our Staging instance the day we signed up.
Theodore L. Business Analyst
2. Heap
Heap is a digital analytics platform that automatically captures all user interaction data, empowering product and customer experience teams to optimize experiences and drive informed decisions.
Heap’s Journeys provides a visual map of every user’s path through your product, complete with conversion rates and step-by-step analysis, offering unparalleled clarity into user behavior.
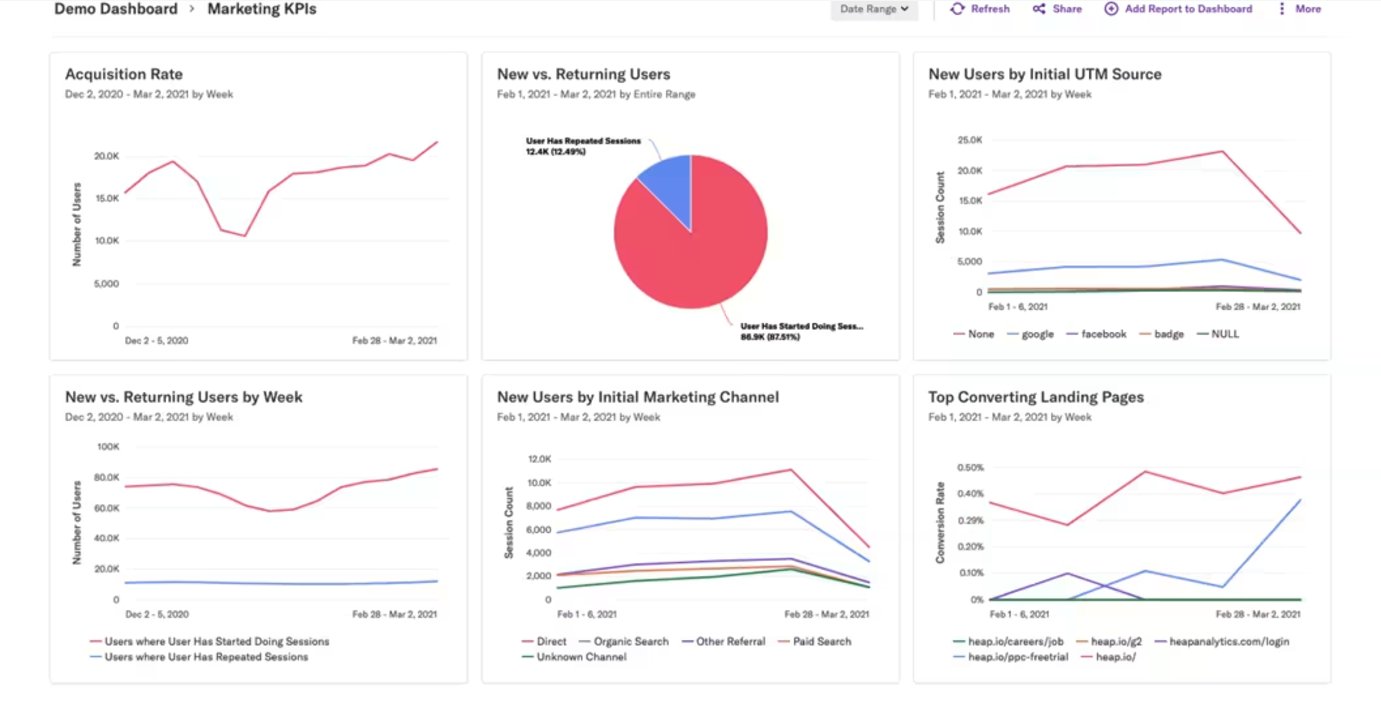
Dashboard overview:
Heap Dashboards enable teams to align on core business metrics and drive insights-driven action by organizing, customizing, and sharing key analytics. Features like time-based chart filtering, customizable layouts, and quick-sharing options ensure critical metrics are easily accessible and actionable across the organization.
Features:
Heap Illuminate
Data Science Capabilities
Session Replay
Funnels
AI CoPilot
Heatmaps
Segments
Pricing:
Plan Type
Details
Free Trial
Free trial
Free
Up to 10k monthly sessions
Paid
Sign up for an estimate
A customer experience as per G2 reviews:
You can get very granular detail on user behaviour, knowing exactly who is using what and how often, is exactly the information every business should be leveraging for product improvement! Installation is so easy, developers don’t need to do a lot of work to add the script, and you are collecting data from day 1. Our CSM and their support team are excellent resources for helping with complex problems, and the UI is always improving and easy for beginners to get started with! I use it almost every day, it’s as valuable as having 3 extra research resources and 3 times as fast!
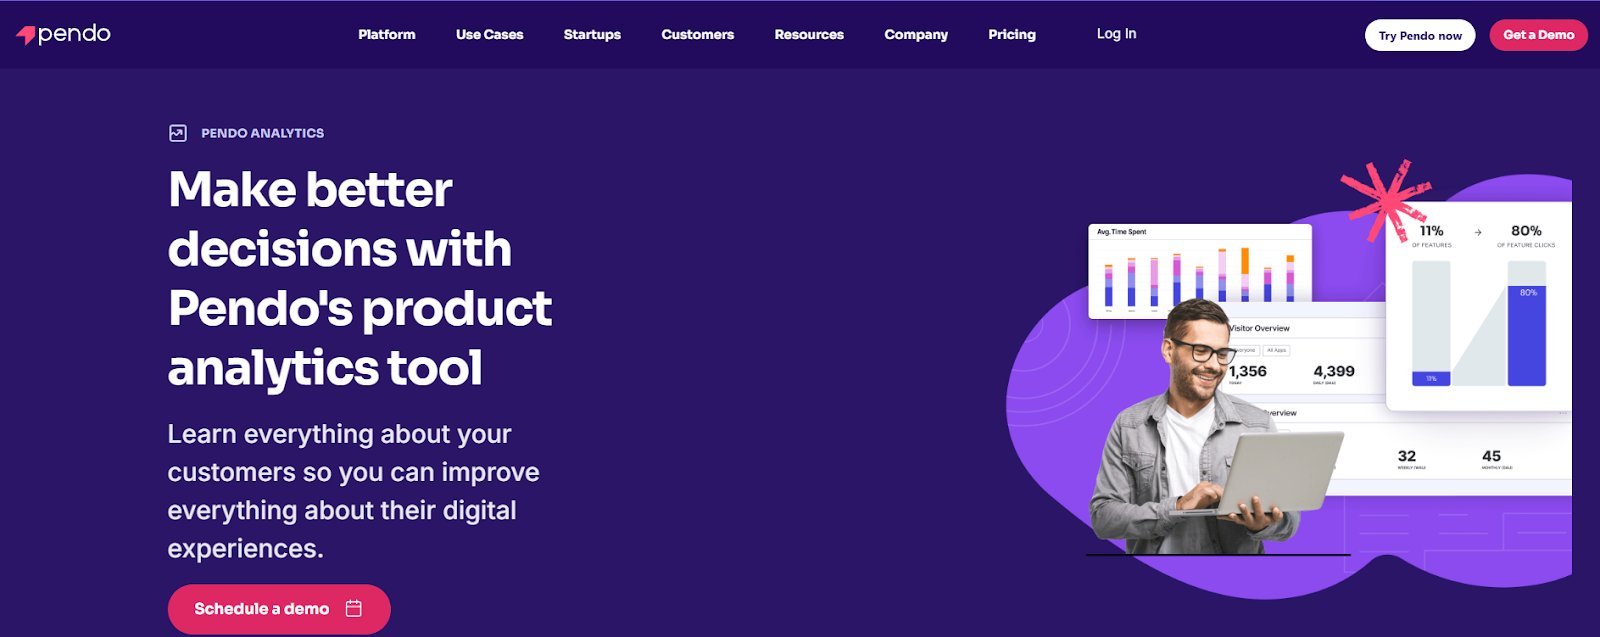
Pendo is a product experience platform with a robust product analytics tool that delivers actionable insights into user behavior across web and mobile applications. Simple to use and accessible to all teams, Pendo’s analytics make it easy to answer key product questions, empowering businesses to enhance user experiences and optimize product performance.
Pendo Analytics integrates with in-app guides to enhance user navigation, feedback tools to monitor user sentiment and requests, and roadmapping features to plan and prioritize product initiatives.
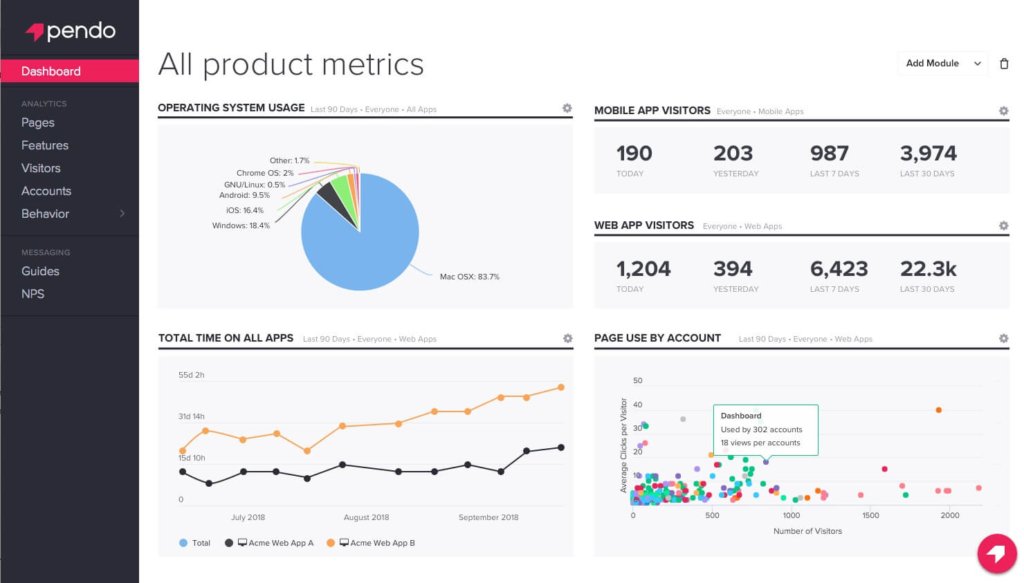
Dashboard overview:
Pendo Dashboards provide an efficient way to access insights and drive data-informed product decisions. Users can customize dashboards to track metrics like onboarding, feature adoption, and stickiness, with options to share, export, and present them for seamless team alignment.
Pendo Analytics
Features:
Pendo AI
AI Insights and Recommendations
Behavioral Data
Session Replay
Validate
Retroactive Analytics
Pricing:
Plan Type
Details
Free Trial
Free trial
Free
Up to 500 monthly active users
Paid
Price on request
A customer experience as per G2 reviews:
I appreciate the custom coding options available in Pendo, which significantly enhance its flexibility and usability. These options are especially valuable when the standard, in-the-box solutions fall short, as they allow me to tailor the software precisely to meet our unique needs and overcome specific limitations of Pendo itself, thereby resolving issues and addressing constraints effectively.
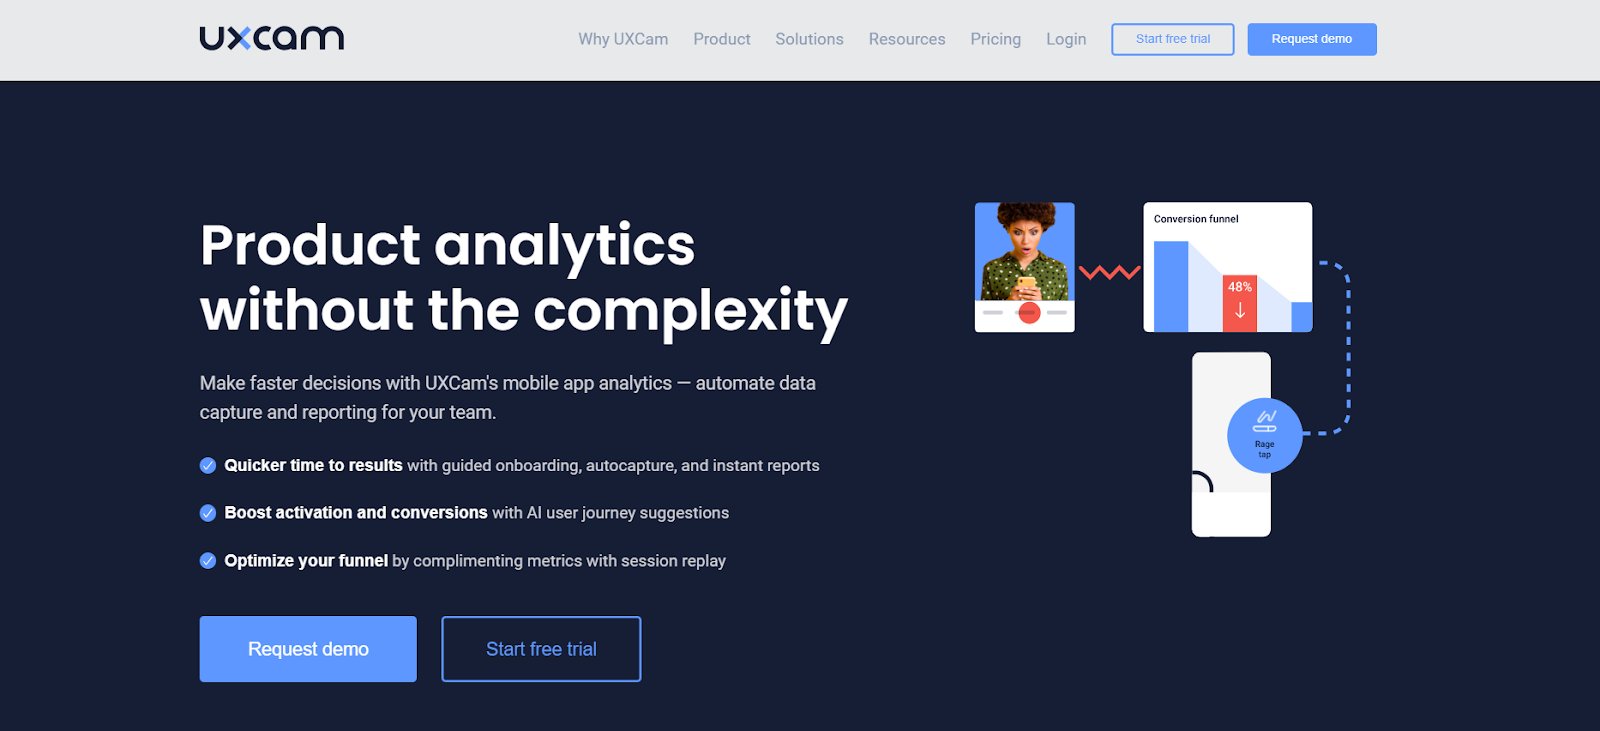
UXCam is a product analytics tool designed to monitor user behavior in mobile apps. It provides a clear overview of user engagement, helping teams enhance app performance and overall engagement.
Using Heatmaps and session replays, UXCam tracks user behavior and uncovers the “why” behind drop-offs, enabling targeted optimizations for a seamless experience.
Screen flows provide insights into user journeys, revealing navigation patterns, analyzing specific flows between start and end screens, and identifying problematic screens where users drop off.
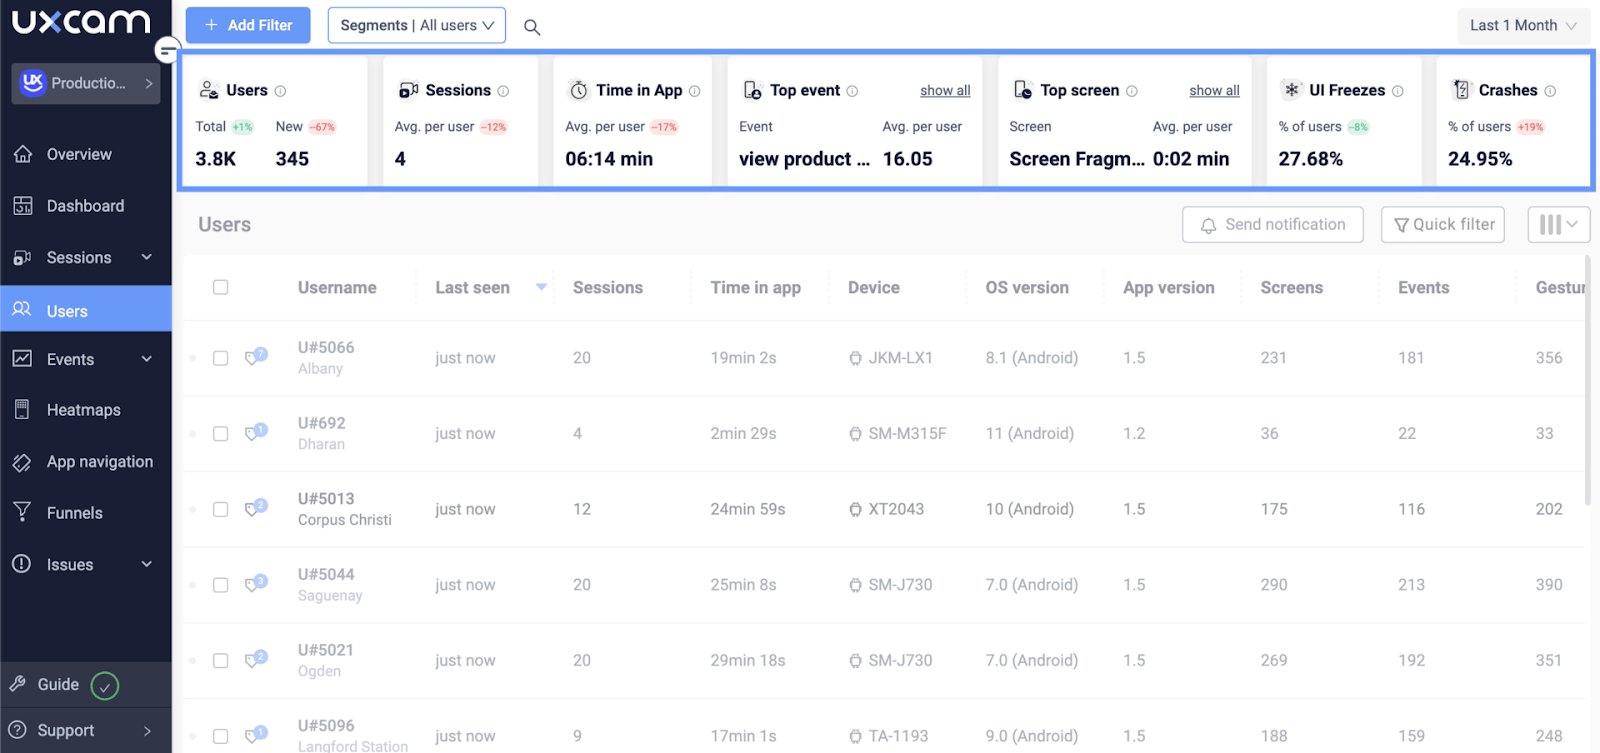
Dashboard overview:
UXCam Dashboards centralize all KPIs with interactive dashboards and AI-generated reports, eliminating manual setup and enabling quick trend recognition. Tailor dashboards to track metrics, uncover user behavior patterns, and share or export data quickly for seamless collaboration and confident decision-making.
I like the insights it provides as well as the crashes. The most important thing for me is the qualitative data it gathers from the user sessions. I love the recommendations for generating quick dashboards as well as the information it recommend. The integration is very simple and easy, as a basic integration. Also, the ease of implementation was helpful for my dev team. Customer support is AWESOME, I´ve been using the chat every time, and it provides excellent information. I use it on a day-to-day basis to gather information for my App on different countries
LogRocket simplifies product analytics by uncovering the “why” behind critical metrics and user behaviors over web and mobile apps. It visualizes trends, user flows, and retention data quickly.
Funnel analysis identifies drop-offs, while session replays offer context and reveal opportunities to enhance features and boost conversions. Requiring minimal technical expertise, LogRocket helps teams drive user adoption and optimize product performance.
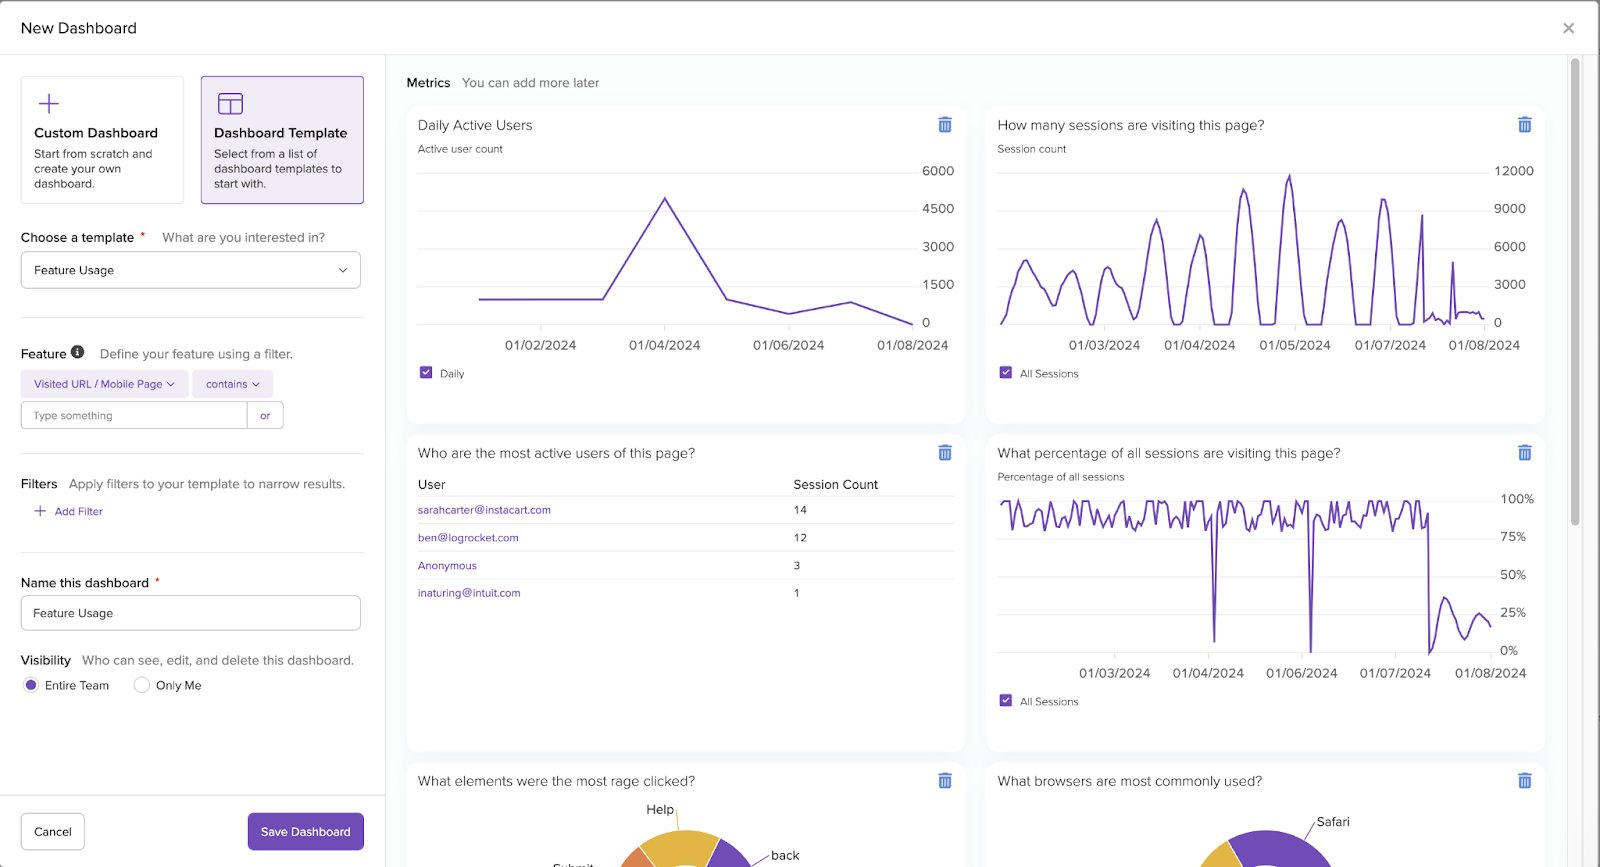
Dashboard overview:
LogRocket Dashboards provide a comprehensive view of user interactions and experiences over time, helping teams monitor app performance, detect errors, and address usability issues that hinder feature adoption and conversions. With versatile chart options and time-range filtering, they offer flexible, data-driven insights to optimize the user experience effectively.
LogRocket’s Analytics
Features:
Cohort Analysis
Retention Charts
Event Autocapture
Session Replays
AI Insights
Path Analysis
Heatmaps
Pricing:
Plan Type
Details
Free Trial
14 days for the Team and Professional plans
Free
1000 sessions/month
Paid
Starts from $69/month, billed annually
A customer experience as per G2 reviews:
LogRocket is very easy to use and simple to integrate into an existing app. It provides an excellent overview of how users interact with the product and helps identify parts of the UI where they might be struggling. It’s also a great tool for debugging since you can see exactly what the user experienced before an issue occurred.
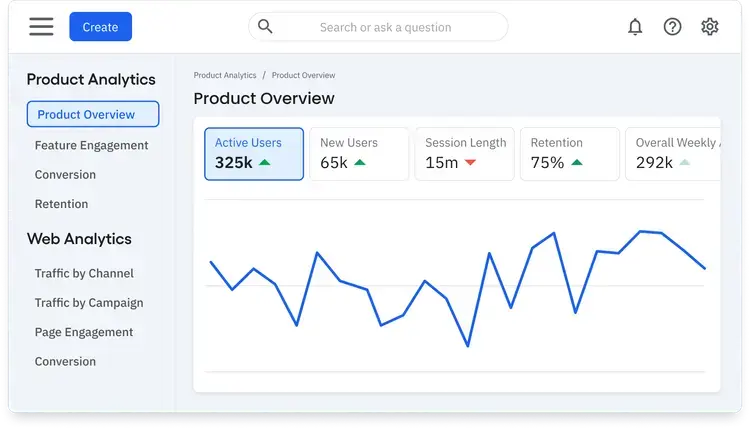
Amplitude integrates data with behavioral insights and AI automation, delivering fast, precise answers to growth challenges without coding. It provides actionable insights to enhance products and improve conversion, engagement, and retention.
Dashboard overview:
Amplitude Dashboards enable baseline reporting, charts, and visualizations with minimal setup. Teams can access real-time user data, uncover critical insights, and track metrics like conversion, retention, and feature engagement, all with little to no customization.
Amplitude’s Product Analytics
Features:
Session Replays
Behavioral Analytics
AI-Automated Analysis
Funnel Analysis
Event Segmentation
Pricing:
Plan Type
Details
Free
Starter plan for tracking up to 50K MTUs
Paid
Starts at $49/month, billed annually; custom quotes as the business scales
A customer experience as per G2 reviews:
Amplitude Analytics offers a wide range of charts, from basic to advanced, that address nearly all the needs you might have for product analytics. In addition, it provides effective data management tools like data alerts—which I find extremely useful—and data governance features that become especially valuable as your product grows in size and complexity. What truly stands out for me, though, is Amplitude’s customer support. Their team consistently provides thoughtful, well-reasoned responses and quickly grasps the issues I’m facing. It’s honestly the best support team I’ve ever encountered.
Mixpanel is a product analytics platform that empowers businesses to understand user behavior, drive conversions, and improve retention through actionable insights. Designed for teams focused on user engagement and product-market fit, it captures interactions across web, mobile, and app environments to deliver a unified, real-time view of the customer journey.
Dashboard overview:
Mixpanel’s intuitive dashboards make data analysis accessible to everyone, eliminating the need for SQL expertise and enabling organizations to make faster, smarter decisions.
Mixpanel’s Dashboard
Features:
Session Replays
Cohort Analysis
Anomaly Detection
Insights
Funnels
Retention & Flow Reports
Custom Events
Pricing:
Plan Type
Details
Free
For up to 20 million monthly events
Paid
Starts from $24/month, includes 10k events and advanced analytics
A customer experience as per G2 reviews:
MixPanel is super simple, flexible, and robust. We previously used a very centralized approach with Tablaue, where only the data team was able to produce complex reports. The shift to Mixpanel proved to be a huge game-changer that helped ys x2.5 on Black Friday. The real time, the decentralised approach, so everyone has the ability to create reports, the ease of use – all made our team much more data savvy than before.
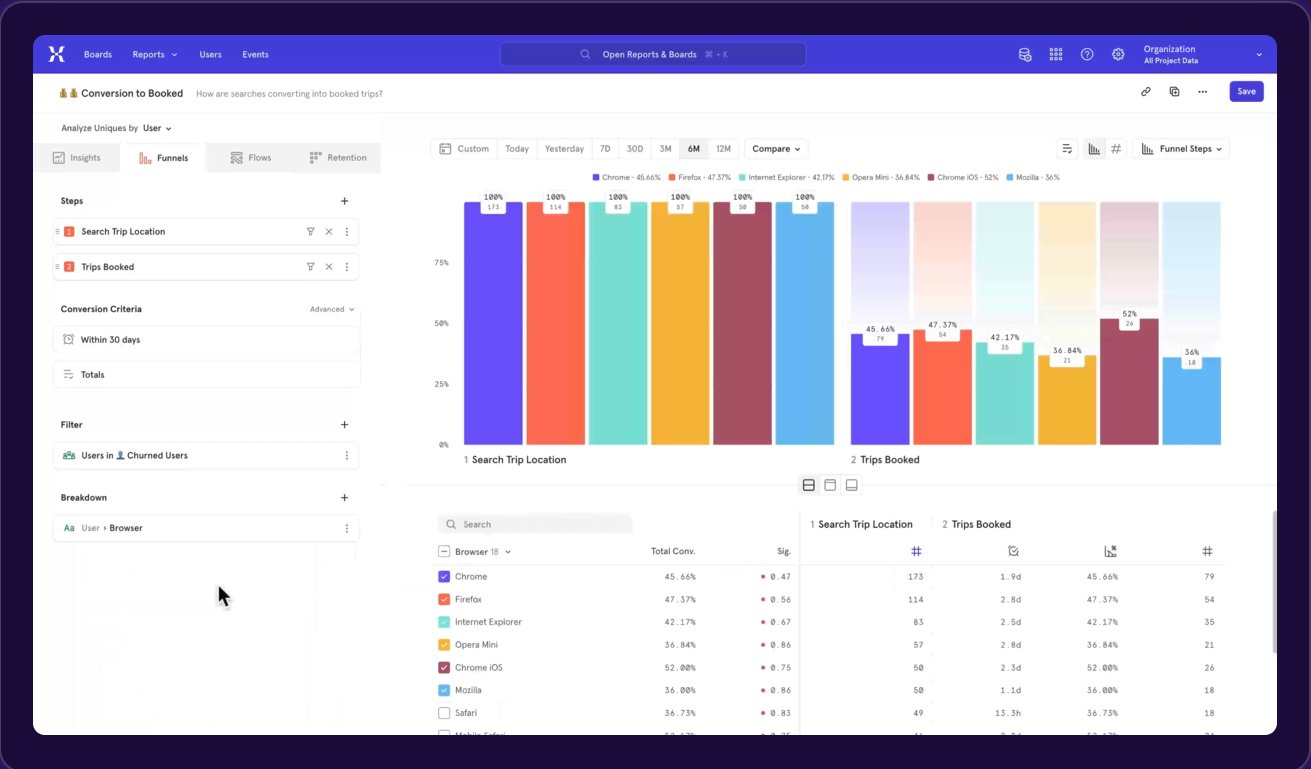
Whatfix product analytics helps businesses drive user adoption and product growth by providing deep insights into user behavior. With no-code event tracking, teams can create custom user events without engineering dependencies.
The platform offers behavioral analysis through Funnels and Journeys, uncovering friction points and user patterns. Advanced segmentation and cohort analysis enable comparisons of feature usage across periods or user groups for data-driven decisions. A natural language interface simplifies analytics, eliminating the need for deep expertise.
Whatfix enables businesses to create contextual, personalized experiences that boost retention and engagement by capturing and analyzing behavioral data in one platform.
Key features:
User Journeys
Trend Insights
Funnels
Cohorts
Surveys
AI-Powered Insights
Adoption Health Dashboard
Custom Dashboard
Tags
Pricing:
Plan Type
Details
Free Trial
Yes, available
Paid
Prices are not available on the website
A customer experience as per G2 reviews:
What I like most about Whatfix is how simple it makes user onboarding and training. The step-by-step walkthroughs are very intuitive and save a lot of time for new employees or customers. It also reduces support queries because users can find answers directly within the platform. The analytics feature is another big plus, as it helps track user engagement and improve processes continuously.
Selecting a product analytics tool is a strategic decision requiring careful consideration of your unique business context. The right tool should empower your team to make data-driven decisions and continuously improve your digital products. Here are a few must-haves:
Define business objectives
Product analytics tools are not one-size-fits-all solutions. Start by clearly identifying your primary goals: improving user retention, understanding feature usage, reducing customer churn, or optimizing user onboarding.
Assess technical ecosystem and integration requirements
Your chosen analytics tool must seamlessly integrate with your existing technology stack. Evaluate the tool’s compatibility with your current platforms, API capabilities, and potential for smooth data migration.
Evaluate data collection and analysis capabilities
Look for tools that balance automatic and manual event tracking with robust capabilities for user segmentation and real-time analytics. The depth of insights and reporting flexibility should align with your team’s analytical needs and technical expertise.
Consider scalability and future growth
Select a product analytics platform that can grow alongside your business, handling increasing data volumes and offering flexible pricing models. Consider the tool’s product roadmap and ability to support your long-term strategic objectives.
Understand the total cost of ownership
Beyond the monthly subscription, factor in implementation costs, training expenses, and potential productivity gains. A slightly higher-priced tool might deliver significant value through more comprehensive insights and efficiency.
Prioritize user experience and accessibility
Choose a tool with an intuitive interface that minimizes your team’s learning curve. Consider the availability of training resources, the quality of customer support, and the clarity of its reporting and visualization capabilities.
Compliance and data privacy considerations
Ensure the analytics tool meets crucial data protection standards like GDPR and CCPA. Carefully review the platform’s data storage practices, security certifications, and data anonymization features.
Proof of concept and comparative evaluation
Don’t rely solely on marketing materials; request demos, utilize free trials, and conduct small-scale pilot tests. Involve key stakeholders in a hands-on evaluation to understand each tool’s practical application.
How do product analytics platforms work
Product analytics tools transform complex user data into clear, accessible insights; these platforms empower teams to make data-driven decisions, refine user experiences, and align products with strategic goals. Here’s how they typically function:
Data collection
Platforms track user actions like clicks, page views, navigation paths, and feature usage across web and mobile applications. Data is collected through SDKs, APIs, or event tracking, ensuring comprehensive behavioral insights.
Data processing
The raw data is organized into meaningful categories, including events, attributes, and user segments, allowing precise analysis. Key metrics such as retention rates, feature adoption, and conversion paths are also processed for deeper insights.
Visualization and reporting
Insights are presented through intuitive dashboards, charts, and heatmaps, making it easy to monitor KPIs, track trends, and identify bottlenecks in the user journey.
Behavioral analysis
Advanced features like funnels, cohort analysis, and user flows help teams understand where users drop off, what features they engage with, and how they navigate the product.
Actionable insights
Many platforms use AI to surface critical trends, highlight friction points, and provide recommendations for optimization. This enables teams to improve feature adoption, enhance user retention, and drive conversions.
Integration and scalability
These platforms integrate with CRMs, marketing tools, and other data sources, unifying analytics across systems. They are designed to scale alongside growing user bases and expanding data needs.
Trends in product analytics tools for 2026
Several key trends are emerging in product analytics tools that reflect technological advancements and evolving business needs. Here are the prominent trends shaping the landscape:
AI-powered analytics
AI is revolutionizing product analytics by automating data processing and providing predictive insights into user behavior. This allows teams to anticipate future actions, enabling proactive decision-making regarding feature enhancements and user engagement strategies.
Real-time data processing
The analytics landscape is shifting from historical reporting to forward-looking insights. Modern platforms now offer instant data processing, near real-time insights, predictive user behavior modeling, and automated recommendations for product improvements.
Cross-platform analytics
As products expand across various digital touchpoints, there is a rising demand for unified cross-platform analytics. Tools are evolving to provide comprehensive tracking across web, mobile, and other interfaces, offering a holistic view of the user journey.
Voice and conversational analytics
With the increasing use of voice assistants and chatbots, product analytics tools are beginning to track voice interactions. This trend acknowledges the need to understand user behavior in these emerging interfaces.
Enhanced data visualization
Data presentation is becoming more intuitive and storytelling-focused. Interactive dashboards, narrative-driven reporting, and contextual data interpretation transform complex data into clear, actionable insights.
Low-code and no-code analytics
Data analysis is becoming more accessible through user-friendly interfaces. Drag-and-drop report builders, automated event tracking, and reduced technical dependencies are democratizing advanced analytics for product managers and business leaders.
Privacy-first analytics approach
With growing global privacy regulations, analytics tools are redesigning data collection strategies. The focus is on enhanced user consent mechanisms, granular data anonymization, transparent data handling, and compliance with international privacy standards.
Can’t decide on a product analytics tool? Try VWO and get the best result
VWO offers an all-in-one platform to optimize digital experiences across diverse teams, including UX researchers, product managers, CRO specialists, and digital marketers.
By combining behavioral analysis, testing, and planning in a unified platform, VWO enables teams to uncover actionable insights, implement data-driven improvements, and maintain efficiency through seamless collaboration.
VWO Insights: Decoding user behavior
VWO Insights transforms raw data into actionable insights by integrating user behavior analysis with optimization efforts. It combines surveys, behavior analytics, and form optimization to deliver a comprehensive solution:
Session Recordings: Watch real users navigate your site to uncover pain points.
Heatmaps, Scrollmaps, Clickmaps: Visualize engagement patterns and interaction hotspots.
Form Analytics: Track form completions and pinpoint abandonment issues.
Conversion Funnels: Analyze user journeys to identify and address drop-off points.
Website Surveys: Gather feedback with advanced features like AI-generated questions, multilingual support, contextual triggers, and survey logic.
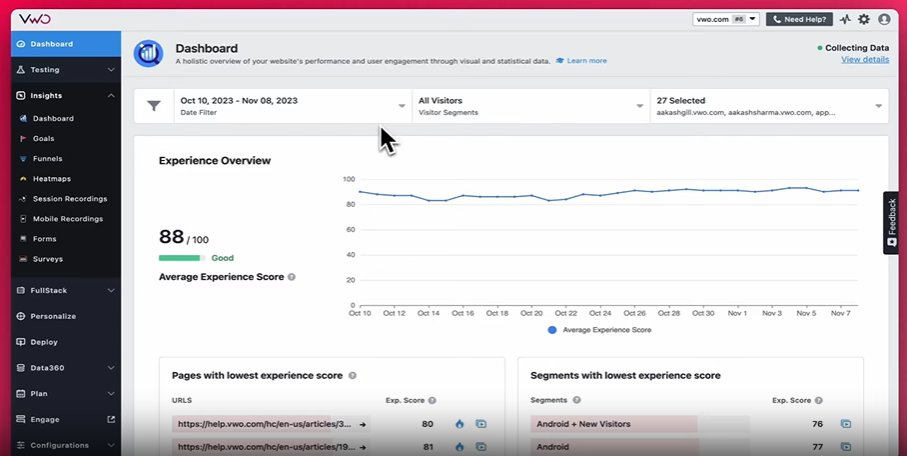
The Insights Dashboard – web centralizes visitor behavior data, offering an experience score to identify areas for improvement. It provides quick access to session recordings, heatmaps, and form and survey analytics summaries, streamlining user experience analysis and optimization efforts.
VWO Testing & VWO Feature Experimentation
VWO Testing helps teams optimize the frontend experience — layouts, copy, and visual elements users interact with. With a no-code Visual Editor, you can make changes instantly and run A/B and Split URL tests to quickly identify winning variations and lift conversions.
VWO Feature Experimentation extends this into the product backend, supporting server-side tests and feature rollouts using feature flags, progressive deployments, and advanced targeting. It helps product and engineering teams validate features safely and automate rollbacks based on performance signals — turning product analytics into continuous improvement, not just reporting.
Watch this interview to learn how analytics powers smarter product decisions:
Personalization
Personalization allows the usage of visitor demographic, behavioral, and activity data to deliver tailored experiences. It enables the creation of customized journeys for different audience segments, nudging them toward conversions and enhancing their overall buying experience.
Features:
No-code editor
AI Copilot
Dashboards
Pricing:
Plan Type
Details
Free Trial
30-day trial, all features included
Paid Plans
Customized plans based on your business goals.
A winning tale:
Micro Focus, a leader in digital transformation, used VWO to optimize its websites and sub-domains through sequential testing, achieving significant improvements in user engagement and conversions.
By leveraging VWO’s tools, such as heatmaps, session recordings, and split testing, Micro Focus built a culture of experimentation that consistently enhances user experiences and drives business growth.
In our client’s words:
We needed a platform that could support structured experimentation while ensuring a smooth user experience. VWO stood out because of its ease of use and ability to provide actionable, data-driven insights. It has allowed us to optimize our product faster and make informed decisions with confidence. Before using VWO, running tests was more manual and time-consuming, limiting how quickly we could experiment. VWO has simplified this by providing a seamless setup, structured analysis, and clear reporting. This has allowed us to scale our experimentation efforts and optimize with greater speed and accuracy. For teams that prioritize experimentation, VWO offers a structured and efficient approach to testing. Its tools make it easier to gain insights and drive meaningful product improvements.
Understanding and analyzing user behavior is essential for optimizing your product and delivering exceptional digital experiences. This list of product analytics tools is designed to help you find the one that aligns with your business needs.
But remember, the value of these tools lies in how effectively you act on the insights they provide. From improving user journeys to driving better engagement and conversions, the right approach can make all the difference.
Choose a tool that collects data and empowers you to take impactful actions. If you’re ready to take the next step, explore VWO’s features. Request a demo or start your free trial today!
FAQs
Q1. What are product analytics tools?
Product analytics tools track and analyze user interactions within a product, offering insights into behavior, feature adoption, and engagement to drive data-informed decisions.
Q2. Why are product analytics tools important?
They help businesses understand user behavior, optimize features, enhance user experiences, and improve metrics like retention, engagement, and conversion rates, ultimately driving growth.
Q3. How do I choose the right product analytics tools?
Consider features like event tracking, user segmentation, dashboards, scalability, integrations, data security, and pricing. Ensure the tool aligns with your team’s needs, including support for non-technical users.
Q4. What are the best product analytics tools?
The best tools provide essential features like event tracking, segmentation, dashboards, and scalability while aligning with your business needs. A tool that combines robust analytics and ease of use, such as VWO, is ideal, but the choice depends on your specific requirements.
Q5. What are product metrics?
Product metrics are quantifiable data points, such as user retention, feature adoption, conversion rates, and churn rates, that measure a product’s performance and user impact.
Q6. How user-friendly are product analytics tools for non-technical users?
Most tools offer intuitive interfaces, no-code options, and clear visualizations, making them accessible for analysis and decision-making to non-technical users.
Q7. Can these tools track user engagement across different devices?
Yes, many tools, such as VWO, support cross-platform tracking, providing unified insights into user interactions across web, mobile, and other devices.
Q8. Are there any free product analytics tools?
Yes, tools like Google Analytics and Heap offer free plans with basic features, while others provide trial versions for evaluation.
Q9. What are the 4 types of product analytics tools?
Behavioral Analytics Tools: Analyze user actions and behavior. Funnel Analytics Tools: Track user flows and drop-offs. A/B Testing Tools: Test variations for optimization. Session Replay Tools: Replay user interactions for detailed insights.
Q10. Is Google Analytics a product analytics tool?
Yes, Google Analytics provides product analytics features like tracking user interactions and measuring performance, but it is primarily known for web analytics.
Q11. What are analytics tools?
Analytics tools are software solutions that collect, process, and analyze data to provide insights into various aspects of business performance, including customer behavior, marketing effectiveness, and operational efficiency.
I'm a branding enthusiast, marketer, and B2B content professional with over 20 years of experience. I'm also a certified native advertising expert and trained in strategic thinking. Author of 'Managing Modern Brands: Cult Theory and Psychology', and three other books in diverse genres. I generally write on marketing trends, optimization, brand strategy, consumer psychology, CRO, cult theory, data, personalization, and content strategy. With a strong expertise in building and leading teams and cross-functional collaboration, I have driven demand through content creation, data, digital media, content marketing, and technology.
Uncover hidden visitor insights to improve their website journey
One of our representatives will get in touch with you shortly.
Awesome! Your meeting is confirmed for at
Thank you, for sharing your details.
-
, you're all set to experience the VWO demo.
I can't wait to meet you on at
Account Executive
, thank you for sharing the details. Your dedicated VWO representative, will be in touch shortly to set up a time for this demo.
We're satisfied and glad we picked VWO. We're getting the ROI from our experiments.
Christoffer Kjellberg
CRO Manager
VWO has been so helpful in our optimization efforts. Testing opportunities are endless and it has allowed us to easily identify, set up, and run multiple tests at a time.
Elizabeth Levitan
Digital Optimization Specialist
As the project manager for our experimentation process, I love how the functionality of VWO allows us to get up and going quickly but also gives us the flexibility to be more complex with our testing.
Tara Rowe
Marketing Technology Manager
You don't need a website development background to make VWO work for you. The VWO support team is amazing
Elizabeth Romanski
Consumer Marketing & Analytics Manager
Trusted by thousands of leading brands
Awesome! Your meeting is confirmed for at
Thank you, for sharing your details.
Your Roadmap to Better Results
1:1 Demo customized to your industry and optimization goals.
Feature deep-dive into the user behaviour tools you need most.
No-pressure advice on the best path forward for your team.