Imagine yourself as a bike racer, working hard to win the next competition. You change your diet to increase protein content and reduce carbohydrates. Then, you buy clothes suitable for a bike race and change your gym routine to make your body more adaptive to bike racing. You are personalizing your whole routine for your goal.
To measure personalization success, you decide to keep track of a certain metric. But the metric tells you about the progress in weight lifting, and there is no clue about the improvement in cycling time. Without any idea of your cycling performance, you enter the race. Do you think you will win the competition?
While it’s a no-brainer that the situation and your chances of winning will be odd, this example teaches the importance of tracking the right metric. The right metric navigates you toward your goal and prevents you from getting lost on the wrong path.
Download Free: Website Personalization Guide
Metrics measurement has the same importance when it comes to the personalization of consumer experience. Each metric has its significance and contributes differently to personalization success. Thus, it’s important to know when to track a particular metric depending on the goal.

So, let’s dive into metric measurement and its relationship to the success of a personalization campaign. We will then look at ROI tracking of personalization because a positive ROI is the ultimate aim of any business, and it decides the continuation/repetition of the campaign.
Personalization and its significance
Before going forward, let’s understand personalization and its significance in your marketing strategy.
Personalization is customizing the experience of returning users to make them feel more connected. The whole process of this customization is based on data gathered from past interactions, behavior, and customer background.
The reason personalization is so important is that it makes the customer feel special and see things of interest at different touchpoints. Thus, making the customer stay for a longer time, increasing the lifetime value of a customer, and reducing the customer acquisition cost.
Now, let’s move on to the crucial part of measuring personalization success with the key metrics.
Key metrics to measure personalization success
Forrester conducted a survey that included 372 business decision-makers. The survey revealed that only 30% of firms have the right metrics to measure the success of their personalization program. The key metrics are equivalent to understanding your customer’s response to your digital communication effort. Some of these key metrics are as follows:
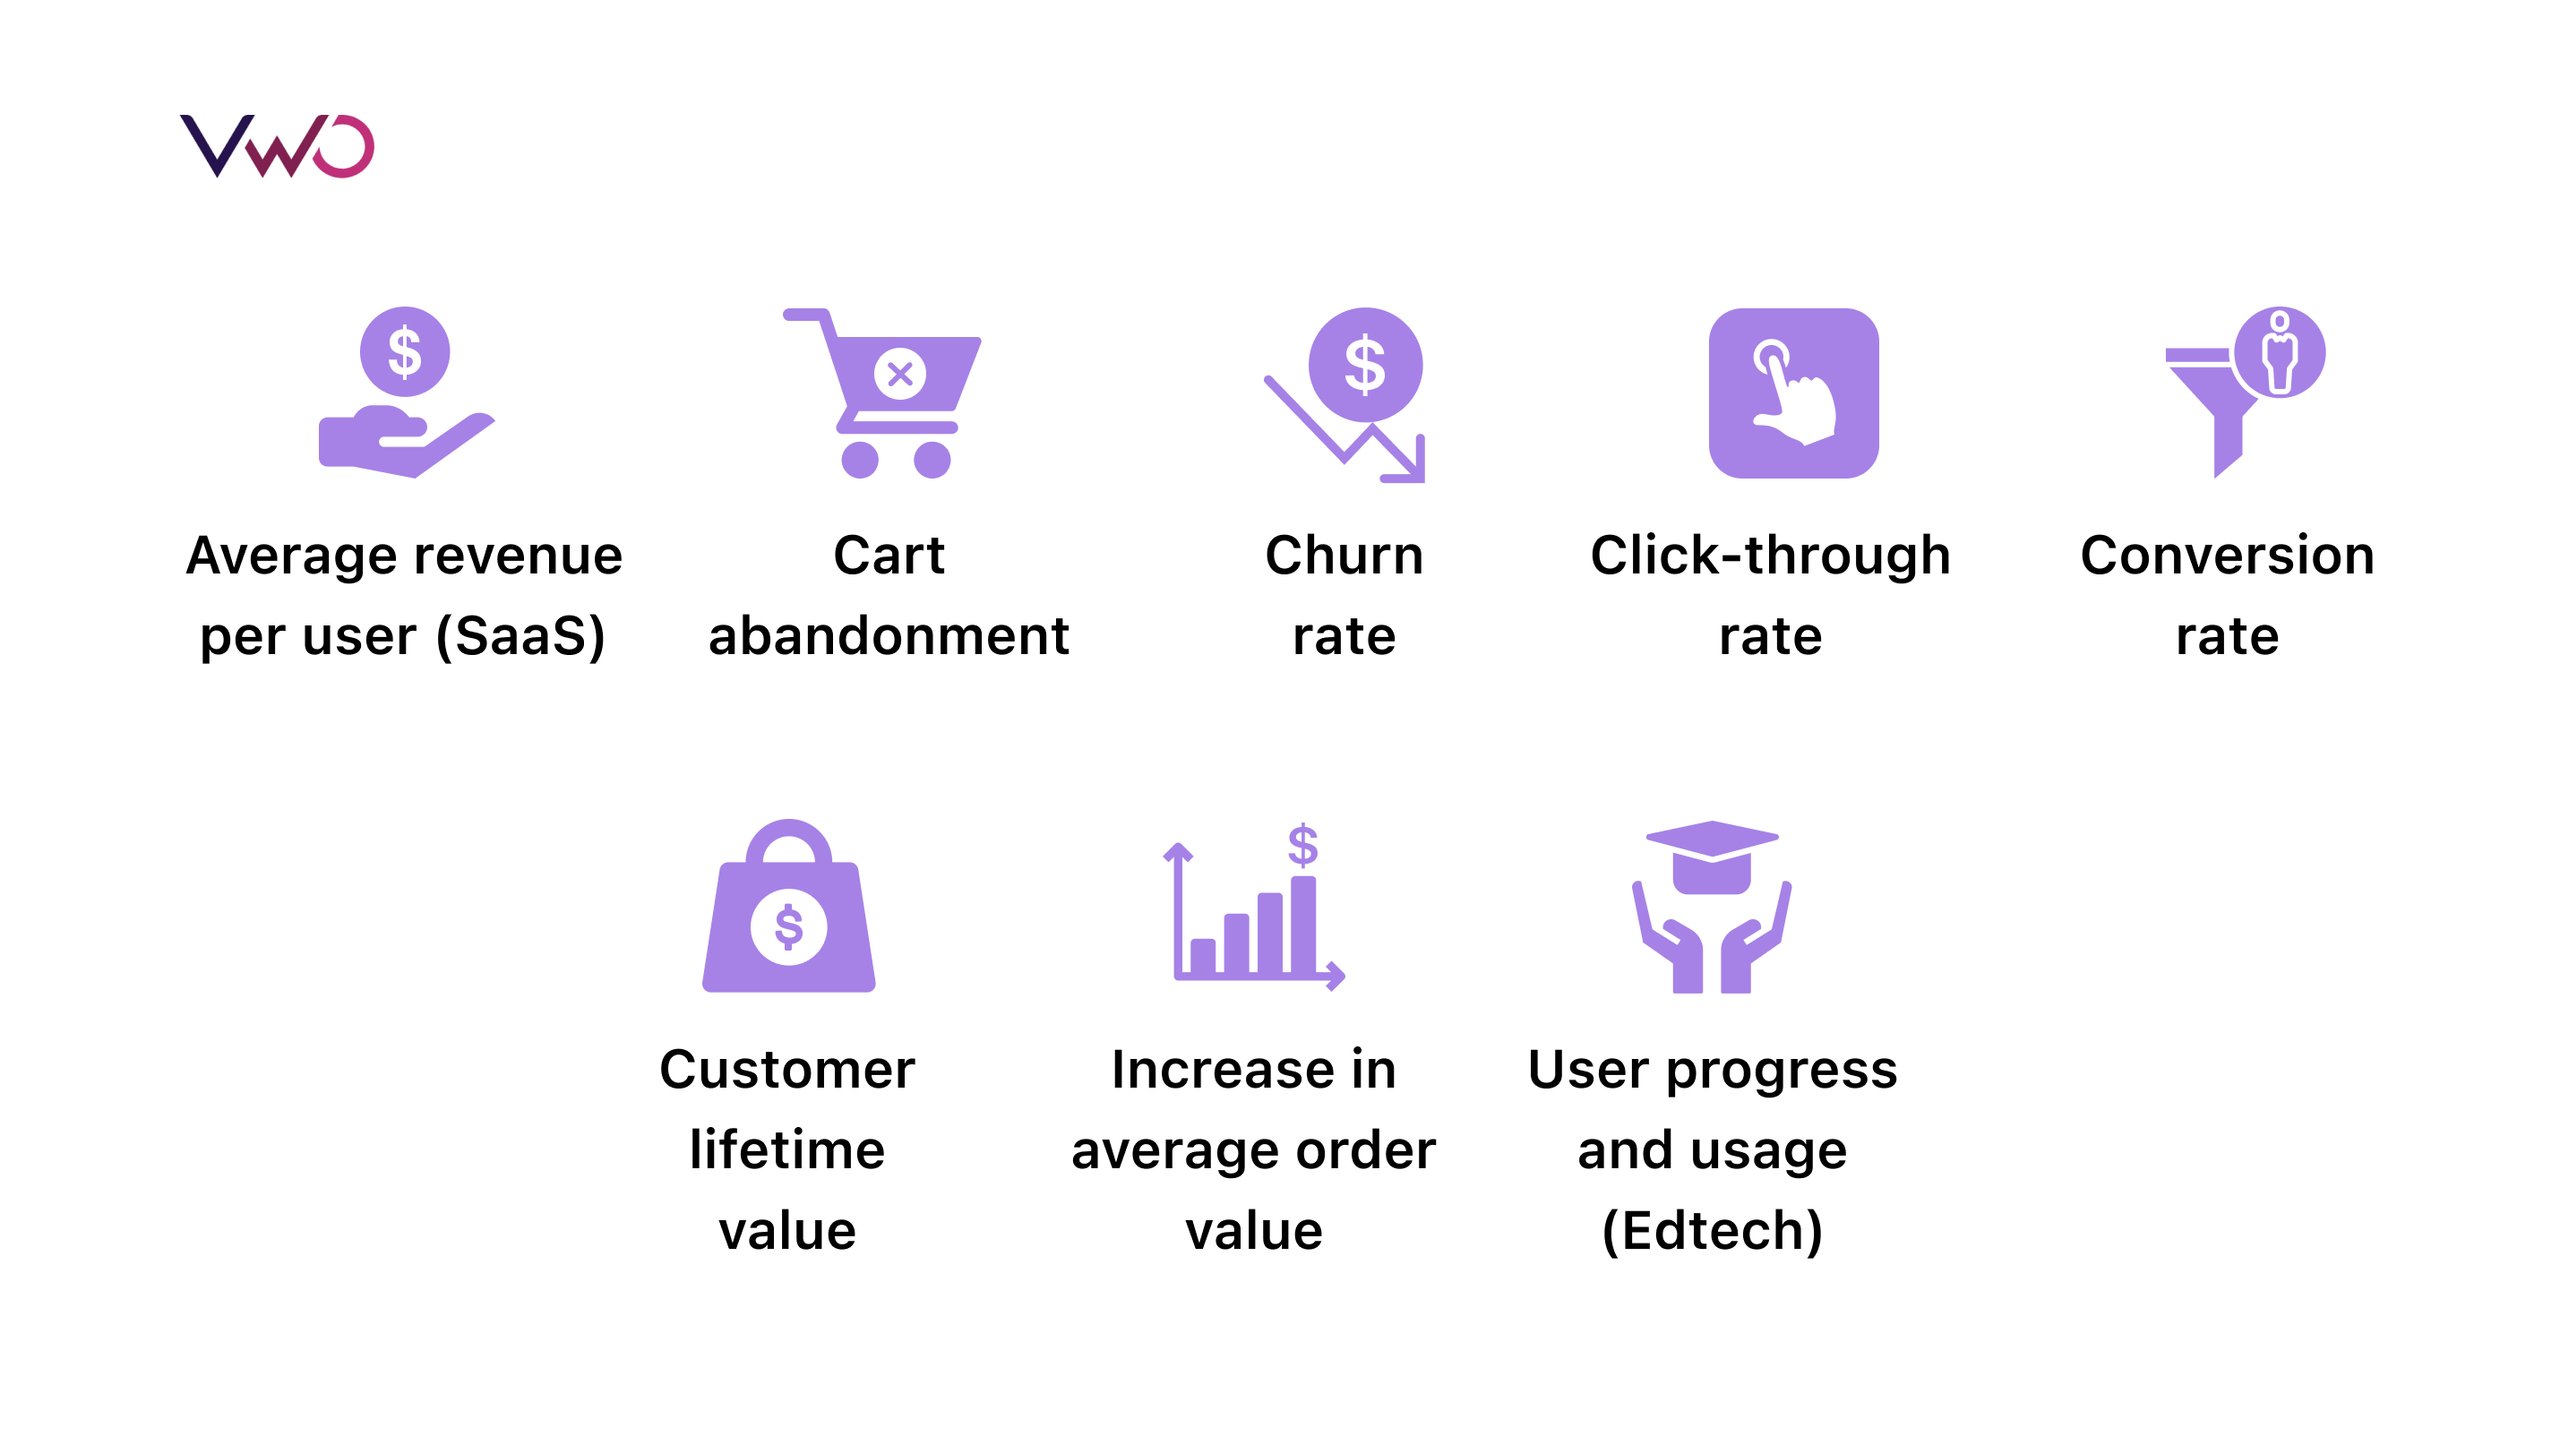
Here’s an explanation for each of the metrics –
Average revenue per user (ARPU)
It is one of the key metrics that is mainly used in the SaaS industry. This metric is tracked when you roll extensions and packages tailored for customer segments. For example, say a company offers a SaaS marketing tool with an off-page SEO analysis feature. Now, the company is rolling out an on-page SEO analyzer with a $5 increase in subscription for its loyal customer segments in the initial stages. In such a situation, tracking ARPU becomes crucial to know the effectiveness of the campaign to roll out the extension.
An increase in the average revenue per user means that the personalized campaigns to suggest extensions and packages have successfully aligned with the customer’s needs and interests. Thus, this metric summarizes the ROI of the marketing campaigns.
Here is the formula for ARPU calculation:

Cart abandonment
This metric combined with past customer behavior data helps understand your customers’ purchase behavior. For instance, say you have a group of regular customers that buy whenever there’s an offer discount, and in a recent buying journey, they abandoned the cart because there were no new promotions or offers. This particular behavior helps in segmenting the group as discount seekers. You can personalize the upcoming campaign with offers for this specific group and again track the cart abandonment rate to check the success of the personalization measure.
Also, sometimes due to a lack of payment options, users drop out at the last step. Thus, when you test your payment gateway page with new payment methods, tracking the abandonment rate helps in knowing their efficacy.
So, this key metric is vital when you enrich your customer’s experience with new favorable payment methods or offers on the product. Also, this data is required for segmenting users, who can be targeted with custom digital marketing ads and communication.
The equation to calculate cart abandonment is as follows:

Churn rate
Churn rate helps you gauge the dissatisfaction in customers while using your product or service in the follow-up interaction. When you want to increase the revenue from returning users, then tracking this metric is vital.
Churn rate tracking before and after personalization helps in knowing whether the tailored experience is keeping up with customers’ expectations.
Here is the formula for the churn rate:

Click-through rate (CTR)
A website, whether a SaaS or eCommerce platform, has multiple call-to-action buttons which guide the customer to make a decision. Tracking the CTR of these buttons is essential when the goal is to understand the effect of UI/UX on the customer’s decision. CTR tracking of buttons like add to wishlist, add to cart, read details, etc. helps pinpoint where the customer is finding ease or difficulty in navigation.
CTR tracking in personalization becomes vital when the returning customer sees the product catalog based on interest and past purchases. Thus, tracking CTR buttons before and after personalization aids in making the UI/UX and product recommendation better, which in turn affects sales.
The formula to calculate CTR is as follows:

Conversion rate
Conversion rate gives you a complete picture of your sales cycle and its weak points. This metric helps in testing hypotheses related to gaps and personalization measures.
It also tells you about the impact of the product recommendation mechanism, especially when the revenue has a significant chunk from returning customers.
You must track this key metric for personalization when you see a stream of traffic but lowering/ stagnant sales and if you are testing new features for a custom experience.
Here is how you can calculate the conversion rate:

Customer lifetime value (CLV)
CLV is tracked when the long-term association is in view with multiple transactions between a customer and the company. Personalization success monitoring with this key metric determines whether the experience was as per customers’ needs. You track it not just for one campaign but for a larger picture.
The formula for CLV measurement is as follows:

Download Free: Website Personalization Guide
Increase in average order value
This metric is essential when you want to improve cross-selling, subscriptions, and related course sales. The success of the personalized products section on the webpage is known through this metric.
One example is Bear Mattress, which utilized VWO to redesign the cross-sell flow and personalize the recommendation based on purchase behavior history. The goal to increase order value and key metric tracking helped them increase revenue by 16%.
An increase in average order value is calculated as follows:


User progress and usage
A metric that is the heart of eLearning website analytics, you must measure it after the personalization of study material and courses for the user. It helps validate hypotheses for personalized course recommendations.
The formula to measure user progress and usage:

Now, that we know the importance of metric tracking in personalization success, let’s move on to an overview of the ROI of personalization measurement. Personalization is worthy only when it positively contributes to the ROI.
Keeping a check on the ROI of your personalization campaign
There is no doubt that personalization increases revenue. As per Deloitte, Starbucks once carried out a personalization campaign that included 400k personalized messages. The campaign saw a threefold increase in the offer redemption.
ROI from personalization must be checked on a dashboard with pre and post-personalization campaign results rather than in silos. To check ROI, go through the Conversion Rate, ARPU, and Average Order Value of the control group to whom you showed the personalization campaign and compare it with your previous data.
Also, it’s necessary to monitor human resource involvement, third-party tool usage, and disruption (if any) in the regular flow of work while measuring the ROI.
In the end, to improve the ROI of the personalization program, the foundation needs to be strong. This means you must have a robust data strategy that fills all the gaps and creates a strong visual of the consumer journey.
Measuring personalization success with VWO
VWO Personalize makes personalization easy and effective. It helps you trigger unique experiences for specific audiences at the right place and time by –
- Leveraging visitor data
- Prompting experiences via triggers that are based on visitors’ persona or events like when one refreshes a page
- Helping you create experiences via the visual editor without relying on developers each time
With VWO Personalize, you can track how your personalization campaigns impact the conversion rate for the metrics associated with the campaigns. Our platform allows you to track the following goals:
- Page Visits
- Form Submits
- Clicks on Link
- Clicks on Element(s)
- Revenue
- Custom Conversion
- Engagement
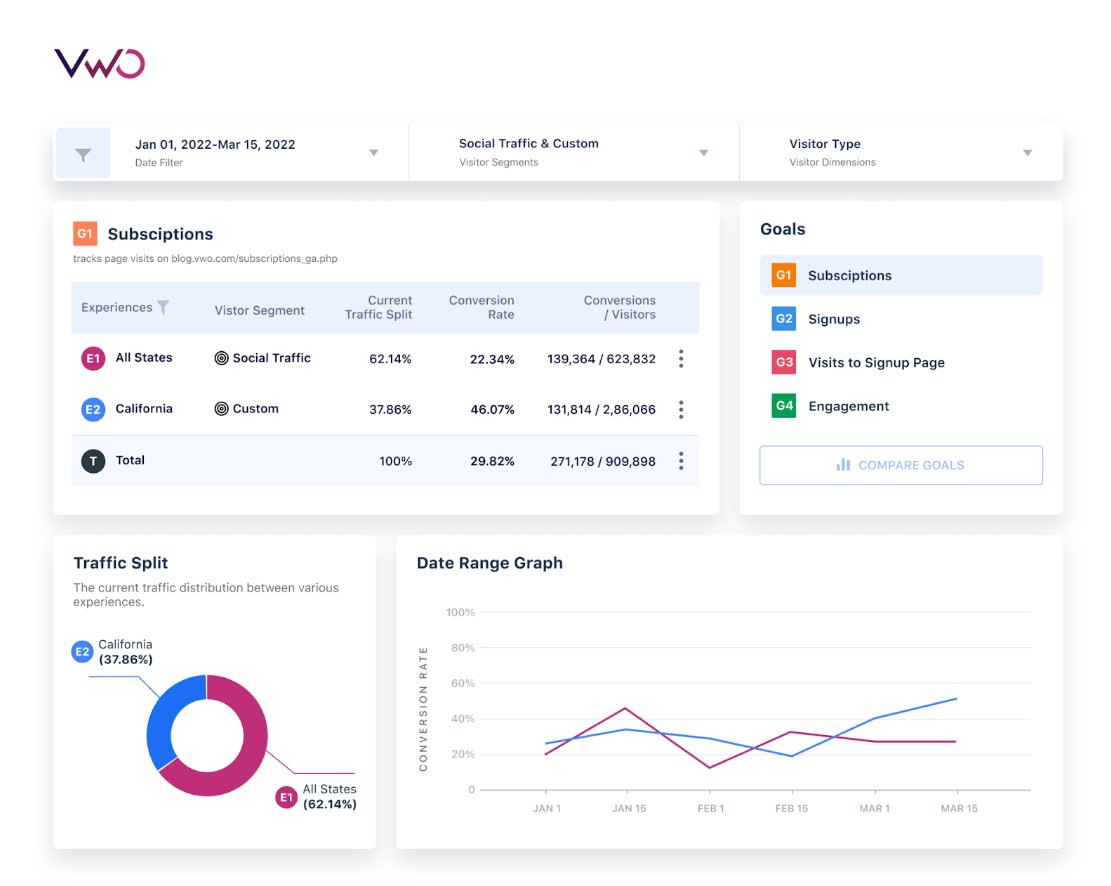
The VWO Personalize report dashboard shows real-time conversions and is easy to read, which assists in better business decisions. The ongoing personalization journeys can be optimized based on report observations.
Conclusion
The true potential of personalization is unlocked with the right metric tracking. It’s like becoming a pro in bike racing, measuring your cycling performance each time, analyzing faults, and making more personalized efforts to grab the competition trophy, while your competition is still measuring weight lifts or making efforts without any analysis.
In the growing business competition, your trophy is a loyal consumer base, and personalization measured with the right metric is your effort. Metric tracking will help you personalize and become the true server to a loyal consumer base.
Let VWO Personalize become a partner in your journey, and it will do the heavy lifting of bringing you accurate reports on your key metrics. Also, create 1000s of consumer journeys, run A/B tests, create variations with an easy-to-use visual editor, measure ROI, and get behavior insights on a single dashboard. Grab a free demo for all the VWO features and capabilities including personalization.


