In my career I’ve worked in two different worlds. The first is the world of science – clever people running careful experiments and seeking truth. The ultimate goal is to publish papers that reveal truths.
The second place I’ve worked is the world of finance – clever people trying to make choices in the face of uncertainty that have a high probability of making money.
Most A/B testing tools use hypothesis tests designed for the science world. SmartStats is an A/B testing statistics engine inspired by the financial world and designed to make money even in the face of uncertainty.
Download Free: A/B Testing Guide
As a scientist I’ll formulate a hypothesis – for example, ‘blue webpages convert more than red ones’. I’ll then design an experiment like exposing visitors to red and blue webpages and measuring conversion rates. The experiment is run, and the number of correct guesses (and the number of failures) is tallied.
As a scientist, I want to know that the effect I just observed – let’s say blue converts better than blue – is real. So I’ll assume the null hypothesis – in this case that red and blue are the same – and try to disprove it. I’ll run a hypothesis test and compute the probability of seeing the experimental results ‘that I just saw’ assuming the null hypothesis (basically the “opposite” of the result I’m looking for) is false. If this probability is low, I’ll conclude that this is strong evidence against the hypothesis. If the probability is high, then this is weak evidence against the null hypothesis.
My goal here is to avoid publishing false results. If blue webpages don’t convert more than red ones, I don’t want to publish a paper saying it does. Publishing a lot of papers that can’t be replicated will make me look dumb. Frequentist hypothesis testing is a great fit for this use case.
Businesses Need Actionable Answers
If I were trading stocks, I don’t necessarily care about truth. If I buy a stock at $10, it stays flat, and then I sell it at $10, I’ve lost nothing (ignoring transaction costs). If I do this 10 times, and the stock goes up half the time and stays flat the other half the time, I win – I made money 5 times and didn’t lose money the other 5 times.
“Conversion rate optimization is a lot more like trading stocks than like publishing science papers.”
I believe that conversion rate optimization is a lot more like trading stocks than like publishing science papers. Coming back to our earlier test of red versus blue webpages, suppose now that I’m 50% certain that blue pages convert better and 50% certain that they are equal to red ones. If I were a scientist, I’d wait for certainty before publishing.
When businesses A/B test, either the red webpage or the blue webpage will be deployed. The only question to answer is, ‘which one?’
So if I’m 50% certain that the new blue webpage converts 10% more than the current red page, and 50% certain they are both the same, I’ll deploy the blue page right away.
The blue webpage is a smart business decision, even if it’s not a proven scientific hypothesis. The blue webpage might be a win, but it’s definitely not a loss.
The tradeoff we made while designing SmartStats is that instead of trying to find the absolute truth, SmartStats looks for the better choice. The benefit of this is that we can get results in much less time. We risk getting more false positives, but only false positives that won’t hurt the bottom line. SmartStats is designed to give you more intelligent answers quickly so that you get more time to increase your conversions and more time to test more ideas. Also, if you want to be really, really sure, there’s also a High Certainty mode that takes longer and tests more samples to get really accurate.
Reducing your Potential Loss
The way we deal with false positives is by ensuring that we minimize the cost of any mistake. The potential loss of page A is the lift you would lose by deploying A when in fact B was better.
For example, suppose there is a 50% chance that A is 10% better than B, and a 50% chance that B is 10% better than A. The potential loss from choosing A is 50% x 10% = 5%, and the potential loss from choosing B is 50% x 10% = 5%. This is pretty high, so your best bet is to continue testing.
Potential loss can become small (very close to zero) in two ways. The first way, and most common, is for one variation to be not worse (but possibly not better) than the other variation. The second is for both variations to be identical, and thus nothing is lost by choosing one or the other. If one variation is known to be definitively better than the other, this case also applies.
Download Free: A/B Testing Guide
More Accurate Calculations
Our new calculations are also more accurate than our old ones. Our old method used a common trick the Central Limit Theorem and approximated the true statistical distribution by a normal distribution. This approximation works very well if you have a lot of samples. That’s not possible for all customers, so it became clear to us that we needed to find a better way to get more accurate answers.
Let’s look at a couple of graphs that illustrate the problem. We’ll consider an A/B test with a 5% conversion rate. When we have 10,000 visitors, the true distribution and the normal approximation line up perfectly:
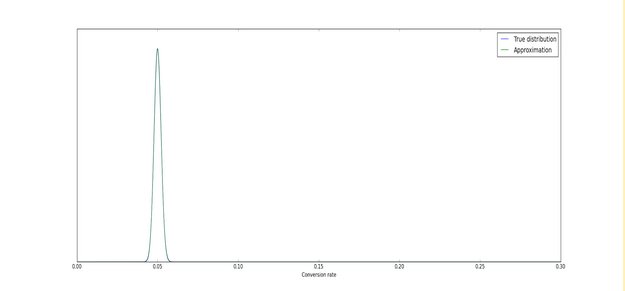
That’s great for anyone who has tens of thousands of visitors reaching the end of their funnel every week.
In contrast, as you can see in the graph below, when we have only 100 visitors the green and the blue line differ significantly.
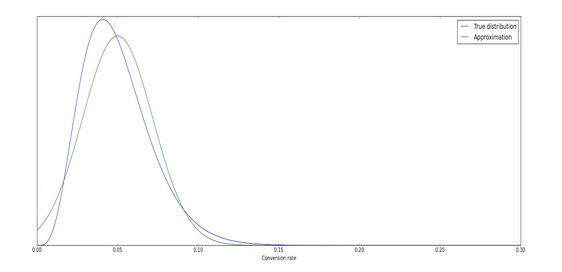
“The true calculations are more difficult for both our math geeks and our computers, but it gives more accurate and faster results.”
Our old method used the approximation (the green line) in our calculations whereas our new method uses the true distribution (blue line) itself. (For the more technically inclined, the true posterior is a beta distribution) It’s more work for us – the true calculations are more difficult for both our math geeks and our computers – but it gives more accurate and faster results.
Fun fact: A lot of statistical techniques tell you something like “this method is only accurate if number of conversions > 3 sqrt(num_conversions x ctr x (1-ctr))” or something along those lines. This kind of ‘rule of thumb’ is there to ensure that the green and blue lines agree with each other. As a result of using exact calculations, SmartStats does not require any such rules.
Take a Fresh Approach to Testing with SmartStats
SmartStats doesn’t change your fundamental testing process. You still need to identify a good hypothesis, run tests and wait for the results.
SmartStats just cuts down your waiting time, drastically. Finding intelligent answers quickly can widen your pipeline. You can run more tests, learn faster and improve conversions quickly. That’s a certainty which many will value.
Note: The author owns screenshots in the blog.


