

eCommerce has become an integral part of our lives, both personally and professionally. This is pushing businesses operating in this space to become more digital in their offerings and activities. To grow website traffic and engage more customers, marketing and sales strategies have to be backed by accurate and authentic data.
As an eCommerce player, your growth is dependent on conversion rates. Read on to develop an understanding of some crucial factors that drive the eCommerce conversion rates.
Download Free: Conversion Rate Optimization Guide
What is eCommerce conversion rate?
The eCommerce conversion rate is the ratio of transactions to sessions, expressed in the form of a percentage. For instance, a ratio of one transaction against every ten sessions would make for an eCommerce conversion rate of 10%.”
Used in conjunction with other critical metrics, conversion rate serves as an excellent barometer to measure the health, performance, and competitiveness of your online store. The higher the conversion rate, the better the customer value proposition and the lower the customer acquisition cost. To make any meaningful improvement in your eCommerce conversion rates, it is important to take an audit of your current conversion rate.
Analyze your eCommerce website for free
What is the average conversion rate for eCommerce websites?
As per Monetate, the global average eCommerce conversion rate is 2.2% for Q1 of 2023. But a significant conversion rate disparity exists across industries, devices, sources, regions, and the like.
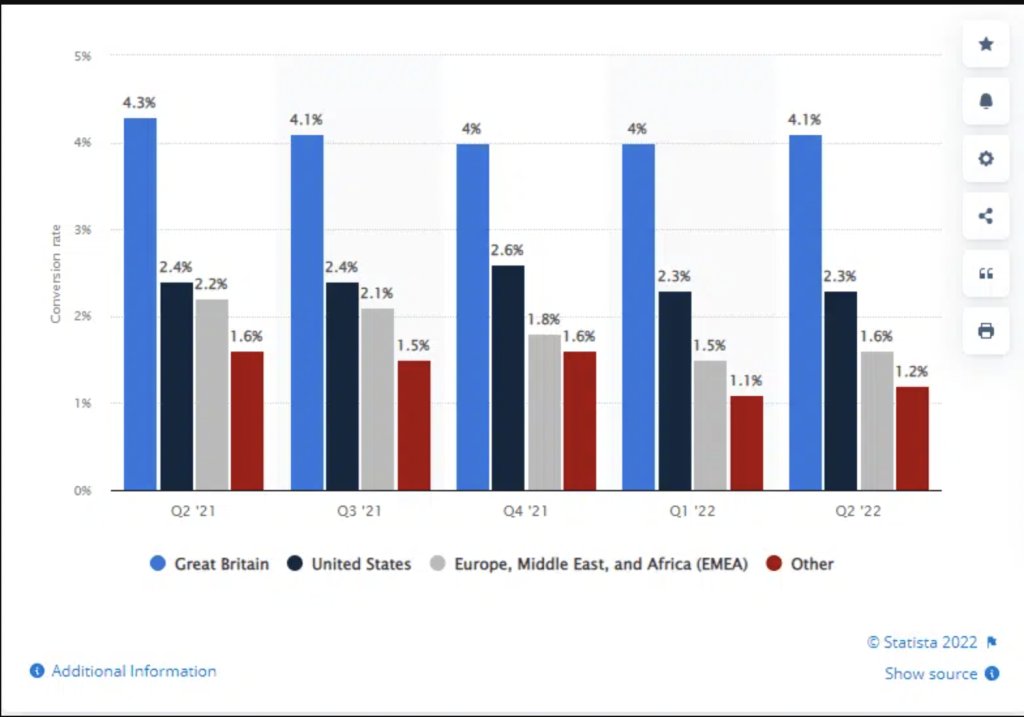
For instance, the average conversion rate for the health and wellbeing market was 2.8% in March 2023, as compared to 0.8% for the luxury kitchen and home appliances market. As per the report, Great Britain’s eCommerce sector has an average conversion rate of 3.4%, while the corresponding number for the EMEA is 1.1%.
Therefore, it’s important to develop your key eCommerce performance indicators (KPIs) as well as to take into account market-specific nuances while analyzing the average eCommerce conversion rate of your industry.
Similarly, if you’re comparing your eCommerce website’s conversion rate with competitors, be mindful that no two businesses can have the same conversion rate. Several factors come into play – your target audience, geographic areas of business, products or services sold, penetration in the market, and more. As per Recurly, Amazon boasts of a 13% conversion rate, which is nearly 7x the average industry standard.
eCommerce conversion rate by industry
When drafting in-house goals and benchmarks, referring to market-specific conversion rate standards can prove to be highly valuable, especially to gauge the general and overall performance of eCommerce stores.
IRP Commerce is one of the best sites to study market data. The graph below shows the average eCommerce conversion rates of various industries as of March 2023 and the growth in conversion rate with respect to March 2022.
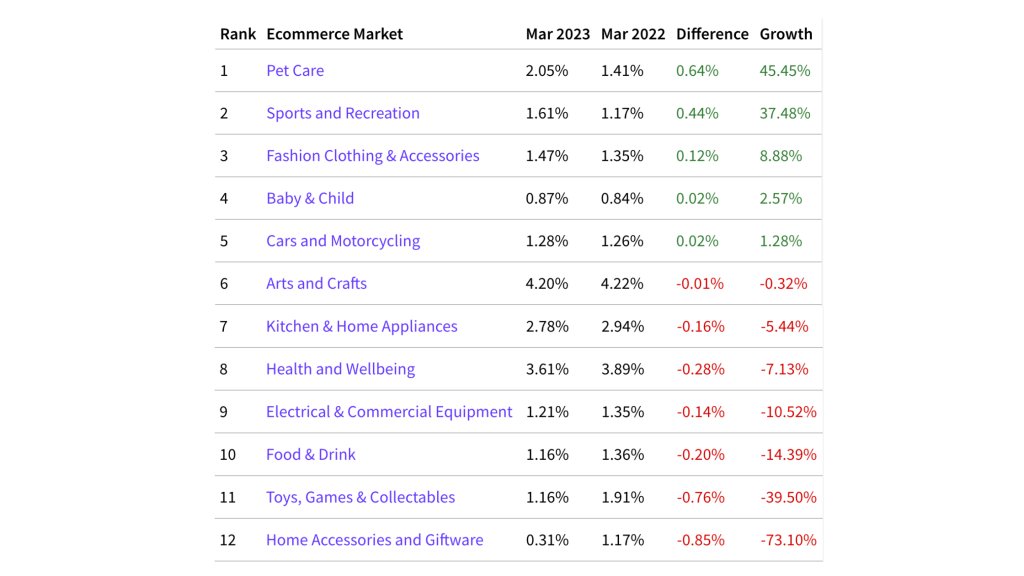
eCommerce conversion rate by country
When formulating your KPIs, it’s essential to consider benchmark conversion rates of leading commerce countries. The conversion rate you’d expect from Brazil, for instance, will be quite different from that of the US. This difference in average conversion rates is driven by many factors.
a. Mature markets
Mature markets with well-established online brands generally have higher conversion rates, while those where eCommerce is still trying to penetrate and facing stiff competition from brick-and-mortar stores will naturally churn a lower conversion rate.
b. Purchasing power parity (PPP)
PPP is one of the primary differentiating factors. Besides a country’s inflation rate, its economic growth rates, consumption pattern, and demographic changes also significantly affect the conversion rate.
c. Credit card penetration (CCP)
The global dynamics behind credit card penetration (CCP) has been quite unpredictable. For instance, in Europe, credit card penetration in the Netherlands is significantly lower than in Nordics, Luxembourg, and the United Kingdom. Hence, the eCommerce conversion rate here ought to be correspondingly different.
d. Logistics and distribution
Not all countries across the globe have the presence of a robust logistics and distribution network. That is why eCommerce businesses in many countries are unable to meet high-velocity demands. This again accounts for a low online store conversion rate in many countries as compared to some others.
Knowing the country-wise conversion rate serves well, especially when you’re planning to expand your market base. This kind of information helps make necessary amendments to your KPIs and prepare foolproof business strategies for sure wins. This is where developing an understanding of your conversion funnels can come in handy.
eCommerce conversion rate by channel/source
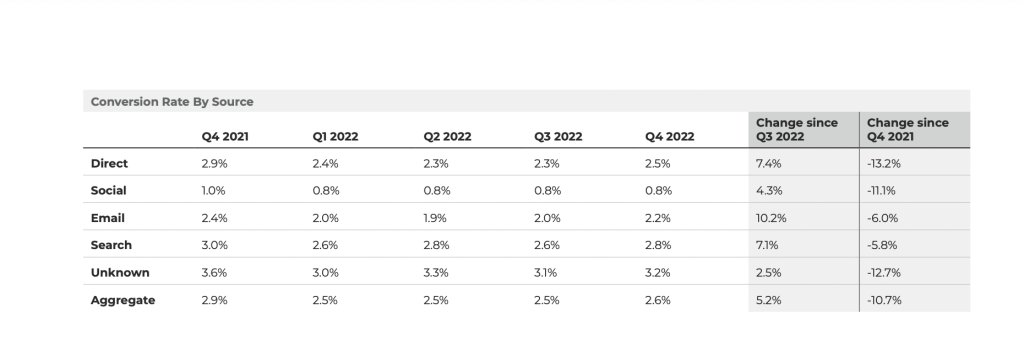
Besides the industry and country-specific conversion rates, segregating the eCommerce conversions based on traffic source is important. As per the latest stats gathered from industry-acclaimed statistical sources, except for social media, the conversion rate is between 2-3% for all traffic sources.
Every company, including eCommerce stores, run a series of initiatives to highlight their offerings – either through featured product roundups, guest posting on authoritative sites, social media campaigns, implementing SEO strategies, or running paid ads. The latest statistics show the need for data structuring and aggregation from most analytics tools on a customer data platform, as the highest conversion rate is coming from an unknown source.
Average eCommerce conversion rate by device
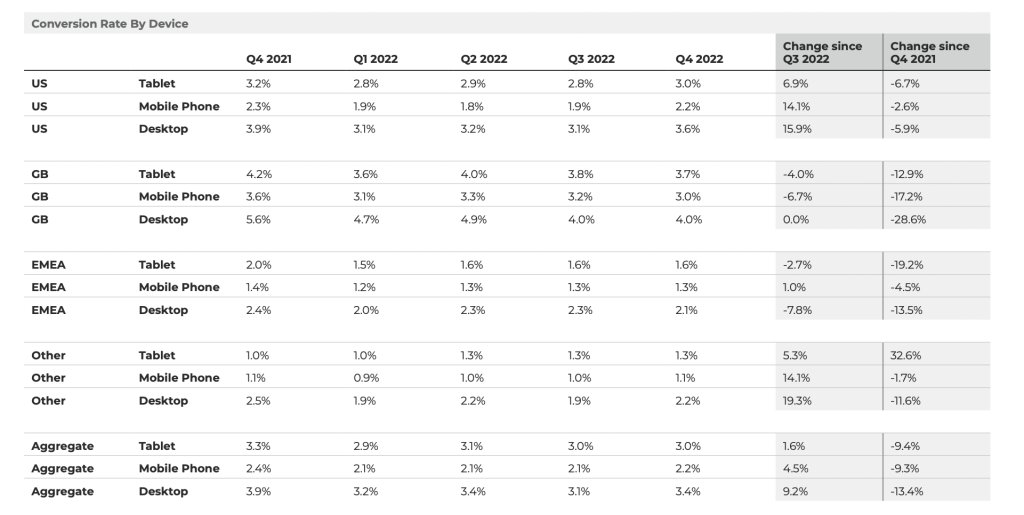
eCommerce conversion rates related to specific devices, typically desktops, smartphones, and tablets, need to be considered when formulating KPIs for generating high conversions. As can be interpreted from the data below, the online store conversion rate for the desktop is approximately 2x as compared to the ones from mobile devices.
eCommerce conversion rate statistics in 2022-23
- The fastest-growing e-commerce countries based on online sales are the Philippines and India. [Statista]
- Best-performing websites usually showcase the strongest conversion rates of 11.45% and more. [Wordstream]
- In April 2023, the Ecommerce Market witnessed a notable rise in the average conversion rate, which surged by 6.89% from 1.70% to 1.82% when compared to the same period in April 2022. [IRP Commerce]
- 85% of shoppers expressed the importance of product information and pictures when making decisions about which brand or retailer to purchase from. [Think with Google]
- A website that is ranked #1 on Google usually has a click-through rate (CTR) of about 30%. This percentage drops to 20% if the website is ranked third and goes below 2% if it is positioned ninth or below on SERP. [Advanced Web Ranking]
- The baseline eCommerce conversion goal of an online store must be 2%+. [Big Commerce]
- Mobile devices are a much popular choice for in-store price comparisons among users. [Statista]
- One of the primary reasons why people shop online is the ability to shop 24×7. [Drip]
- Industry experts predict that by 2040 nearly 95% of purchases will be eCommerce purchases. [99firms]
- As per a survey in 2022, 54% of respondents utilized search engines to get more information about a product. [Statista]
Download Free: Conversion Rate Optimization Guide
eCommerce conversion rate optimization
A good eCommerce conversion rate is not just an outcome of one-time work. You have to continuously optimize your website to keep the conversion rate above your baseline conversion goal. Here are some ways to do it:
a. Increase the website’s speed
It is to ensure that site visitors don’t drop off just because of the delay in loading the web content. Proven techniques include compressing product images using G-zip, switching to a dedicated server and CDN, utilizing caching plugins on the CMS for HTML and CSS minification, and eliminating render-blocking JavaScript.
b. Analyze visitor behavior
Understand how many visitors are dropping at each stage of the purchase cycle. You can analyze each stage with behavior analytics tools like heatmaps, session recordings, and form analytics to pinpoint the areas of improvement.
c. Experiment with pages with huge visitor drop-offs
Behavior analysis can reveal many insights about weak-performing pages; you can then conduct A/B tests to validate the solution that is based on the analysis.
For example, Perfect Plants, a small business based in North Florida sells plants through its eCommerce store. The team there conducted an A/B test with the hypothesis of repositioning the plant image on the product section for visitors coming via mobile devices. The test ended with a 19.26% increase in the number of clicks on the add-to-cart button. The winning variation had no image on the product page.
Thus, A/B testing creates a website experience that is convenient for visitors, which in turn improves the conversion rate.
d. Personalize the website experience
In a highly competitive environment where companies are vying to attract more customers, personalization is a powerful strategy to keep existing customers engaged. By analyzing data on their past behavior, you can customize various aspects such as product recommendations, headings on landing pages, and additional product options.
Let’s say you have a group of customers who enjoy purchasing discounted items. The next time they visit your website, you can provide them with a special offer code or discount, but with a requirement to spend a certain amount on products. This approach ensures that you cater to their preferences and interests, leading to a higher likelihood of converting their visit into a purchase.
Conclusion
Tracking conversion rates can be quite challenging. For eCommerce, tracking the cart abandonment ratio is critical. Only then one can identify and take corrective actions.
At VWO, we believe it’s best to adopt a focused approach to eCommerce conversion optimization. Rely on well-researched studies and sources, including Statista and Baymard, or conduct your primary research to define your website conversion rate benchmarks and KPIs.
Remember, the role of benchmarks is to help you understand the current performance of your online store. They’re not gold standards that can be replicated. A more systematic approach is to run conversion optimization A/B tests and learn what works best for your online store. Such a well-informed approach has the potential to increase your conversion rates by as much as 90%.
Frequently asked questions (FAQs)
It depends on the industry, target audience, geography, product type, etc. Thus, there is no single number that can be a benchmark for a good conversion rate.
As of April 2023, the average conversion rate is 1.82% for the eCommerce market as per data from IRP Commerce website.
As per a study that involved 100 million data points for 14 different industries. the average B2B eCommerce conversion rate is 1.8%.

Categories:


