

Between a click and a conversion lies an experience, and that’s where growth is won or lost. It’s no surprise that 65% of consumers say a single positive experience matters more than the best ad campaign ever made.
In 2026, the brands that win don’t just attract traffic; they deliver frictionless, relevant journeys at every touchpoint. Customer experience analytics makes this possible by turning behavioral signals, drop-offs, and real-time feedback into actionable insights that predict churn, power personalization, and guide experiments that drive measurable impact.
This guide demonstrates how customer experience analytics enables smarter decisions, continuous optimization, and sustained revenue growth.

What is customer experience analytics?
Customer experience analytics is the process of collecting and analyzing customer data across multiple interactions and touchpoints to gain deep insights into their behaviors, needs, emotions, satisfaction levels, and overall journey with a brand.
Businesses use CX analytics to understand what customers truly experience, beyond surface-level metrics, identify pain points, uncover opportunities for improvement, and ultimately deliver more personalized, frictionless experiences that drive loyalty, retention, and revenue growth.
Benefits of customer experience analytics
As acquisition costs increase, retaining and engaging existing customers becomes a priority. Customer experience analytics shifts teams from reactive fixes to proactive decisions by revealing what customers experience in real time, and why. Here’s how it transforms your business:
1. Reduction in customer churn
By identifying early warning signs of friction, such as a spike in the customer effort score (CES) or a drop in activity, you can intervene early with targeted solutions to reduce customer churn before it impacts your bottom line.
2. Boosted customer retention and loyalty
When you consistently analyze customer data to remove hurdles, you aren’t just selling a product; you’re providing a seamless experience. This turns one-time buyers into repeat customers and builds lasting customer loyalty.
3. Informed, data-driven decisions
Experience analytics replaces gut instinct with evidence. It provides the actionable data needed to prioritize product improvements, marketing investments, and experience fixes based on actual user behavior.
4. Increased Customer Lifetime Value (CLV)
Understanding customer preferences, purchase history, and emerging trends helps you identify cross-sell and up-sell opportunities, ensuring you maximize CLV through hyper-relevant interactions.
How customer experience analytics works
To understand the “how,” it helps to see customer experience analytics as a continuous cycle of listening, learning, and improving. It isn’t a one-time report or a static dashboard; it’s an ongoing process for identifying friction and driving measurable change.
At a high level, customer experience analytics follows a four-step cycle:
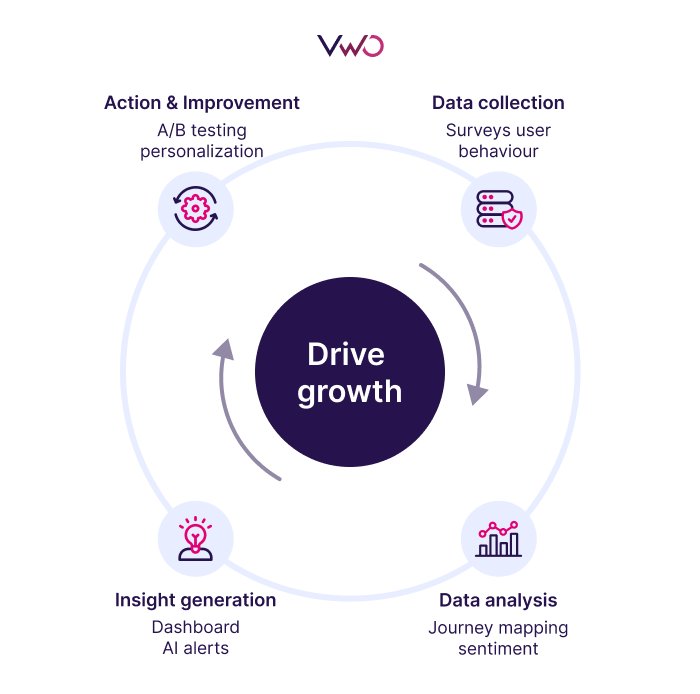
1. Data collection
This foundational step aggregates relevant data from diverse touchpoints to create a comprehensive view of the entire customer journey. To collect customer data effectively, sources include:
- Direct feedback (surveys, NPS scores, reviews, support tickets)
- Behavioral data (website clicks, app usage, purchase history, session replays)
- Interaction data (call recordings, chat transcripts, emails, social media mentions)
- Operational metrics (wait times, resolution rates, abandonment rates)
All this data is combined into a single customer view, often using a CDP (Customer Data Platform) or CX analytics platform.
2. Data analysis
Once data is centralized, it is cleaned, standardized, and examined to identify patterns. Key techniques involve:
- Sentiment analysis and text analytics (to understand emotions in open feedback)
- Journey mapping and funnel analysis (to spot where customers drop off or get frustrated)
- Predictive modeling and machine learning (to forecast customer churn, identify at-risk customers, or recommend next-best actions)
- Root-cause analysis (to link experience issues directly to business outcomes)
Data is often segmented by demographics, products, or issues to reveal targeted insights, such as why certain user groups abandon carts.
3. Insight generation & visualization
Data has limited value if it stays buried in spreadsheets. In this stage, customer experience analytics turns CX data into clear, visual insights through interactive dashboards that map the entire customer journey.
These dashboards bring together heatmaps, trend reports, and alerts to surface high-impact issues. For example, they may reveal that 40% of mobile checkout abandonments occur on a single screen due to slow loading.
AI-driven capabilities add another layer by generating automated summaries, triggering real-time alerts when customer sentiment declines, and predicting risks such as customer churn. Together, this helps teams move faster from interpretation to focused action.
Use VWO Copilot to quickly analyze large volumes of user data across heatmaps and session recordings, turning complex behavior patterns into clear, actionable insights.
4. Action & continuous improvement
This phase emphasizes cross-team collaboration through centralized hubs, automated reporting, and closed-loop feedback to measure impact and iterate over time.
Insights are fed back to teams across marketing, product, service, and CX to drive meaningful changes, such as redesigning a confusing webpage, training agents on recurring issues, or personalizing offers.
The impact is then measured through closed-loop feedback, ensuring a cycle of continuous improvement in customer satisfaction rather than one-time fixes.
How can you effectively use customer experience analytics?
Customer experience analytics is most effective when applied to real business questions. High-performing teams use CX analytics to diagnose specific experience problems and guide targeted improvements across the customer journey. Here are some of the most common and effective use cases:
1. Identify friction across the customer journey
CX analytics helps teams spot friction points that interrupt the user journey, such as confusing navigation, slow-loading pages, repeated support interactions, multi-channel switching, or in-app hesitations (e.g., rage clicks or form abandons).
By combining behavioral data across touchpoints with effort signals, teams can pinpoint exactly where customers struggle and why, enabling data-driven fixes that address the root cause of user frustration.
2. Personalize experiences for customer segments
By layering behavioral patterns, purchase history, usage data, lifecycle stage, and preferences onto segmentation models, teams can tailor interactions dynamically across channels (web, app, support, email).
Effective use of customer insights ensures that recommendations and messaging feel relevant and personal (e.g., a first-time visitor to your mobile app sees content tailored to them, while a loyal customer sees content tailored to their loyalty), fostering deeper customer relationships and increasing customer lifetime value.
3. Experimentation and testing
The most effective way to use cx analytics is to treat every insight as a hypothesis. Once the data highlights a problem, high-performing teams use experimentation to validate the fix. Whether it’s improving customer satisfaction by testing a new checkout flow or experimenting with different onboarding variations to reduce customer churn, testing ensures your changes actually drive revenue growth.
By running A/B tests on the actionable data you’ve gathered, you remove the risk of making “improvements” that don’t actually move the needle.
Top KPIs and metrics for customer experience analytics (CX)
To truly master customer experience analytics, you need to look beyond vanity metrics like page views. By tracking the metrics below, you can measure customer satisfaction objectively and focus on the improvements that matter most.
1. Core CX metrics
These capture how customers feel about their experience, typically through surveys.
Net Promoter Score (NPS)
Net Promoter Score (NPS) measures how likely customers are to recommend your brand, making it a key indicator of customer loyalty. Higher scores signal strong advocacy, while lower scores highlight experience issues that need attention.
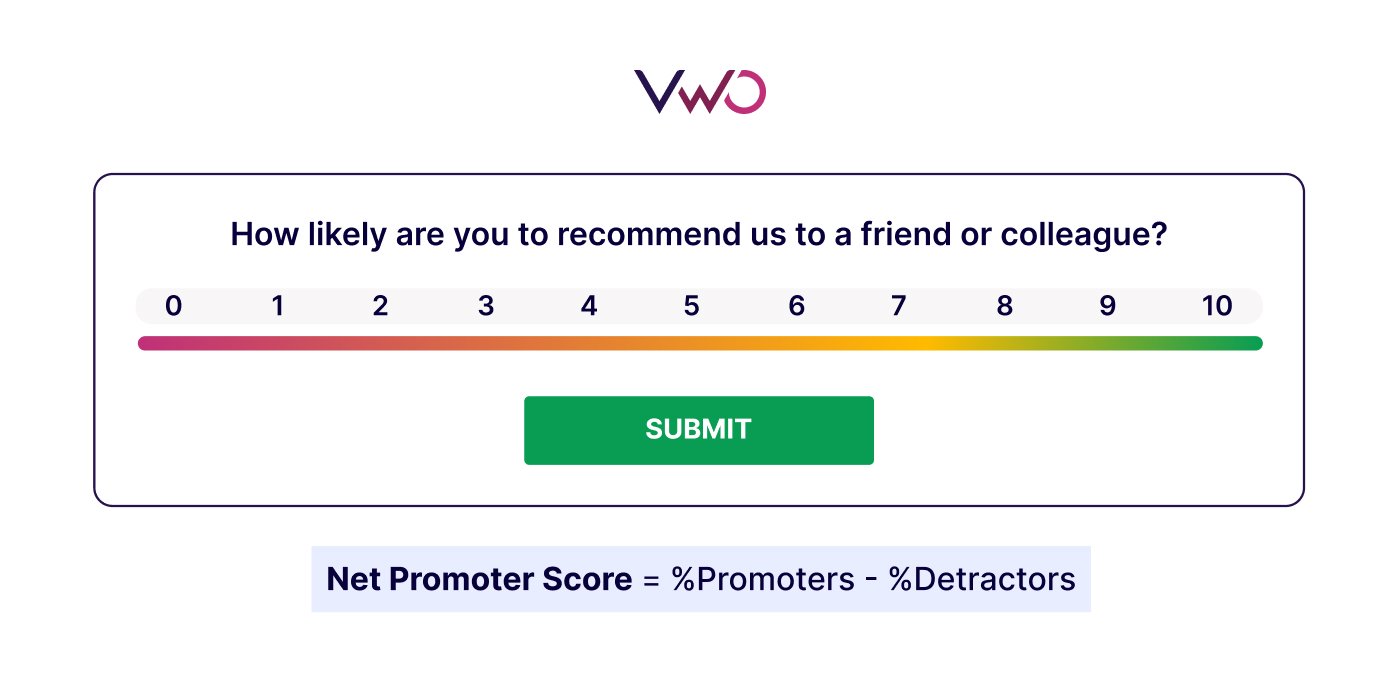
Learn here practical strategies to increase your Net Promoter Score through better customer experiences.
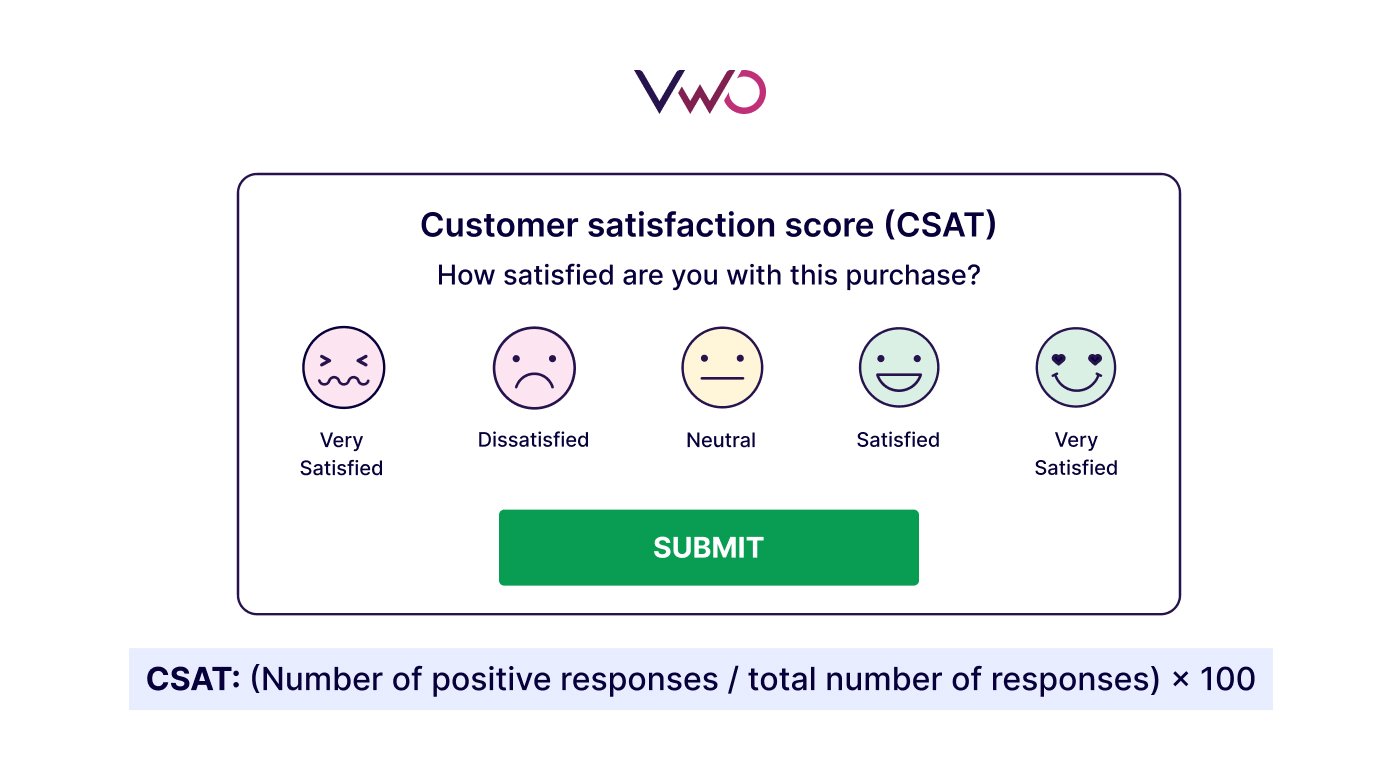
Customer Satisfaction Score (CSAT)
CSAT is measured by collecting customer feedback immediately after an interaction. It’s perfect for evaluating the quality of great customer service or a specific new feature.
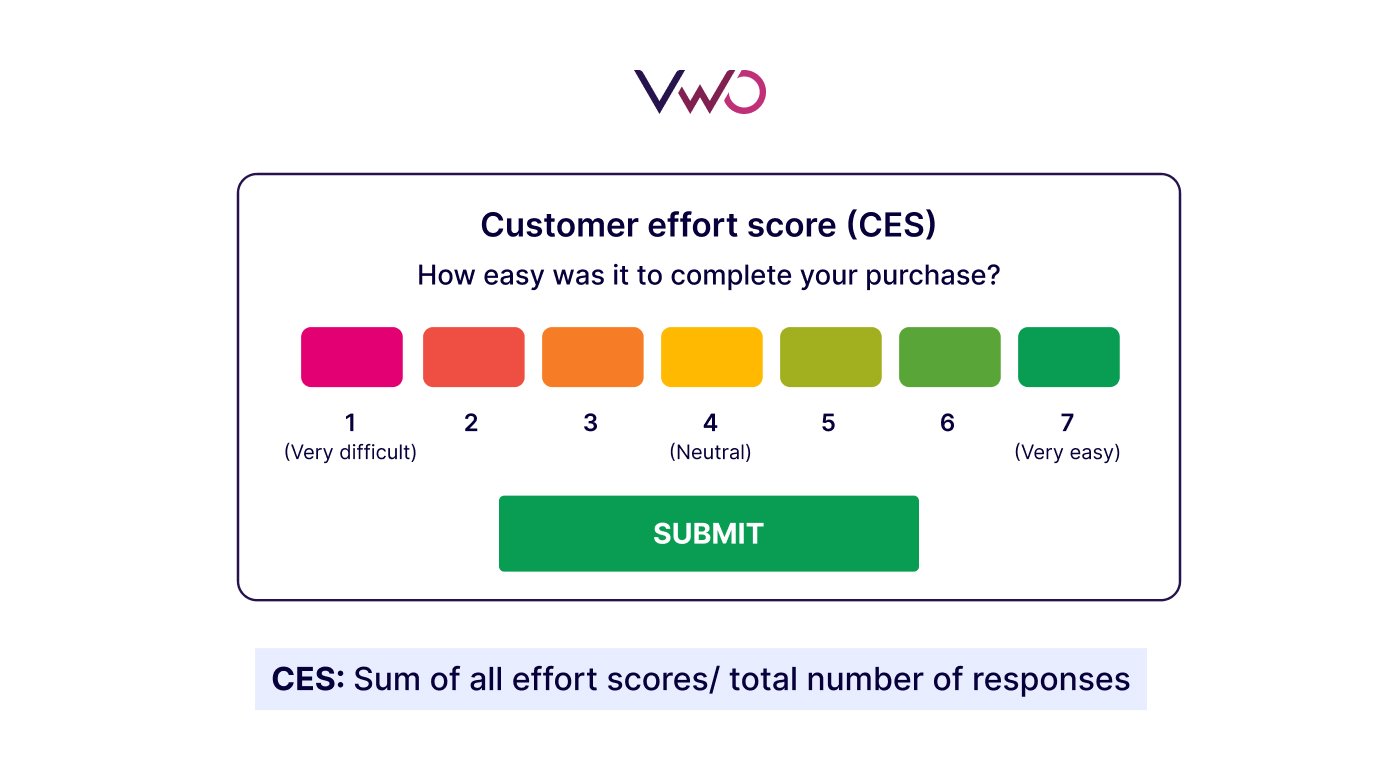
Customer Effort Score (CES)
This measures the effort a user must exert to complete a task, such as making a purchase, returning an item, or signing up. A high customer effort score is one of the strongest predictors of customer churn.
2. Retention and outcome metrics
These reflect the long-term impact of the entire customer journey on the bottom line.
Customer churn rate
Measures the percentage of customers who stop using your product or service. Rising churn typically highlights problems in customer experience, value delivery, or support quality.
Retention rate
Shows the proportion of customers who remain active or continue purchasing over a given period. It reflects how well an experience delivers ongoing value and is especially critical for subscription businesses, where recurring revenue depends on keeping existing customers engaged.
CLV
Predicts the total revenue a business can expect from a single account. Improving the entire customer journey naturally extends the customer lifetime, boosting this metric.
Conversion rate
Indicates the percentage of users who complete a desired action (e.g., a purchase or sign-up). This is the ultimate metric for measuring the success of experimentation and UI changes.
3. Support and service experience metrics
Commonly tracked within the contact center to evaluate service-related customer touchpoints.
First Contact Resolution (FCR)
The percentage of issues resolved in a single interaction. High FCR indicates efficient processes and well-equipped support teams. It reduces repeat interactions, lowers customer effort, and supports higher satisfaction and retention.
Average Response Time (ART)
Measures the average duration of a support transaction across channels such as email, chat, or messaging. Faster response times reflect more attentive service, while delays often increase frustration and reduce CSAT.
4. Additional metrics
Beyond primary KPIs, these additional metrics help surface deeper behavioral and emotional insights across the customer journey.
Drop-off or abandonment rate
Measures the percentage of users who enter a conversion funnel but exit before completing the desired action. It helps identify the exact stage, such as checkout or onboarding, where users abandon the journey.
Customer sentiment score
A customer sentiment score quantifies the emotional tone (a customer’s positive, neutral, or negative response) of interactions using text or speech analysis. Scores often range from 0 to 100, where higher values indicate more positive sentiment. The final score is calculated by analyzing and weighting positive and negative expressions within the interaction.
Examples of CX Analytics
Seeing customer experience analytics in action makes its value tangible. Below are real examples of how brands apply CX analytics to drive measurable outcomes.
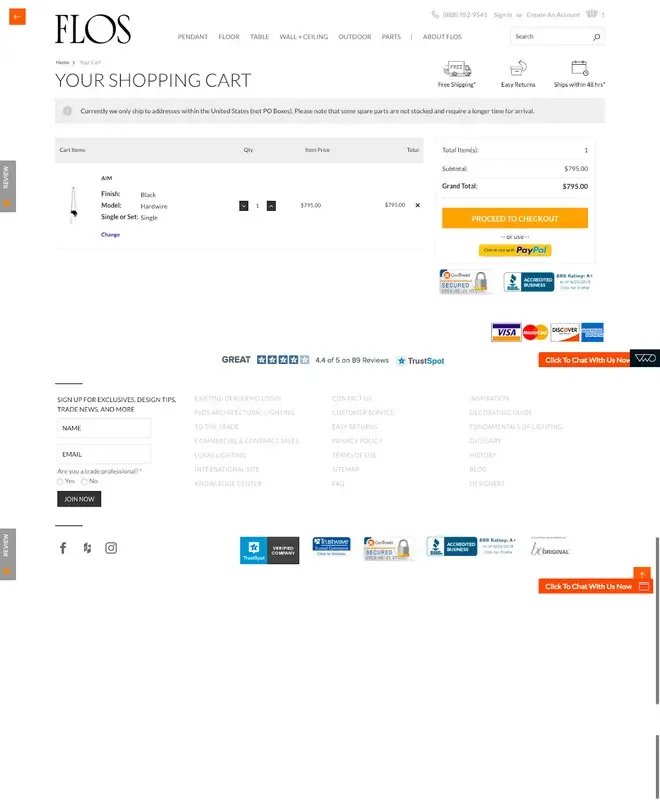
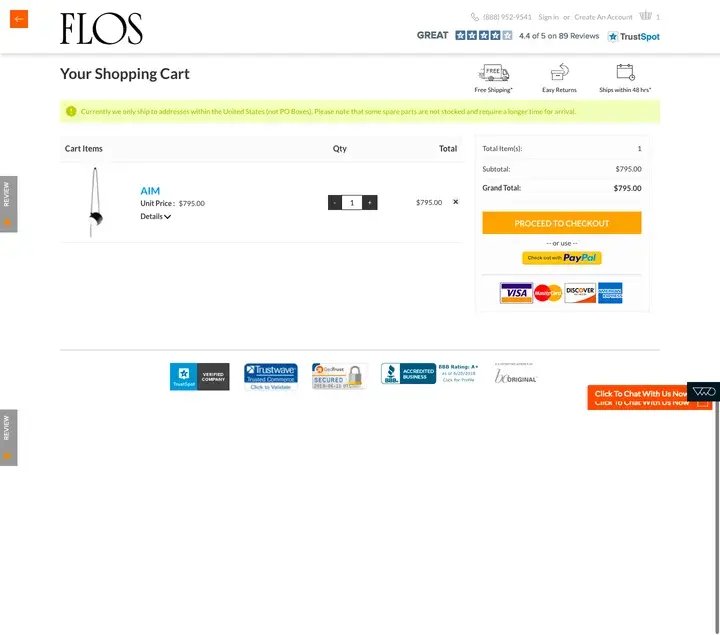
1. eCommerce: Eliminating hidden friction (FLOS USA)
High-end lighting retailer FLOS USA wanted to address persistently low checkout conversion rates on its eCommerce store, despite strong product demand.
- Insight: Experience analytics (web analytics, heatmaps, scrollmaps, session recordings) revealed friction at multiple stages of the journey, from homepage navigation to clarity issues on product, cart, and checkout pages, leading users to drop off before completing purchases.
- Action: The team ran targeted A/B tests across the entire funnel to reduce friction and improve clarity at each step.
- Result: The experiment led to a 125% increase in checkout conversions, proving that identifying patterns in user behavior is only the first step; testing the fix is what drives the win.
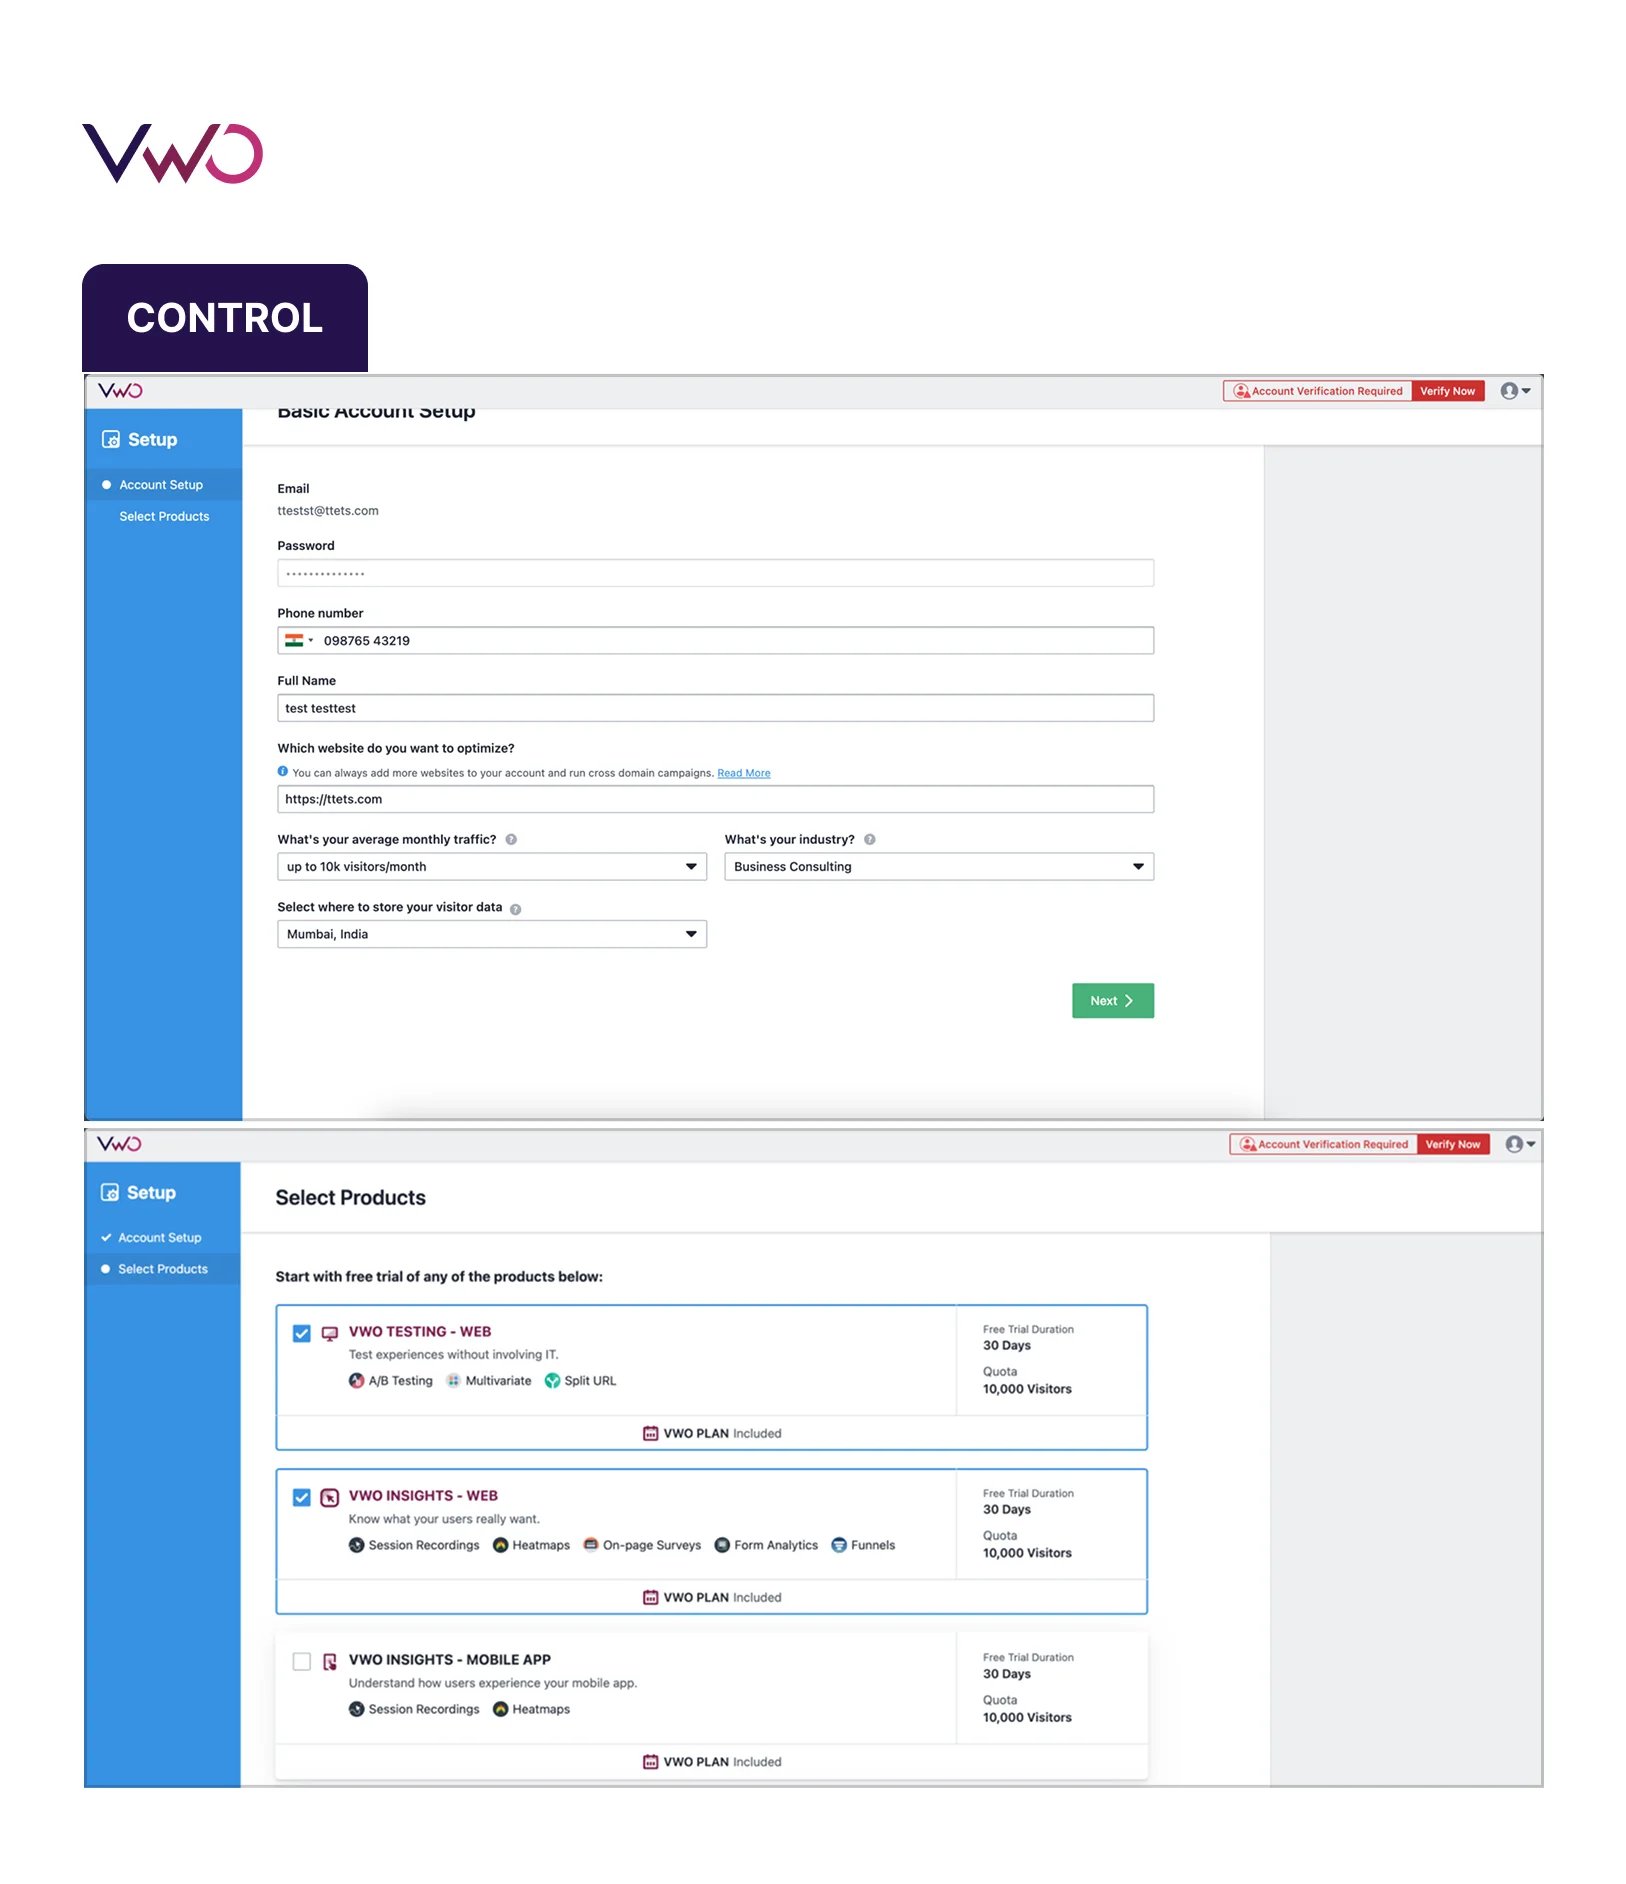
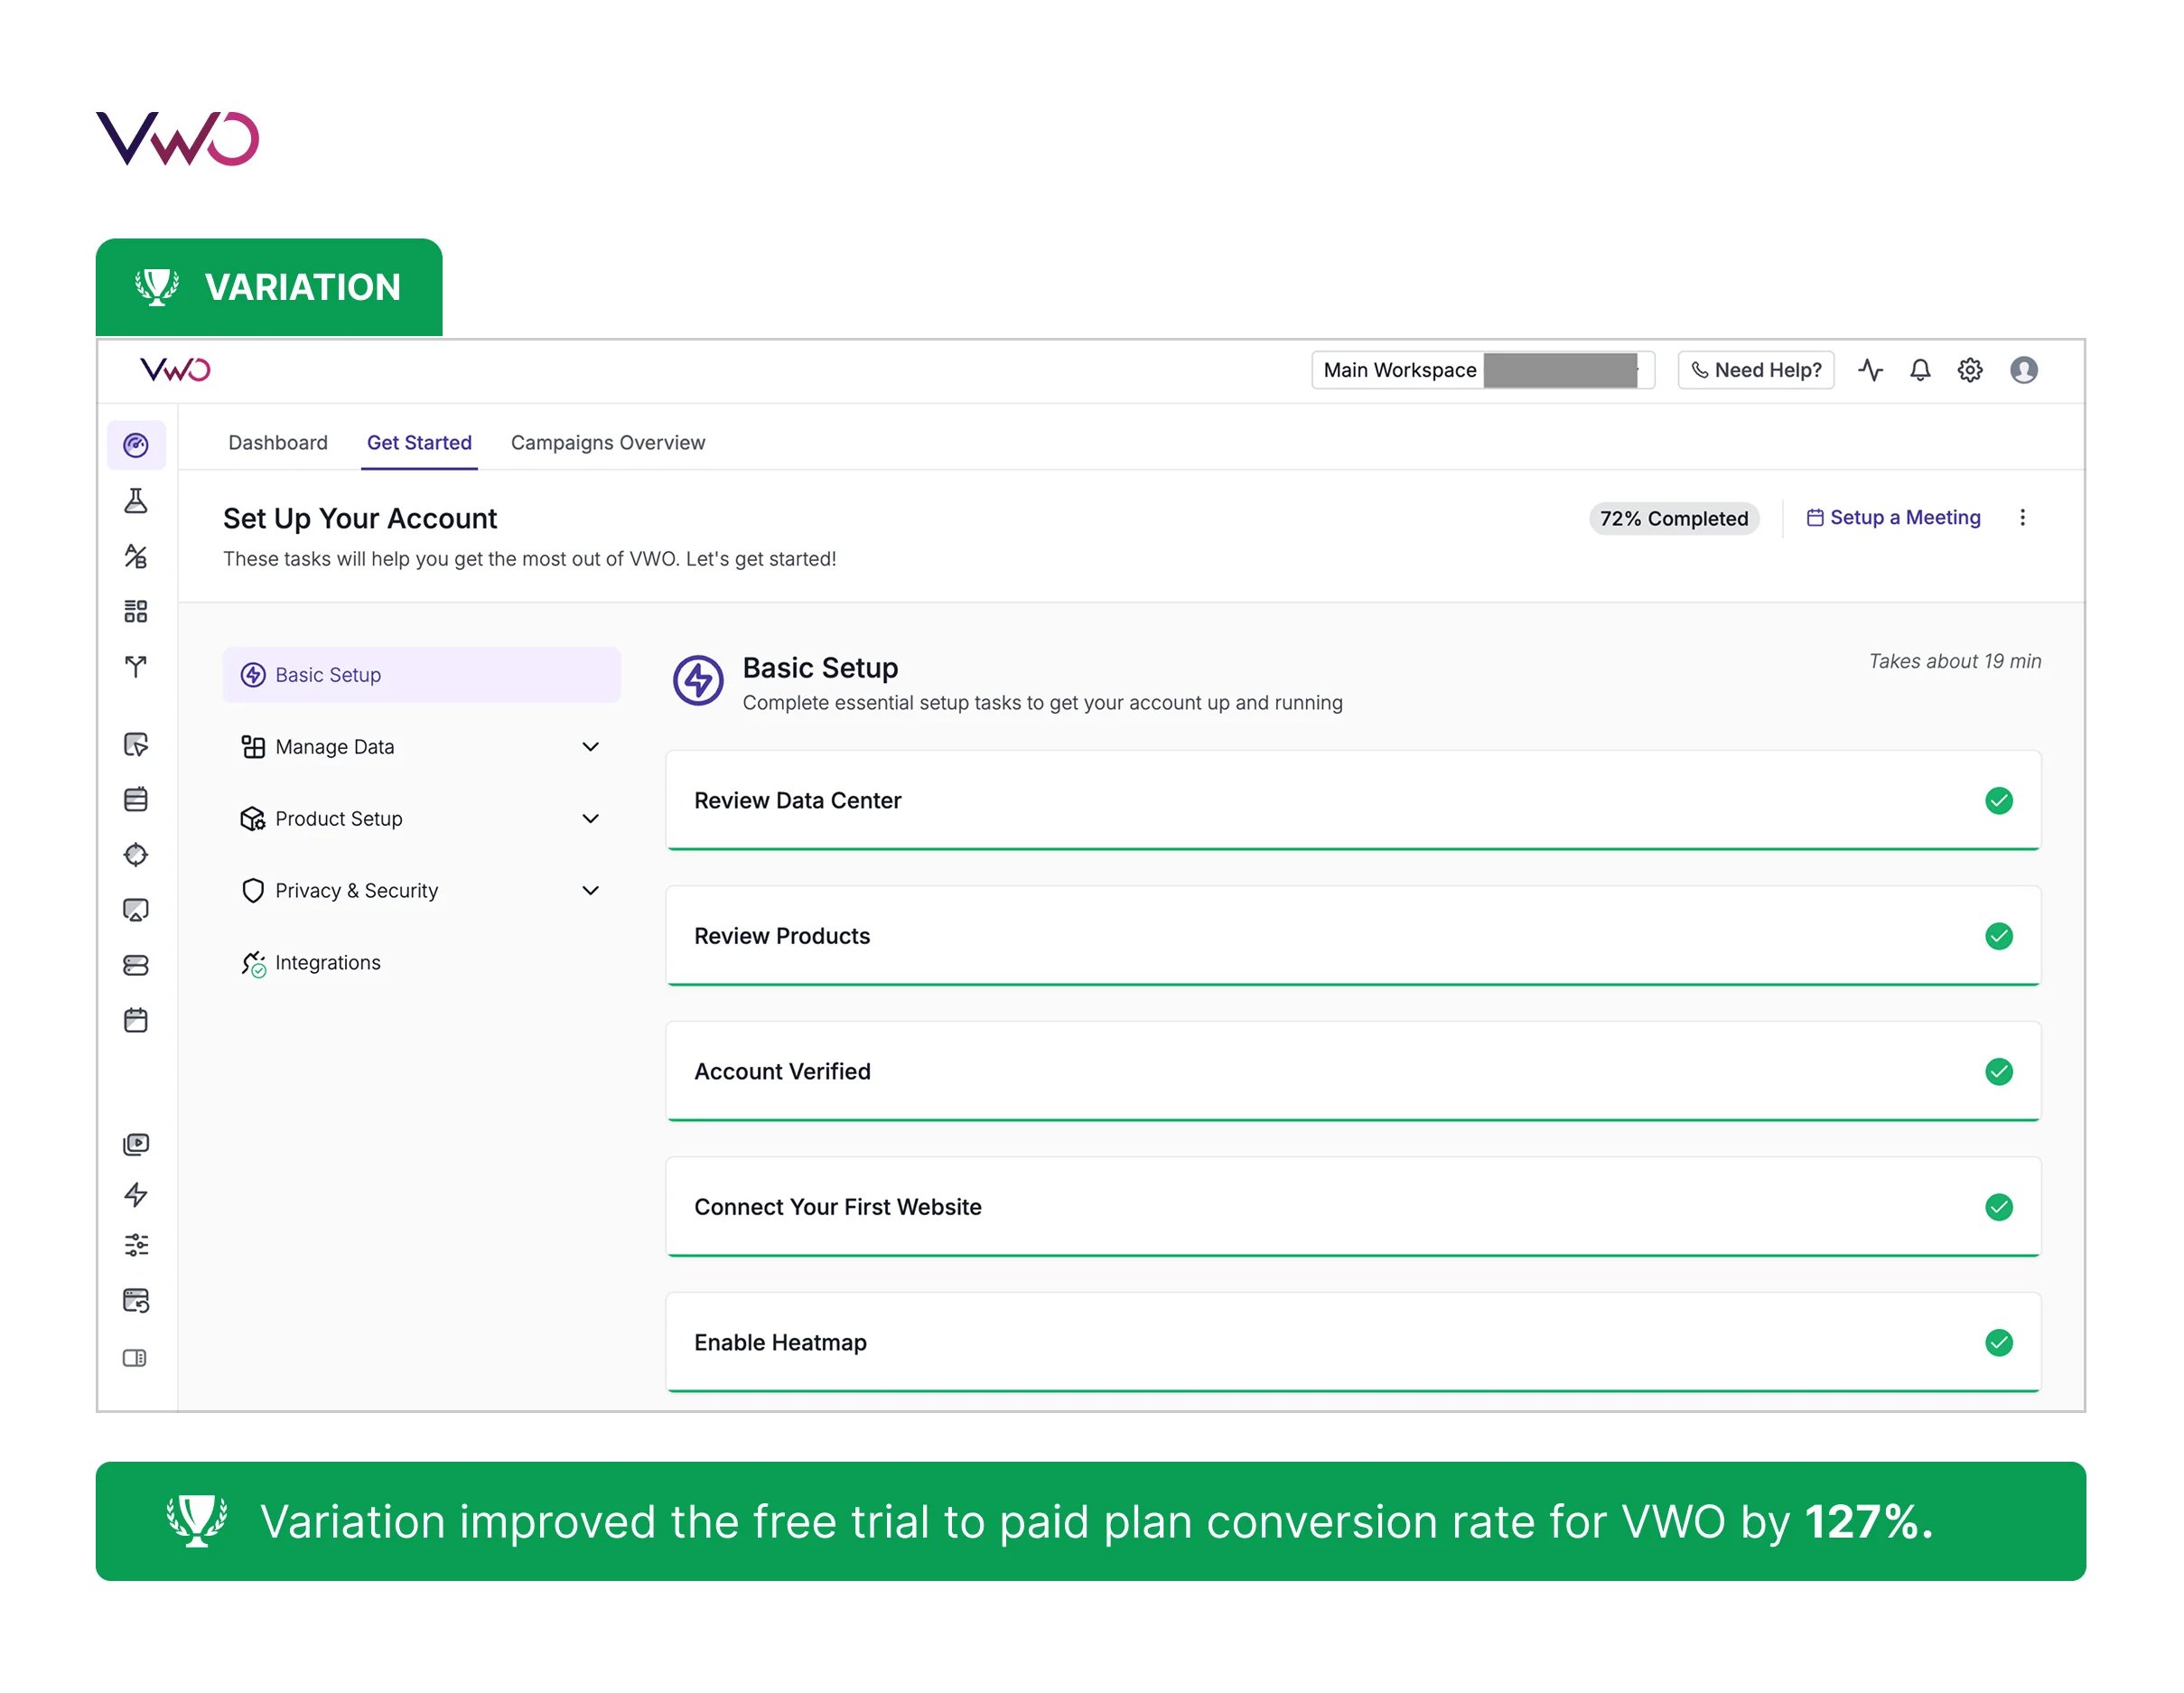
2. SaaS: Optimizing onboarding (VWO)
Even experts use their own tools! VWO used its platform to simplify a previously complex onboarding experience, transforming it into a structured flow that supported user activation and feature adoption.
- Insight: VWO Insights (behavior analytics – form analytics, metric reports, heatmaps, session recordings) revealed that onboarding was fragmented and unclear. Users struggled to understand the next steps, leading to high drop-off during setup and low feature adoption early in the trial.
- Action: The team tested a centralized “Get Started” tab with a clear, step-by-step checklist to guide users through account setup, product configuration, and feature discovery.
- Result: The improved onboarding experience led to a 127% increase in free-trial-to-paid conversions, validating that reducing friction and guiding users effectively during early journeys directly impact activation and revenue.
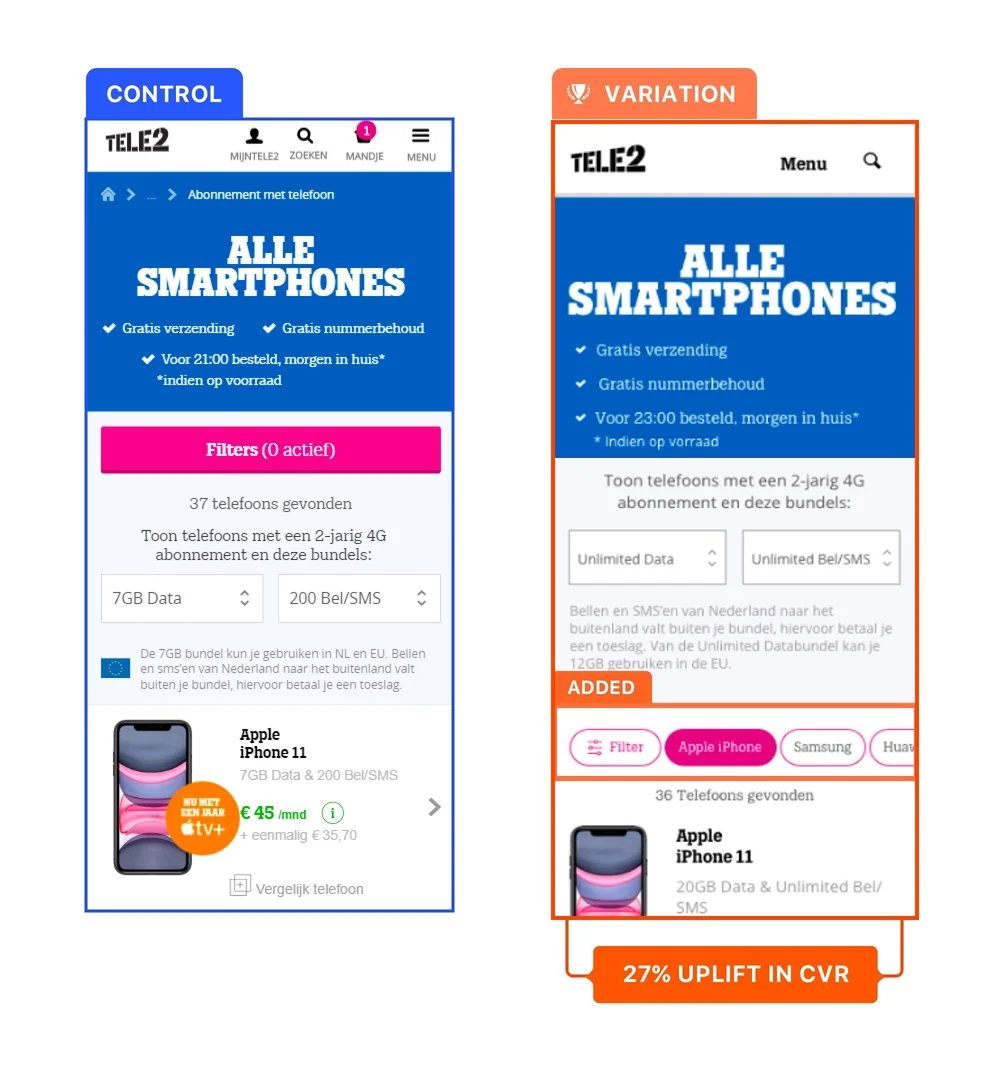
3. Subscription: Simplifying complex choices (Tele2)
Telecom giant Tele2 wanted to increase mobile subscription renewals on its product listing pages. Despite strong demand, renewal conversions were declining, signaling friction in the browsing and decision-making experience.
- Insight: Customer journey analysis (user tests, web analytics data, research, etc.) revealed that users manually scrolled through long device lists rather than using filters, increasing effort and slowing decision-making.
- Action: The team tested a redesigned smartphone overview page with prominent brand filters next to the general filter, using A/B testing to validate the change.
- Result: The simplified variation led to higher filter usage drove a 27% uplift in subscription renewals, proving that reducing friction through experimentation can significantly improve conversion outcomes.
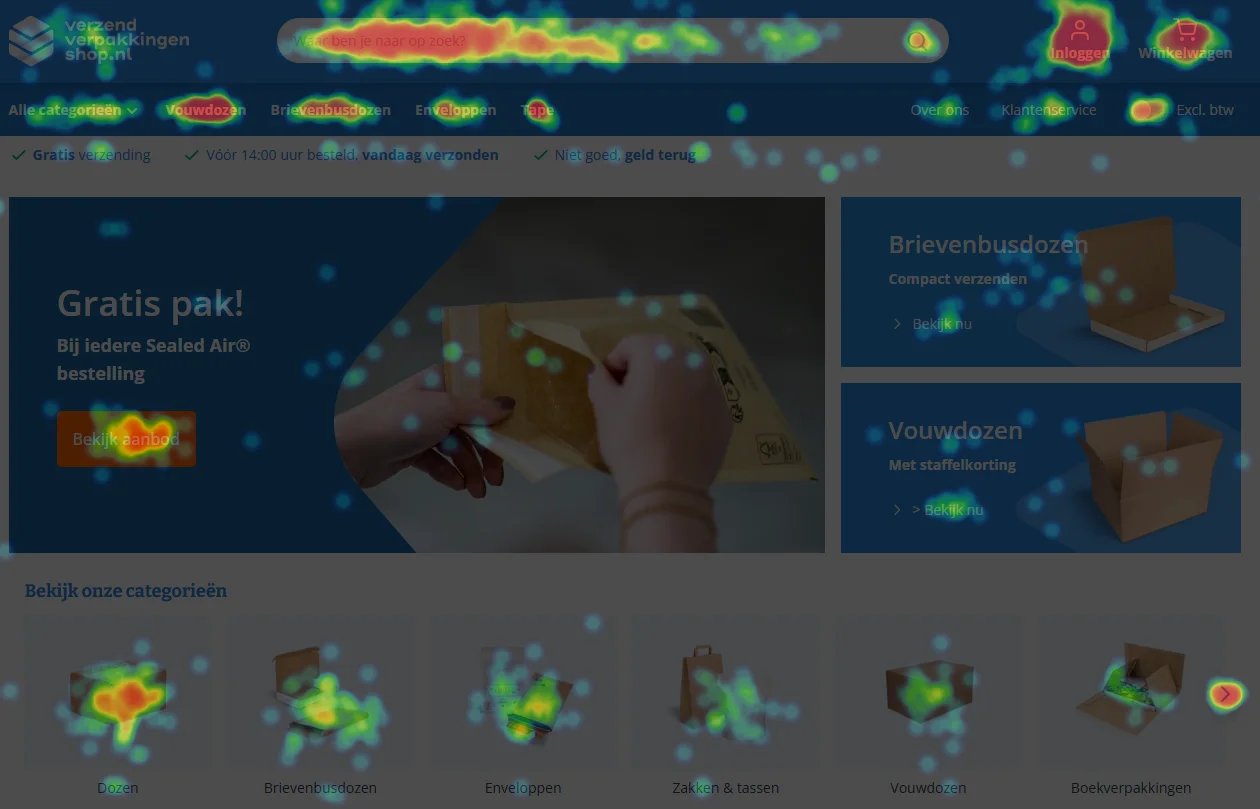
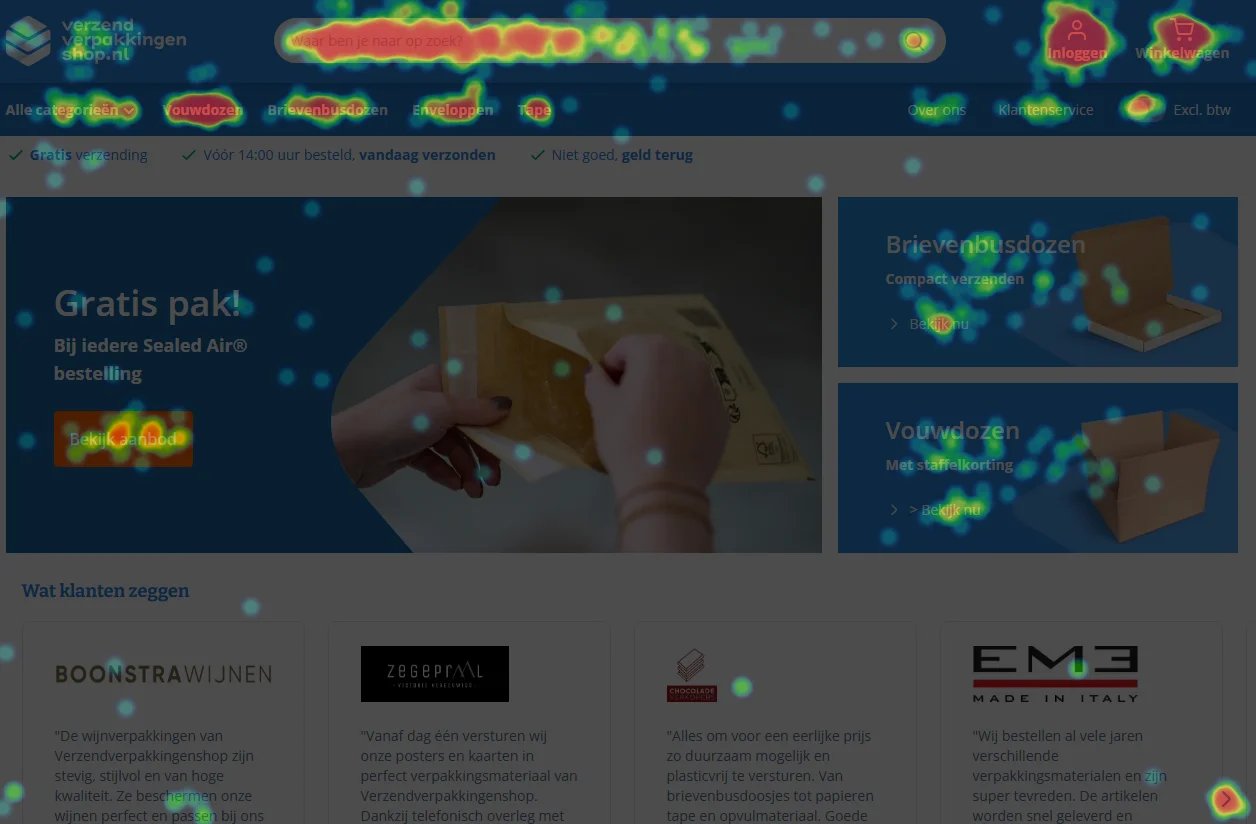
4. Service: Deep-dive user journey analysis (Bunzl)
Global distribution specialist Bunzl Retail & Industry wanted to improve eCommerce conversions on its packaging website but lacked clear visibility into user behavior throughout the journey.
- Insight: User journey analysis revealed two key friction points: a cluttered homepage navigation that caused decision fatigue, and checkout hesitation driven by low trust signals at the final funnel step.
- Action: Using behavioral data from VWO Insights, the team formed data-backed hypotheses and ran A/B tests to simplify homepage navigation by replacing category clutter with customer reviews and adding trust signals directly in the shopping cart.
- Result: These targeted, evidence-led changes delivered a 9% uplift in total sales, along with higher product page visits and increased checkout click-throughs, proving the impact of journey-focused CX analytics and experimentation.
5. Mobile: Enhancing the small-screen experience (Elegant Steps)
UK-based wedding footwear retailer Elegant Steps sought to improve mobile conversions after noticing a significant performance gap between desktop and mobile users.
- Insight: CX analysis (GA Data, VWO scrollmaps and heatmaps) showed that mobile users struggled to engage with key elements; important sections appeared too far down the page; core USPs like free shipping were hidden below the fold; and poor text contrast reduced readability.
- Action: The team tested a redesigned mobile homepage that surfaced the “Shop by Brand” section earlier, highlighted free shipping above the fold, improved text visibility, and updated CTA copy to feel more personal, all validated through targeted A/B testing on mobile users.
- Result: The optimized mobile experience delivered a 200% increase in mobile conversions and almost 50% drop in bounce rates, proving the impact of mobile-focused analytics and experimentation.


Conclusion: How VWO powers customer experience
Customer experience analytics only creates value when insights lead to measurable improvements. VWO enables this full cycle: from understanding behavior to validating changes, within a single, connected platform.
Behavior analytics
VWO Insights helps teams understand how users actually experience a website.
- Heatmaps: reveal where users engage, or disengage
- Session recordings: let you recreate individual journeys to spot frustrations like “rage clicks.”
- Form analytics: Pinpoint friction in forms (skipped/refilled fields, time spent, drop-offs) to streamline lead capture and boost completions.
- Funnels: Track step-by-step journeys, monitor conversion rates, and link drop-offs to recordings/heatmaps for precise fixes.
Use the VWO Insights dashboard to view visitor behavior across your site in one place, turn clicks, drop-offs, and feedback into clear visual insights, and prioritize fixes that reduce friction and improve conversions. The Experience Overview section also provides an overall experience score (out of 100) that reflects key friction indicators and performance trends over time.
Voice of the customer
While behavioral tools show what users do, VWO Pulse helps you understand why they do it. Use VWO Pulse to gather CSAT and NPS feedback via surveys that seamlessly align with your product’s look and feel. Trigger surveys based on user actions and context to capture relevant feedback at key moments.
Further, with VWO Copilot, you can:
- Generate goal-focused survey questions
- Summarize feedback and get recommendations
By combining Pulse with behavioral data, businesses connect customer sentiment directly to optimization efforts.
Delivering relevant experiences
VWO Personalize enables brands to tailor content, messaging, and offers based on visitor behavior, device, lifecycle stage, or previous interactions. Whether recognizing returning users or adjusting experiences for mobile-first audiences, personalization ensures that insights translate into relevance, strengthening engagement and deepening customer relationships without creating operational complexity.
Dive deeper into VWO Personalize to understand how to build, target, and optimize tailored experiences at scale.
Validating improvements
VWO Testing empowers teams to turn hypotheses into measurable outcomes through structured experimentation. From A/B tests to multivariate and split URL experiments, teams can test experience changes before full rollout, reducing risk and ensuring improvements drive measurable gains in conversion, retention, and revenue. Learn about the different types of testing in VWO and when to use each to maximize impact.
Request a demo to explore how VWO enables continuous, evidence-based customer experience optimization at scale.
FAQs
To drive value, companies must move beyond reporting and turn insights into action. This means:
1. Identifying friction across the customer journey
2. Forming data-backed hypotheses
3. Testing improvements through experimentation
4. Measuring impact on key metrics like retention, satisfaction, and conversion.
Value comes from continuous optimization, not one-time analysis.
Companies use analytics to understand how customers interact across touchpoints, where they struggle, and what influences their decisions. By combining behavioral data, customer feedback, segmentation, and testing, teams can personalize experiences, remove friction, and validate changes that improve engagement and loyalty.
Real-time analytics allow you to optimize the experience while the user is still on your site:
1. Triggered engagements: Deploying an on-page survey or a specific discount code the moment a user shows “exit intent” on a checkout page.
2. Continuous optimization: Using real-time heatmaps to see how a new homepage banner is performing within hours of launch, allowing for immediate adjustments.
3. Instant risk mitigation: Receiving automated alerts when customer sentiment drops or technical error rates spike, enabling your team to intervene before churn occurs.


![10 Best Product Management Tools [2026]](https://static.wingify.com/gcp/uploads/sites/3/2025/01/Feature-image-10-Best-Product-Management-Tools-2025.jpg?tr=h-600)


