What goes into making a good landing page?
From design and copy to load speed and CTA placement, several factors are at play when a user decides to either engage with the page or bounce.
Also, businesses must adapt to evolving trends and innovations that shape user behavior.
To help you out, we’ve compiled a list of 40+ must-know landing page statistics that reveal what’s working and what needs to be avoided.
Take a look at these crucial stats and explore ways to optimize your landing pages for better conversions.

5 landing page statistics on effectiveness
1. The top 10% of landing pages receive almost 80% of traffic
Source: WordStream
2. Dynamic landing pages are known to convert 25.2% more mobile users
Source: Keywords Everywhere
3. Around 48% of marketers create a new landing page for new marketing campaigns, while 52% of them reuse the same landing page for different campaigns
Source: WordStream
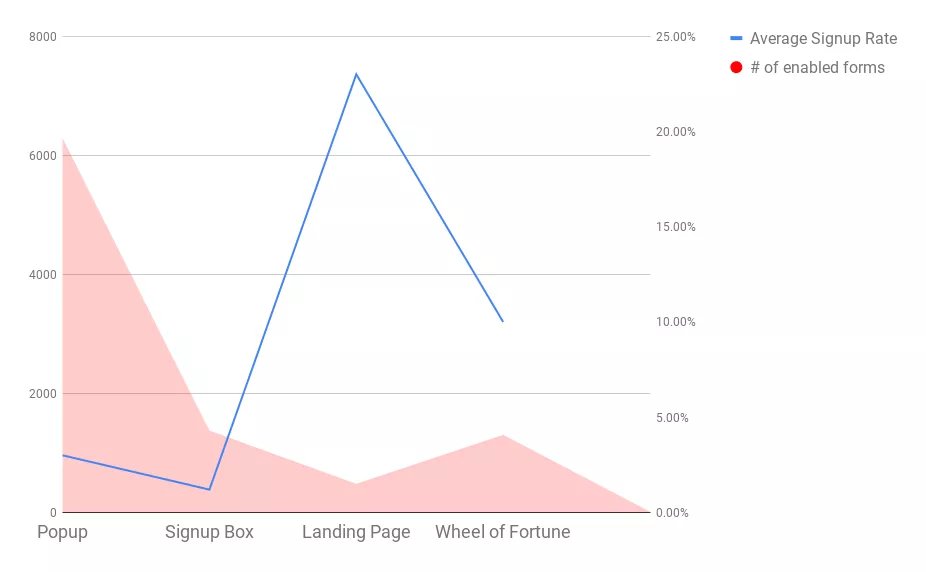
4. Landing pages have a signup rate of 23%, however, they account for just 5.1% of all signup forms
5. 67% of marketers say data about landing page conversions provide key insights into the success of their B2B content
Source: Keywords Everywhere
10 landing page statistics on conversion rate
6. For landing pages across all industries, the median conversion rate is 6.6%
Source: Unbounce
7. B2C landing pages have a conversion rate of 9.87%, while for B2B landing pages it is 13.28%
Source: Wishpond
8. Increasing the number of landing pages from 10 to 15 can boost conversions by 55%
Source: HubSpot
9. Landing pages with 5 or more links have a conversion rate of 10.5%, as compared to 13.5% for pages having just one link
Source: ZoomInfo
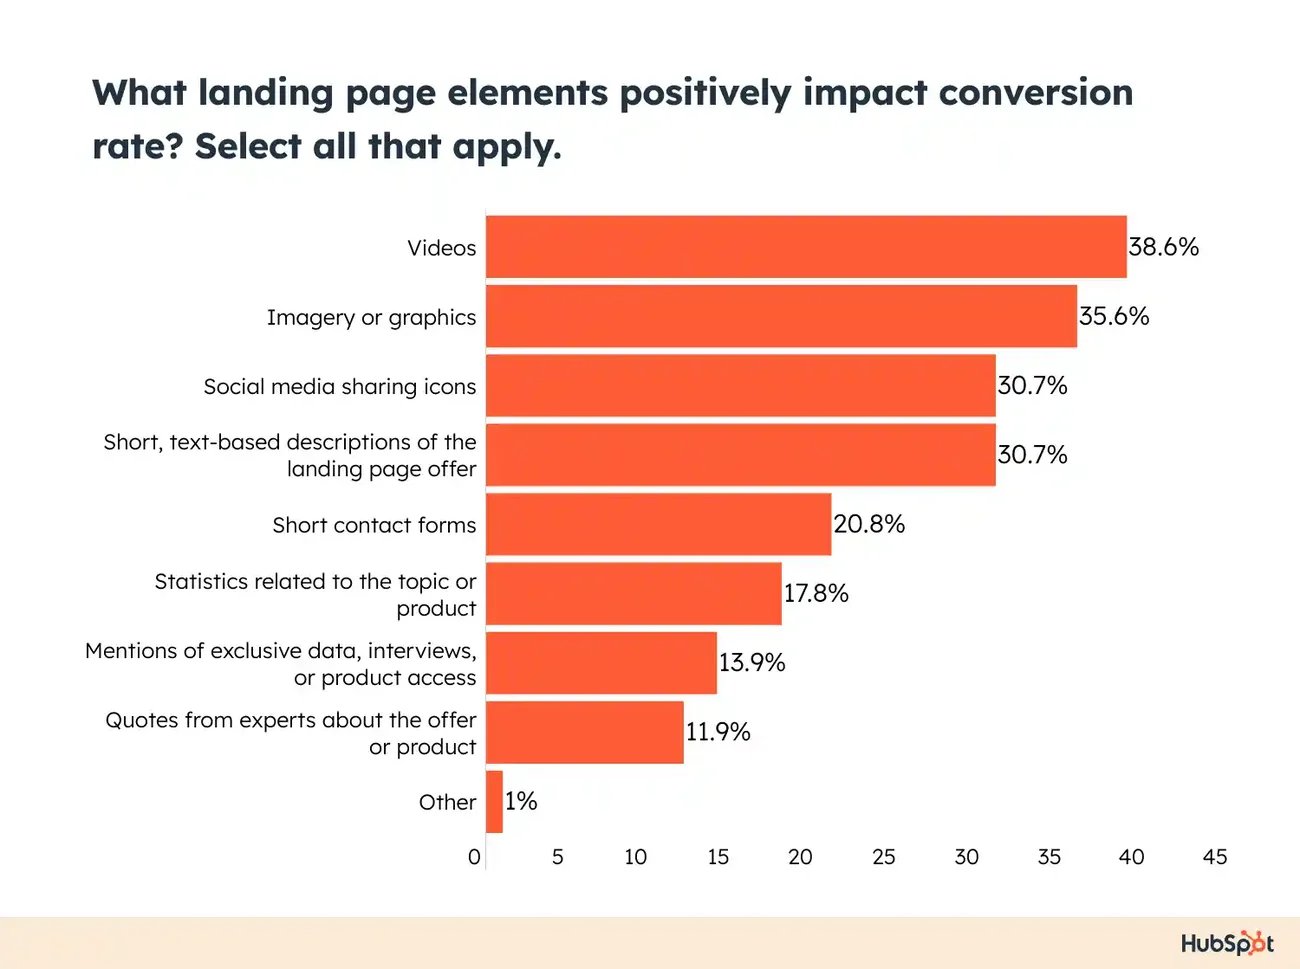
10. Around 38% of marketers say video is the top element that positively impacts landing page conversions, while around 35% say images and graphics are the best elements to do so
11. Visitors who arrive on a landing page via email convert 60% more than those coming from paid social
Source: Unbounce
12. Including multiple offers on a landing page can negatively impact conversions by 266%
Source: CXL
13. 30% of the top landing pages contain video content. Adding a video on your landing page can increase conversions by up to 86%
Source: Think With Google, Smart Insights
14. Mobile-responsive landing pages have a conversion rate of 11.7%, while desktop-only landing pages have a conversion rate of 10.7%
Source: Unbounce (via Medium)
15. WikiJob’s landing page conversions increased by 34% after adding a customer testimonial
Source: VWO Success Story
6 landing page statistics on user experience
16. The average bounce rate for landing pages lies between 70% to 90%
Source: Quick Sprout
17. In the business sector, landing pages having less than 1000 words achieve 50% higher conversion rates than pages with 500+ words
Source: Unbounce (via Medium)
18. Google Chrome lists Cumulative Layout Shift (CLS) as a crucial page ranking factor.
When a visible element on a page changes its position from one rendered frame to the next, it is considered to be a layout shift. CLS measures the visual stability of a page by tracking such unexpected shifts. Google recommends aiming for a CLS score of 0.1 or less to ensure a good user experience and increase search engine visibility.

19. 33% of navigational links displayed on landing pages lead visitors away from the page to social media platforms
Source: WordStream
20. Around 30% of brands say they plan to use website heatmaps and user behavior analytics to improve landing page conversions
Source: Databox
21. ForestView increased form conversions by 20.45% after replacing a long list of products with carousels
Source: VWO Success Story
The messaging on your landing page should align perfectly with the promise made in the ad, email, or link that led visitors there. Understand your audience’s expectations and craft a landing page that delivers exactly what they want. This consistency between channels meets their needs and lays the foundation for a better experience.
5 landing page statistics on performance
22. More than 40% of marketers list lead generation as the primary goal for a landing page
Source: HubSpot
23. About 73% of landing pages feature human faces in the hero section, aiming to grab attention and convey emotion
Source: ChartMogul
24. Personalized CTA elements perform 202% better than regular ones
Source: HubSpot
25. Around 48% of visitors leave a landing page without engaging with any of the marketing collaterals on the page
Source: Gartner
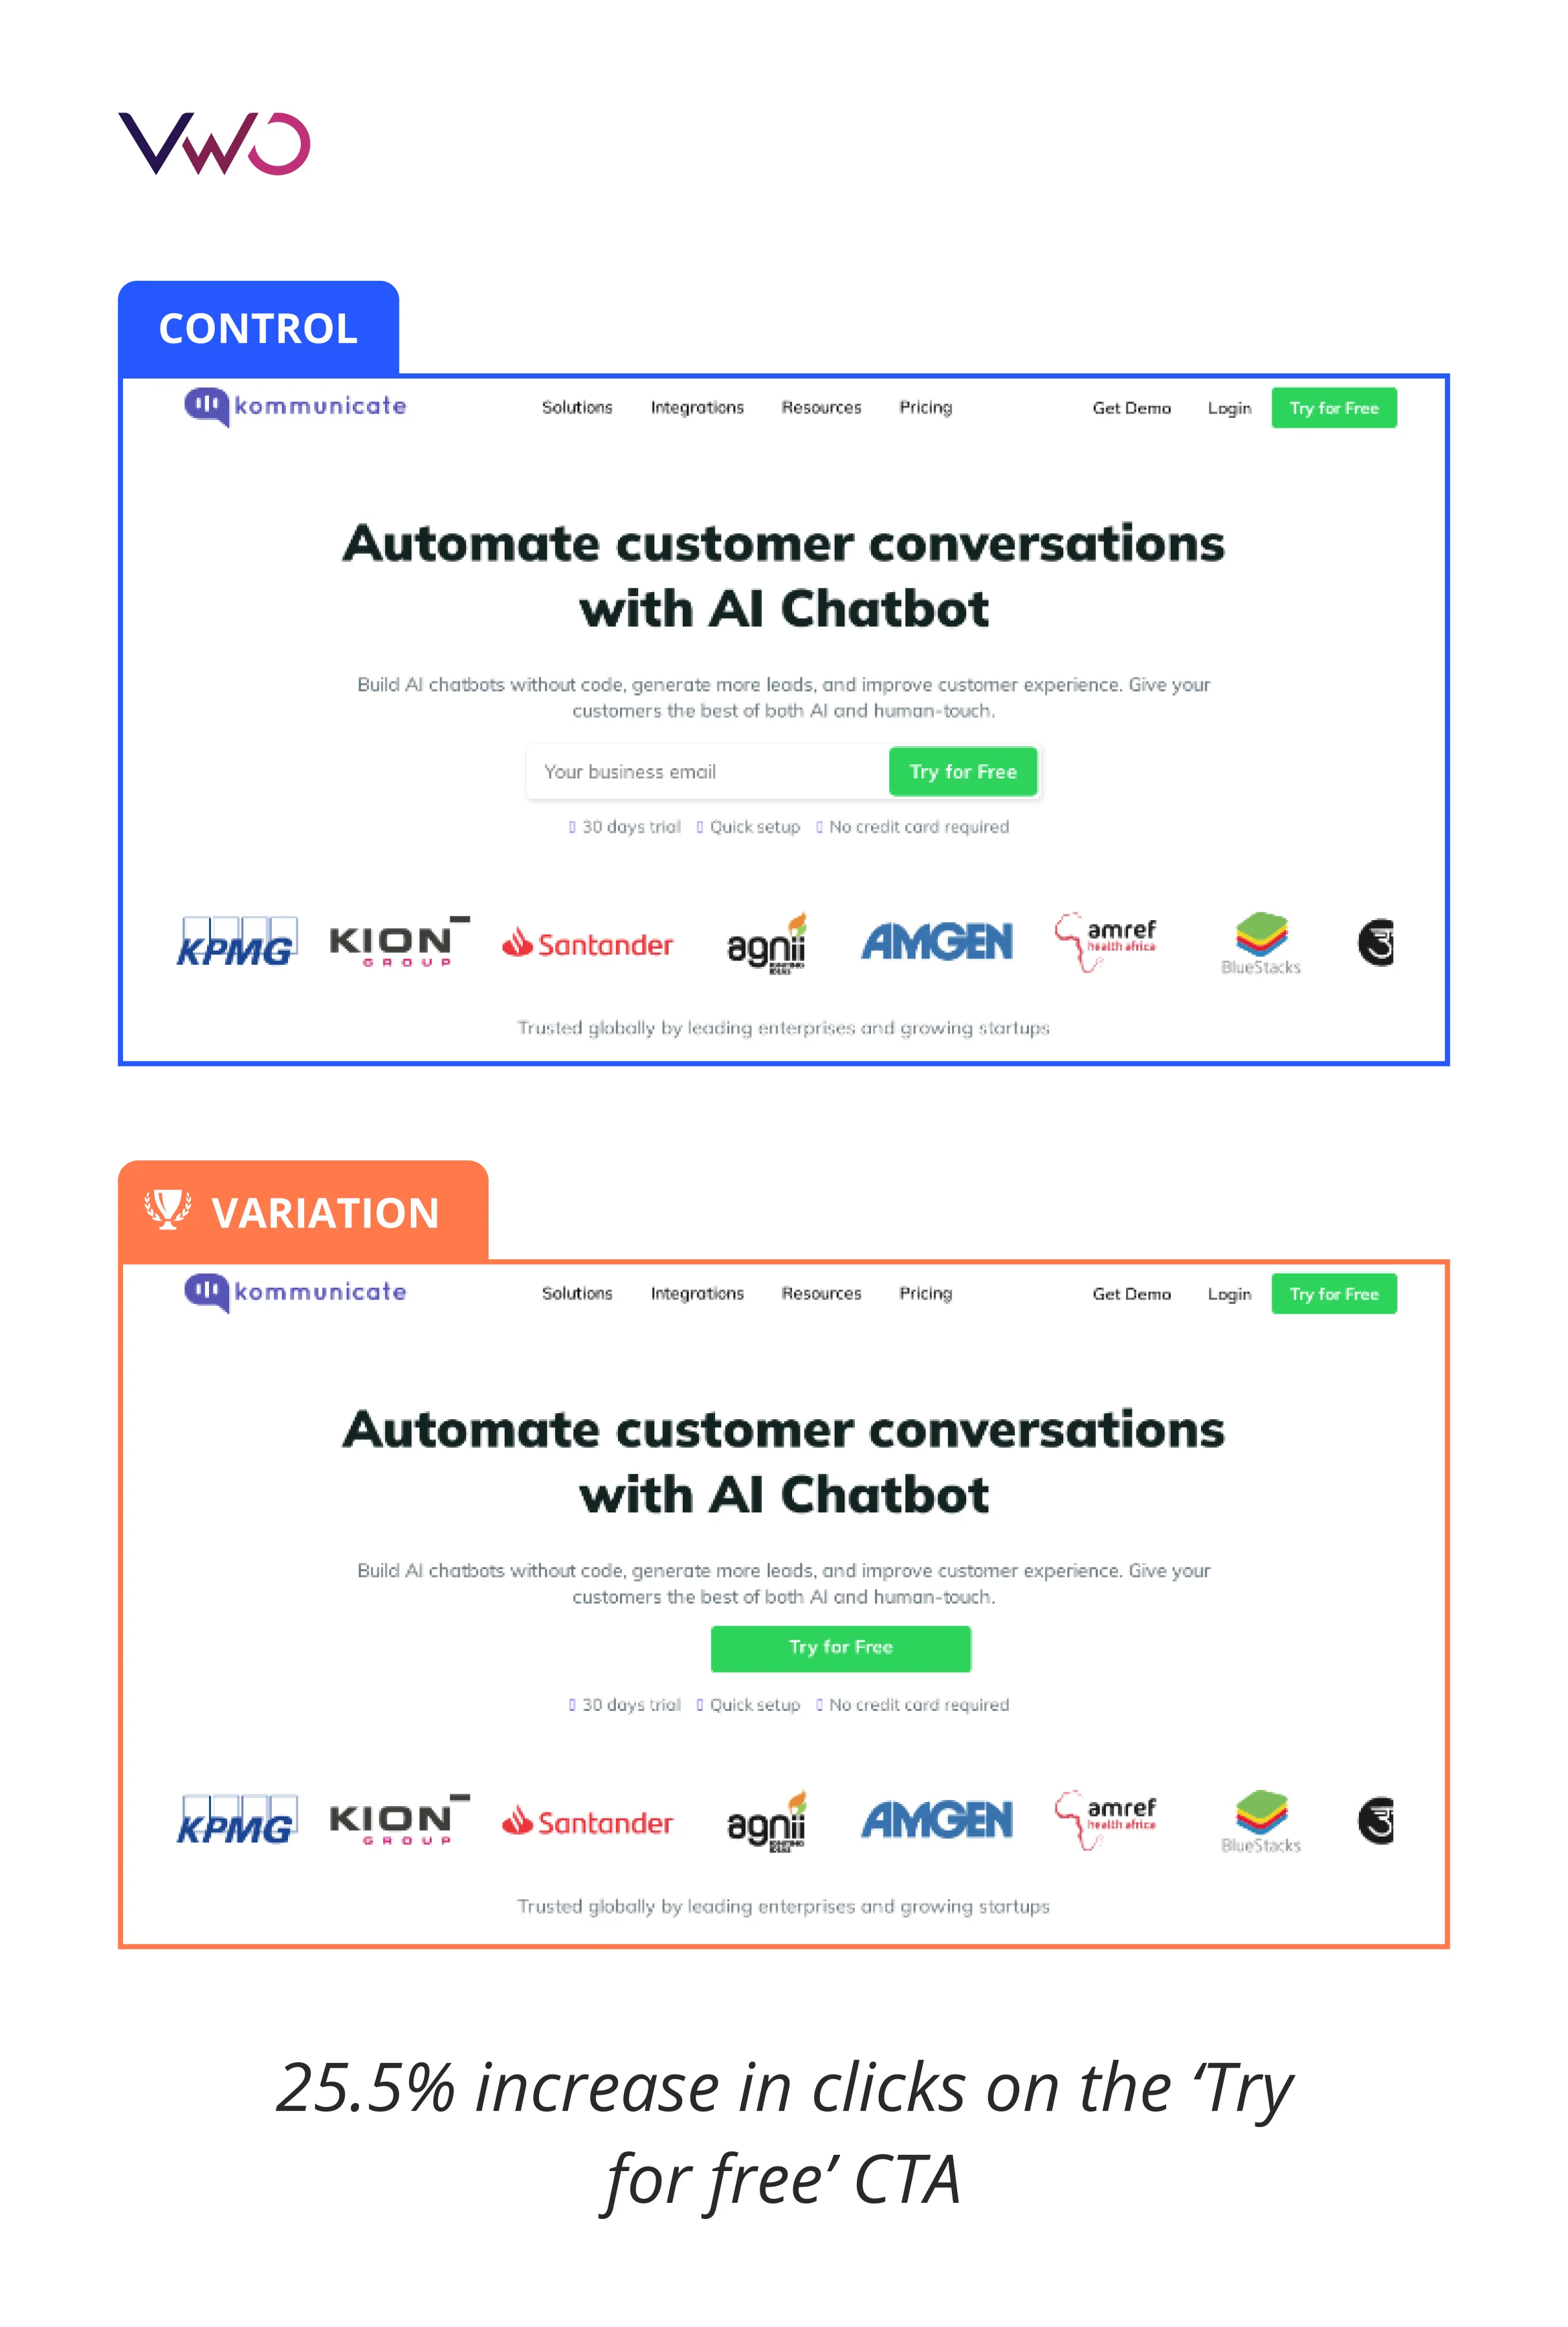
26. Kommunicate registered a 25.2% increase in clicks on a free trial button by removing the only form field on a page
5 landing page copy statistics
27. There is a negative correlation of 24.3% between difficult words and conversion rates
Having too many difficult words (3 or more syllables) on a landing page may lead to lower conversions.
Source: Unbounce
28. In the SaaS industry, a landing page having simple, easy-to-read copy converts 514% better than a difficult-to-read copy
Additionally, SaaS landing pages with a word count of 250 to 725 see better conversions, with a median conversion rate of 3.8%.
Source: Unbounce
29. For an eCommerce landing page to achieve a conversion rate of 4.2% or higher, it should have a word count of 285 to 930 words
Also, to maintain this conversion rate, eCommerce sites need to have around 50 to 125 difficult words on a landing page.

30. Landing pages written at a 5th to 7th-grade level convert 56% higher than pages written at 8th to 9th-grade level
However, the opposite is true for the entertainment industry where pages written at a 10th-grade or higher level have better conversions.
Source: Unbounce
31. Locations Hawaii saw a 22.97% increase in conversions by changing the CTA copy from ‘Inquire’ to ‘Contact Agent’
Source: VWO Success Story
6 Statistics for Landing Page Design
32. About 58% of landing pages showcase clickable graphics relevant to the content
Source: Taboola
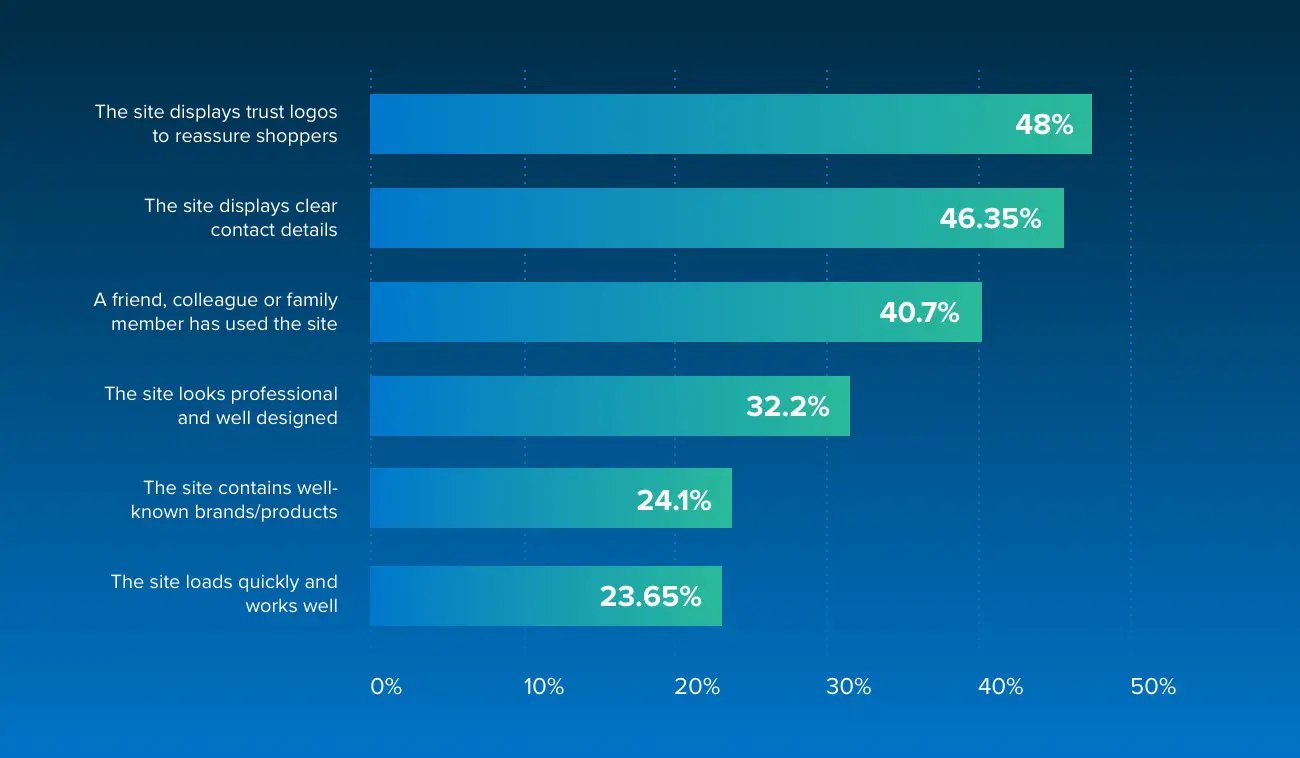
33. Around 48% of users mention that trust logos and security badges reassure them of a site’s safety
34. 86% of the top-performing landing pages are optimized for mobile
Source: Nifty Marketing
35. Images with people in them have a 66% higher CTR than those with objects
Source: Taboola
36. Using colors can improve brand recognition by up to 80% and increase comprehension by 73%
Source: Xerox
37. A truck driving school saw a 161% uplift in form submissions after replacing a stock image with an image of an actual student from their academy
Source: VWO Success Story
7 general statistics for landing pages
38. Around 48% of the top-performing landing pages are featured in maps and organic listings on search engines like Google
Source: Nifty Marketing
39. Landing pages with webinar promotions have an average conversion rate of 22.3%
Source: GetResponse
40. In a recent global survey, 27% of marketing decision-makers reported using automation to streamline the creation and optimization of landing pages
Source: Statista
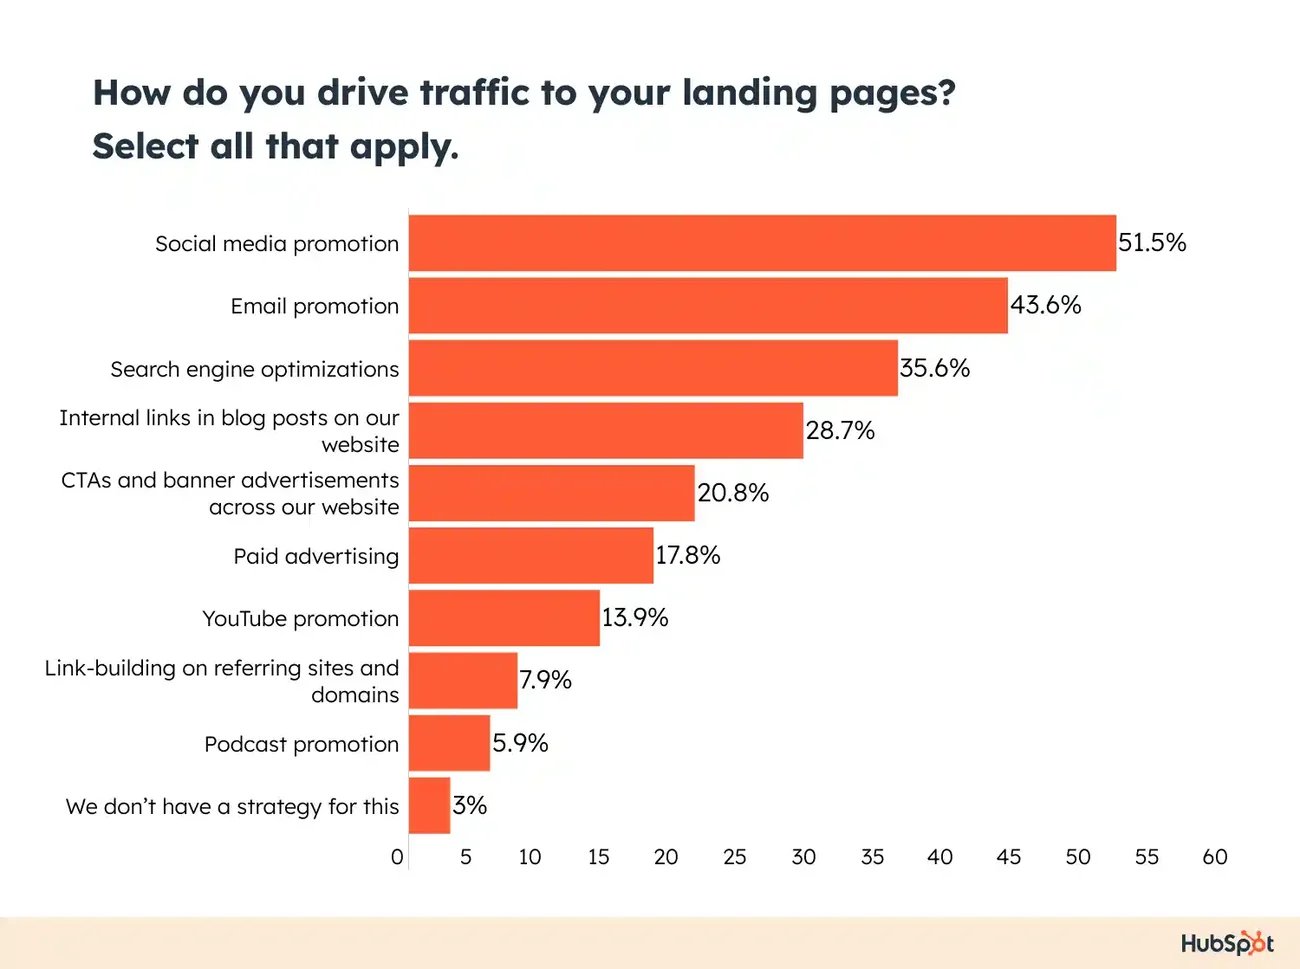
41. More than 50% of marketers reported using social media to drive traffic to landing pages
Email marketing, SEO, and paid ads are the other top mediums that marketers use to drive traffic.
42. For 42% of SaaS landing pages, the primary goal is to book product demos or consultations
Source: Unbounce
43. More than 75% of marketers do not use social proof on landing pages
Source: Unbounce (via Medium)
44. AssessmentDay saw a 62% uplift in conversions after removing FAQs from their landing page
Source: VWO Success Story
Final thoughts
Although these landing page stats and insights provide valuable direction, you must go beyond industry benchmarks and averages.
By conducting user research and analyzing how users interact with your pages – what captures their attention, what drives them to click, and what causes them to leave – you can craft personalized experiences that resonate on a deeper level.
Take a free trial or request a demo to try out VWO’s features and capabilities that enable you to manage your entire optimization program in one place.



![7 Best Sales Funnel Software for Every Business in 2026 [Backed by Expert Reviews]](https://static.wingify.com/gcp/uploads/sites/3/2025/01/Feature-image-7-Essential-Sales-Funnel-Software-for-Every-Business_-Top-Picks-for-Every-Purpose.jpg?tr=h-600)
![7 Top Landing Page Optimization Tools for 2026 [Ranked by Marketers]](https://static.wingify.com/gcp/uploads/sites/3/2024/10/Feature-image-Top-7-Landing-Page-Optimization-Tools-1.jpg?tr=h-600)

![How to Build High-Converting Landing Pages [With Examples]](https://static.wingify.com/gcp/uploads/sites/3/2021/01/Feature-image_How-to-Build-High-Converting-Landing-Pages.png?tr=h-600)
