

Conversion rate computation is a common practice when it comes to monitoring performance in businesses. If you want to determine how many leads have converted, you simply divide the total number of conversions by the total number of leads. This approach works well when conversions take place within a short time (a few hours). However, when conversions take place after a significant delay of days, weeks, or even months, how do you ensure that you’re computing your conversion rate correctly?

Download Free: Improve Conversions In 60 Days Guide
The problem with delayed conversions
When the conversion is delayed, visits are labeled as non-conversions without sufficient observation allocated to them. Suppose you care about the lead-to-purchase rate of an expensive product. You may get thousands of leads for that product; however, a purchase can take several days or weeks from the day of the customer’s first visit. So if a visitor is marked non-converted after her initial visit, it will lead to a highly reduced conversion rate, which is misleading.
To make VWO reporting more insightful, our data science team took on the challenge of developing a strategy for looking at conversion rate appropriately in experiments where conversions happen after a significant delay. In this article, I will share our learnings from this exercise, and towards the end, I will also share why we didn’t pursue it further.
The standard approach of computing conversion rate
We analyzed a test with delayed conversions that ran on our platform. Following are the stats of the campaign that ran on VWO –
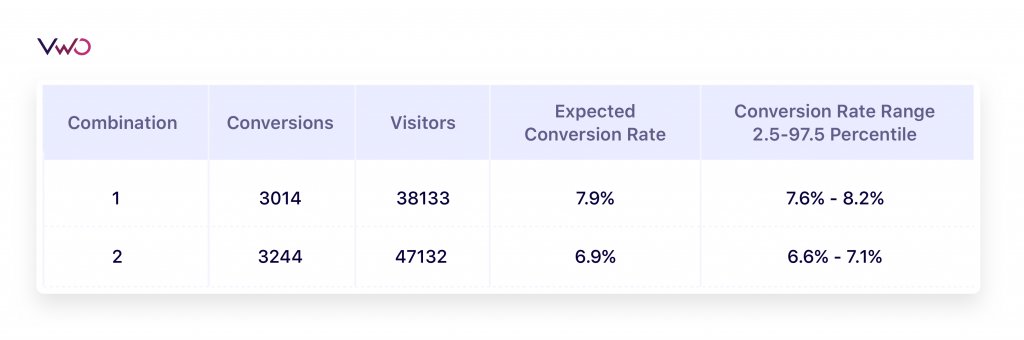
To compute the expected conversion rate, we can simply divide total conversions by the total number of visitors. Also, by using an appropriate Bayesian or Frequentist methodology, we can further obtain uncertainty in its estimation. But what if some conversions happen after a delay? How do these estimates get impacted?
To understand this, let’s observe how the distribution of time to convert in each variation looks.
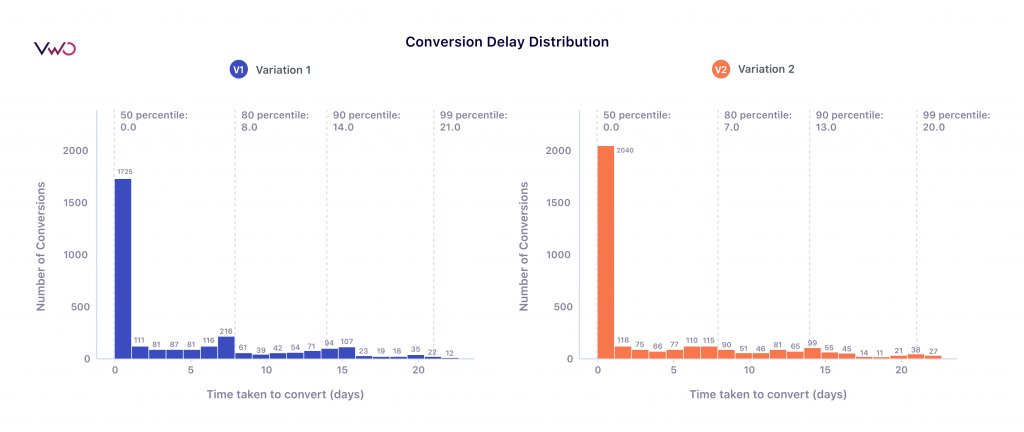
From the plot, we can see that while most conversions are happening within a day, some visitors take up to 22 days to convert. If not provided sufficient observation time, several conversions will get marked as non-conversions. To understand the impact of this, let’s look at the daily conversion-rate plot –
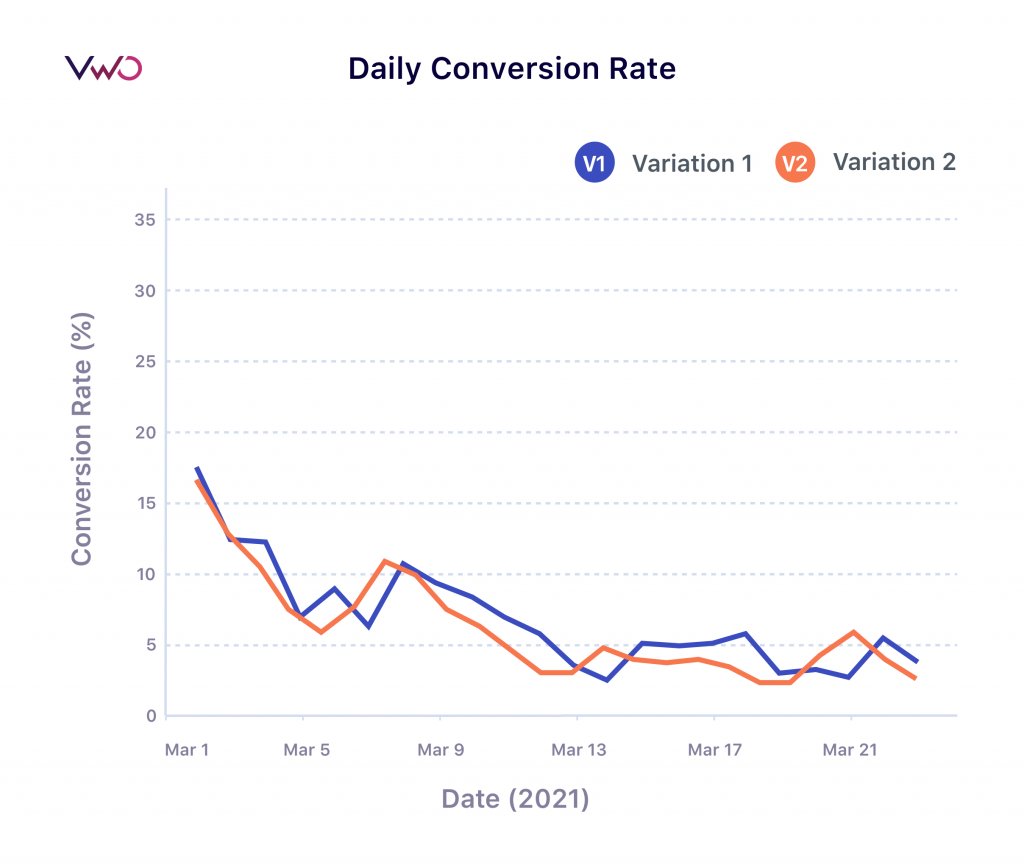
From the plot, it looks like the conversion rate decreases with time. Does that mean visitors in the later days of the test have less tendency to convert than those in the start? Not really. We didn’t give users arriving in a later stage sufficient time to convert and labeled them as non-conversion; hence the observed conversion rate started decreasing.
So what can be done about this?
Easy solution – choose a fixed cool-off period during which a visitor will not be considered in conversion rate computation. This way, we can control incorrectly labeled non-conversions. With this approach, however, we will not be able to utilize the information available to us about the conversions that happened in the cool-off period and we won’t know the conversion rates of the cool-off period. Also, it could be tough to come up with an appropriate threshold for a cool-off period in many situations.
Download Free: Improve Conversions In 60 Days Guide
Why does delayed conversion analysis matter in an A/B test?
If conversions happen right after the visits, there is no issue in looking at the standard conversion rates. However, the problem arises when there is a delay and the objective is to find a variation that provides:
- Early conversions – Suppose you wish to promote a festive sale with your homepage banner and you are looking for a variation that gets you more clicks on it at the earliest. Here the objective is to find a banner that could grab the attention and entice users to click it immediately.
- Long-term conversions – Suppose you are a personal loan finance company and you wish to test two loan provisioning strategies where each strategy has its own unique features. Here conversions could take several days to happen, and you want to find a strategy that has the potential to give you higher conversions in the long term.
Now imagine you compute conversion rate using the standard approach; in that case, you are likely to miss out on the objectives mentioned above, where time to convert is a metric of great importance for decision making.
Estimating conversion rate as a function of time
To deal with delayed conversions, we explored Survival Analysis, which is known for analyzing time until one or more events happen. Using Kaplan–Meier estimation, a non-parametric technique to estimate survival rate, we can calculate conversion rates more formally.
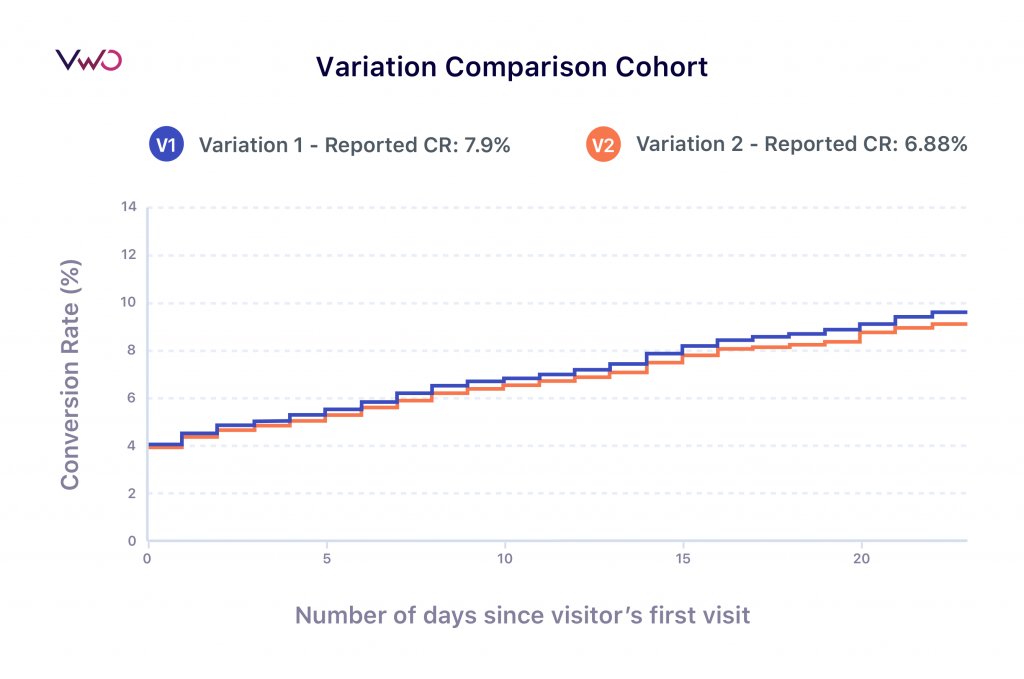
In this graph, the x-axis shows how much time has passed since visitors became a part of the test, and the y-axis shows the conversion rate. So, in Variation 1, the conversion rate of visitors that have got 23 days to convert in the test shows a conversion rate of 9.57%, and visitors that only had three days show a conversion rate of 5.03%.
By looking at conversion rate as a function of time, we can understand the conversion behavior of visitors towards a variation. This curve is monotonically increasing by nature.
Let me now explain how to interpret this curve. Suppose 1000 visitors become part of the test today; then the above plot says that if I observe them for 23 days, by the end of the 23rd day, 95 of them will convert.
The cohort plot is essentially an A/B test where a variation compares to other variations at different times. Using Kaplan–Meier, we can also obtain the uncertainty bounds on conversion rate over time, representing the beliefs over estimates based on the observed data.
Estimating behavior change of visitors towards a variation
By extending the above approach, we can also compare how within a variation conversion behavior of early visitors who became part of the test is different from those who participated in later stages. No change in behavior would mean an overlap of all curves.
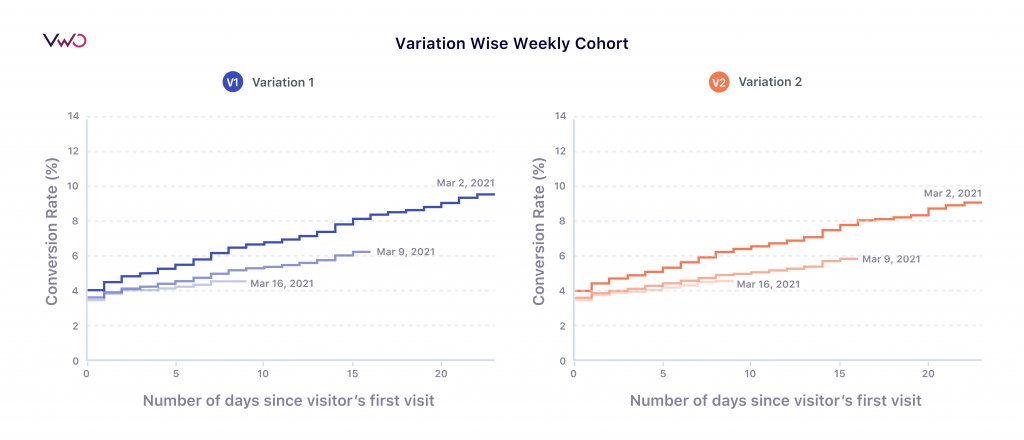
The above plot suggests that visitors of early cohorts have a higher tendency to convert than visitors in later stages. This difference could be due to some newness effect observed in the earlier cohorts that is not present in later cohorts.
A weekly cohort plot enables us to perform apple to apple comparison between the response rate of recent cohorts with old cohorts.
Why did we choose not to add this feature to VWO SmartStats reports?
Cohort analysis is a great approach to look at the accurate picture of conversion delay to conversion rate. However, to add it to our reports, it was essential for us to understand its impact on our existing customers and how useful it would be for them, considering the tests they run on VWO. We analyzed all tests that ran on our platform in a year to evaluate the impact and discovered less than 3% of campaigns that had the below characteristics:
- A median conversion time longer than a day.
- A median difference of more than a day between the conversion times of control and variation.
From the analysis of VWO data, we realized conversion delay isn’t a big issue in most tests that run on VWO. Hence, to keep our SmartStats reporting intuitive and straightforward to understand, we decided not to add this feature to our primary reporting.
We plan to continue studying the effects of conversion delay and would love to talk to customers who might be interested in this functionality. If you’re not a customer and would like to try out our product, you can take a guided free trial.
Get an overview of VWO to understand what to expect in the full-featured free trial.
If you are interested in this feature and conversion delay is a cause of concern in your conversion rate estimation, we’ll be happy to discuss your use case in detail. Please reach out to us at content@vwo.com.
Categories:


