Experimentation is an effective way to validate a decision before you implement it.
But when it comes to analyzing test results, teams often unknowingly rely on guesswork and assumptions.
“Maybe users did not notice the change.”
“The copy must have been too complex.”
“What if the hypothesis was not strong enough?”
You’ve probably seen these reactions when people are trying to figure out why a test either won or underperformed.
In a process that aims to eliminate guesswork, you unintentionally fall back on random guesses and speculation to move ahead.
This defeats the entire purpose of A/B testing while adding an extra layer of risk and vagueness to your decision-making cycle.
How and when does guesswork become a part of A/B testing?
Teams often have complete visibility over each metric, including clicks, conversions, time spent on the page, and other KPIs.
But what they don’t see is the story behind those numbers:
Hesitation before a click
Users scrolling past a key section
Confusion that leads to form abandonment
And this is where the real problem lies.
When you don’t know what factors influenced user actions, you fall back on guesswork and speculation to make sense of the test results.
This invisible gap between ‘what happened’ and ‘why it happened’ adds a layer of uncertainty to every decision that follows, making it difficult to iterate confidently.
So, how do you fix this?
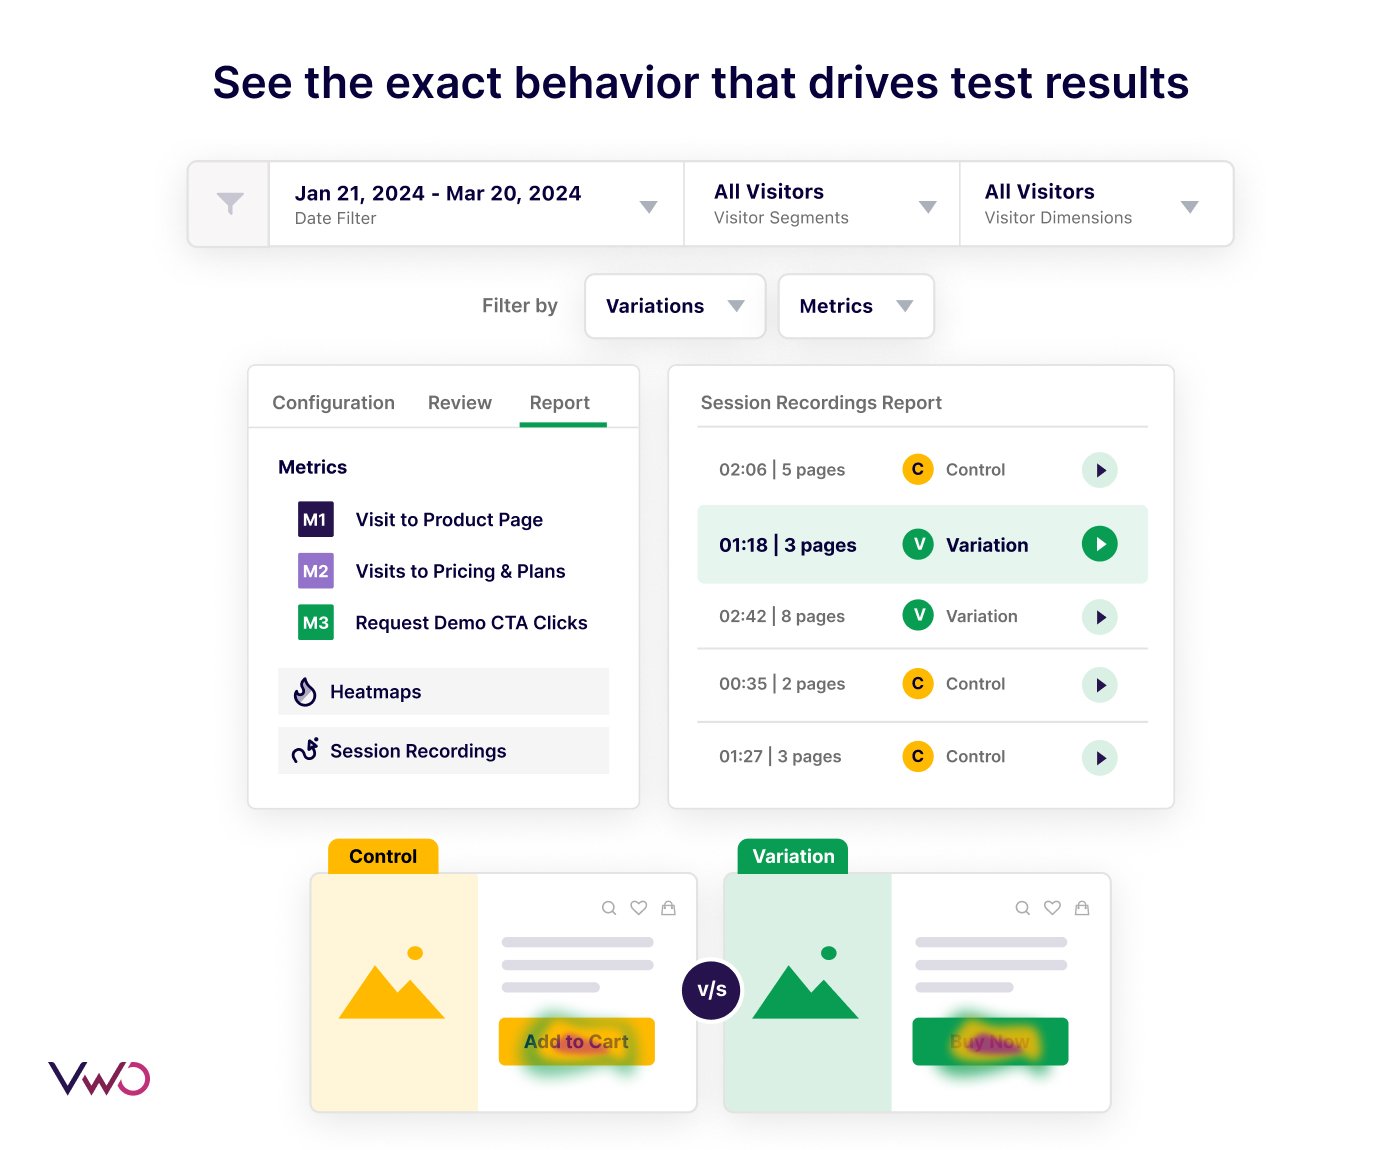
See exactly how users are interacting with your test
See exactly where users get stuck, where they click, what draws their attention, and what areas they ignore, all within a single dashboard.
We’ve integrated heatmaps and session recordings into your test reports, allowing you to instantly see the actual user behavior behind each test result.
Rather than guessing what happened in a test, you can:
Find out which elements cause confusion or hesitation.
Identify low engagement areas.
Compare user behavior on control vs. variation.
Pinpoint the exact moment when users dropped off.
Combine numbers (the ‘what’) with behavioral insights (the ‘why’) to make decisions that you truly feel confident about.
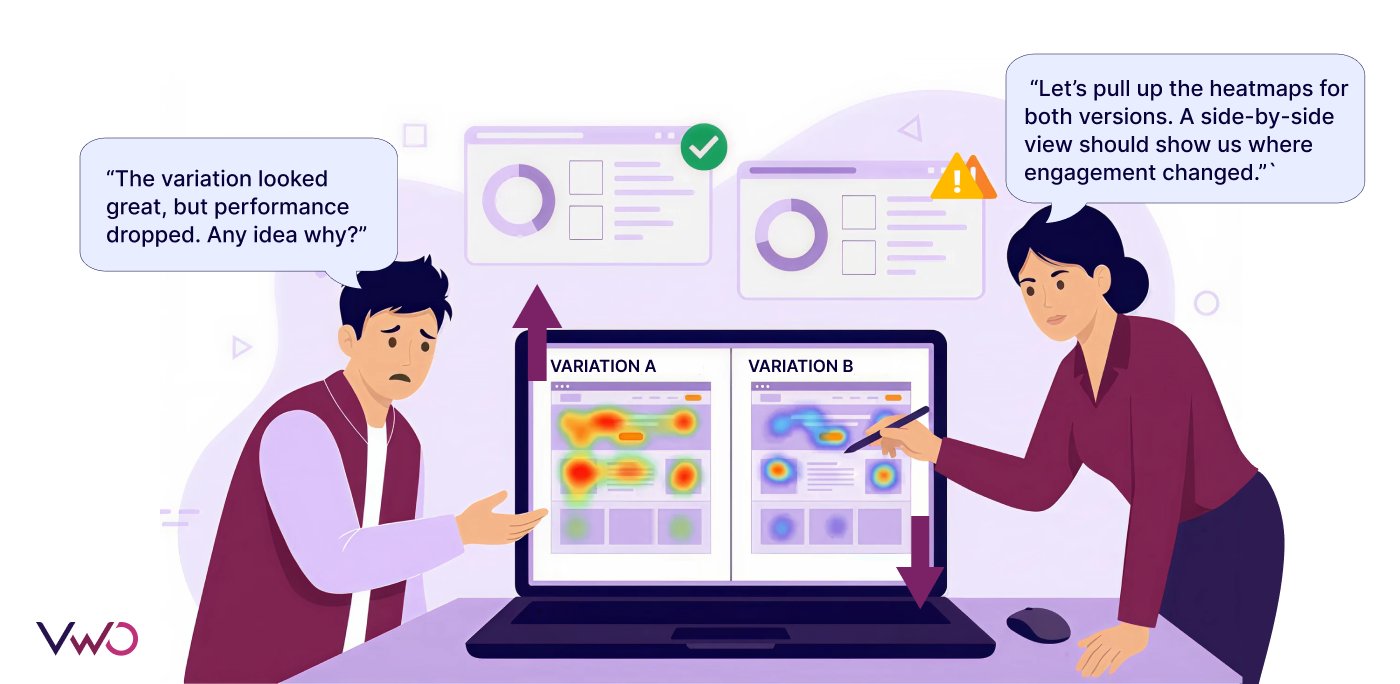
1. Compare user engagement patterns on the control vs. the variation
Not sure why your variation underperformed, even though it looked promising?
Quickly do a side-by-side heatmap comparison of the control and variation directly within your test reports.
With ‘Compare Heatmaps’, instantly see which areas have high engagement, where user attention drops, and identify specific patterns that led to conversions or drop-offs.
You can also compare the engagement patterns of users who convertedvs.those who dropped off to get a closer look at what made a user stay or leave.
Stop speculating about why a variation performed a certain way. Use the ‘Compare Heatmaps’ option within your VWO test reports to understand why it happened.
How this looks in action
Suppose you run a test for a redesigned product page based on a strong hypothesis.
However, the results indicate that the control outperformed the variation.
Upon closer analysis, you notice a slightly good engagement on the variation, but the ‘Get A Free Demo’ goal you were tracking has no uplift.
This key insight suggests that even though users engaged with the variation, they did not feel compelled enough to take an action.
When you use the Compare Heatmaps feature to view the engagement of ‘Converted vs. Non-Converted’ users on the variation, you notice clear hesitation around the new CTA.
This insight, which was earlier invisible through metrics, indicates that users are experiencing friction around a key element, giving you clarity on what to do next.
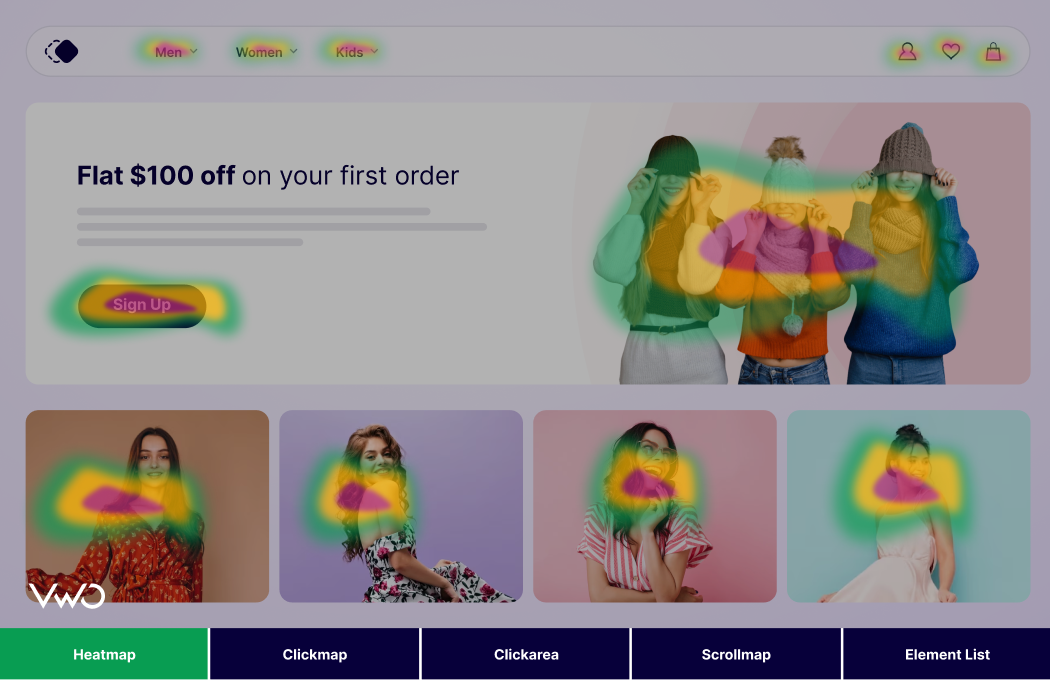
2. See every click, tap, and scroll users perform within a test
You don’t have to guess what users are doing anymore.
With a full range of heatmap views available in your VWO test reports, you can quickly spot areas where users struggle, the sections they skip, and where they click the most.
Clickmaps: Spot elements that draw the most interaction versus the ones that go unnoticed.
Scrollmaps: See whether key sections like CTAs or pricing plans are actually being seen.
Friction maps: Identify hesitation, confusion, or struggles that quietly disrupt the experience.
Zonal maps: Zoom in on specific sections, such as banners, forms, or product details, to see how users interact with each area of your page.
Rather than relying on assumptions, use VWO’s advanced heatmap suite within your test reports to identify improvement opportunities and build on what users love.
How this looks in action
Let’s say you’re testing a new layout to improve “Add to Cart” engagement on your eCommerce product page.
Results show that the control and variation have a similar conversion rate. However, the variation saw slightly better engagement.
While the results seem inconclusive at first, you turn to the advanced heatmap suite available within the reports.
The friction map of the variation shows users hesitating around the dropdown for product specs, while the scrollmap shows a steep drop just before the pricing section.
These behavioral clues indicate that users are struggling to view the product specifications and eventually lose interest before reaching the pricing section.
Armed with this context, you can now focus on simplifying the page layout and making it easier for users to find all the information they need before buying the product.
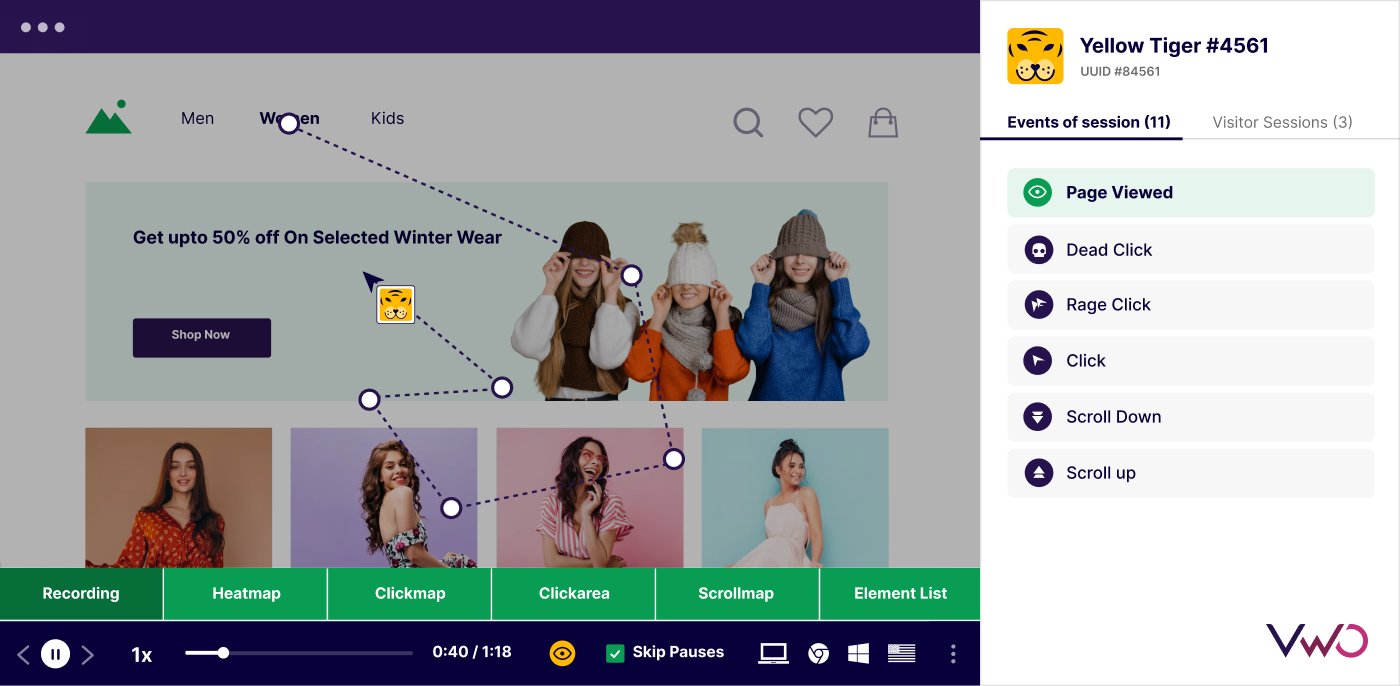
3. Watch recordings of how users actually engage with your test
See the exact actions users take, how they navigate, where they hesitate, and what eventually leads them to convert or drop off.
This gives you a whole new level of analysis and insights, where you go from watching isolated sessions to observing how user behavior changes over multiple sessions.
You might notice a visitor struggling with a form on their first visit and then returning later to complete it, or see users revisiting a product page before deciding to purchase.
No matter the scenario, you get a closer look at the human element behind each metric and understand how even small interactions can influence your A/B test results.
How this looks in action
Suppose you’re running an A/B test on your checkout flow to simplify the payment process.
While the variation introduces a new layout for faster form completion, the results show no clear winner.
When you review session recordings within the A/B test report, you notice a minor glitch on the variation where the payment field does not load properly.
Interestingly, user-level tracking shows that many of these same users return a day later, skip the affected field entirely, and complete their purchase.
These technical glitches, which mostly remain hidden behind the numbers, become visible when you combine session recordings with your quantitative results.
I believe optimization will shift back toward involving customers more directly in research and decision-making. With so much data available today, it’s easy to reduce users to metrics and dashboards, but behind every interaction is a real person. Teams need to remember that customers are more than numbers. The most meaningful insights come from understanding what users think, feel, and experience as they move through a digital journey.
4. Integrate behavioral insights into every stage of your testing cycle
Insights from user behavior can positively influence your decision-making process at every stage.
From spotting early friction to validating outcomes, visibility into user behavior helps you move faster, learn more, and reduce the uncertainty that often slows teams down.
Here’s how behavioral data from heatmaps, session recordings, and AI-powered insights can support you throughout your testing cycle:
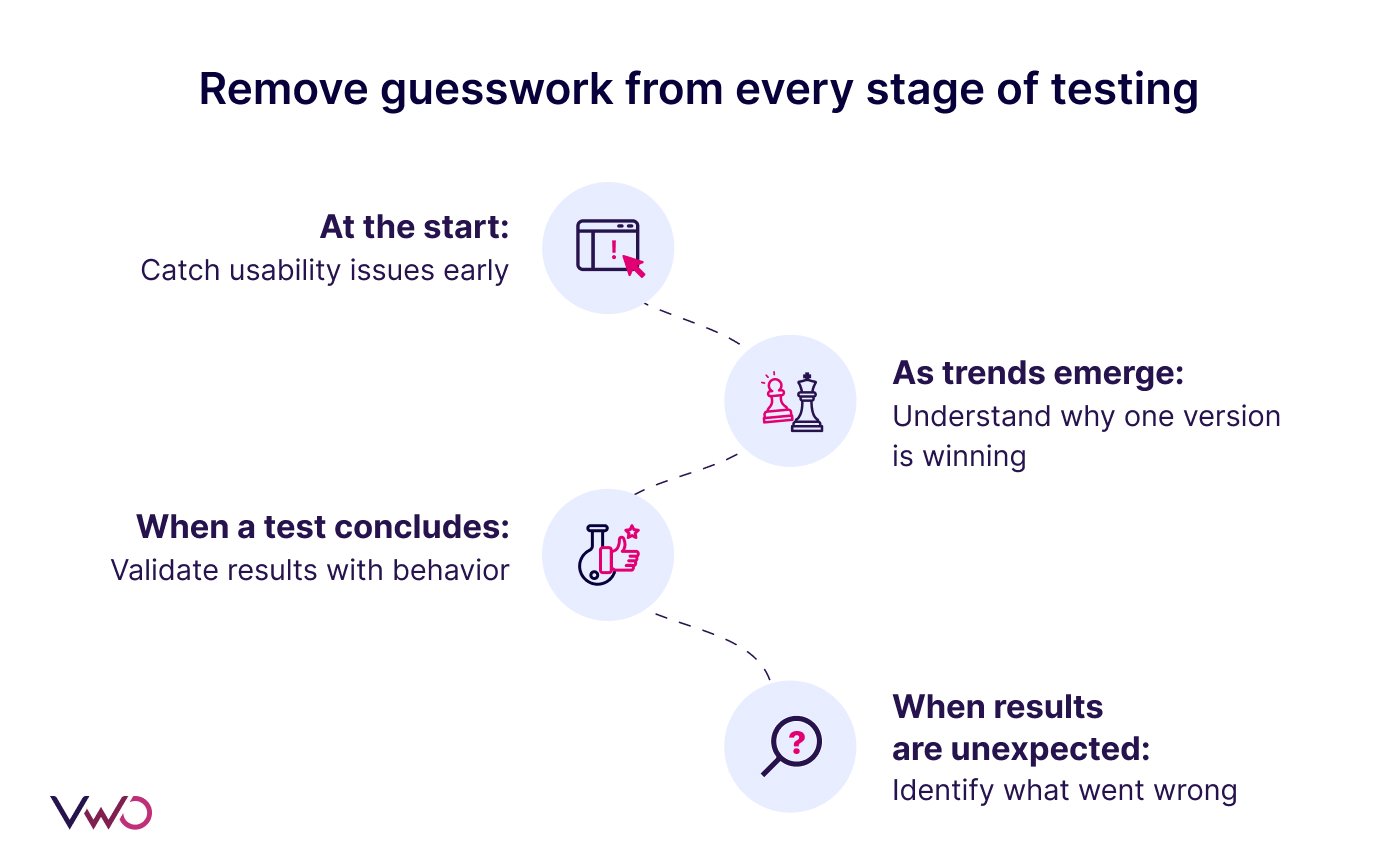
Remove Guesswork From Every Stage Of Testing
At the start: Watch how early visitors interact with your new variation to catch usability issues before they skew your results. Even a few initial recordings can reveal unexpected friction or broken elements.
As trends emerge: When the first signs of a “probability to win” appear, use heatmaps and recordings to understand why one version seems to be performing better.
When a test concludes: Go beyond the metrics to validate your findings with behavioral evidence. Confirm whether users are behaving as you expected, and spot signals that might reshape your next hypothesis.
When results are unexpected: If conversions drop or a variation underperforms, review how users interacted with the test. It will help you identify whether it was confusion, layout issues, technical friction, or something else entirely.
How this looks in action
Suppose you run an A/B test to compare a redesigned home page against the original.
As the test reaches the mid-point, the ‘Probability to Win’ metric starts favoring the variation.
Rather than waiting for the test to conclude, you use the Compare Heatmaps option to study engagement patterns and get a better understanding of what’s working well.
Here, you see that users are spending more time on the new hero banner.
Also, VWO’s AI Agent highlights that recordings for the variation show users are clicking on the primary CTA 30% faster.
These insights give you early confidence that the test is moving in the right direction and also offer strong behavioral evidence to support your next decision.
Pro Tip!
Get instant, actionable recommendations from your heatmaps with VWO Copilot. In just a click, VWO Copilot generates optimization steps and key insights based on how users engage with heatmaps. It also highlights the strengths and potential pain points of the pages, which can help guide your next steps.
Eliminate guesswork and bring clarity into your testing program
When your data gives you the ‘what’ without revealing the ‘why’, you end up debating, assuming, and making decisions based on interpretation instead of insight.
As a team, you must ensure that every decision is backed by metrics as well as behavioral context.
See how users truly experience your variations, identify the friction behind unexpected results, and find the real reasons behind every conversion or drop-off.
Request a demo with VWO to know how you can gather behavioral insights from every test result.
Hi, there! I’m an Associate Manager of Content at VWO with 6 years of experience in B2B and B2C marketing. I work across blogs, SEO, thought leadership, newsletters, landing pages, and a video podcast I built and manage from scratch. At VWO, I’ve gained expertise in CRO, experimentation, user behavior research, and personalization, creating content that makes complex ideas clear and actionable. Outside of work, I enjoy experimenting with memes and short-form video on Instagram.
Uncover hidden visitor insights to improve their website journey
One of our representatives will get in touch with you shortly.
Awesome! Your meeting is confirmed for at
Thank you, for sharing your details.
, you're all set to experience the VWO demo.
I can't wait to meet you on at
Account Executive
, thank you for sharing the details. Your dedicated VWO representative, will be in touch shortly to set up a time for this demo.
We're satisfied and glad we picked VWO. We're getting the ROI from our experiments.
Christoffer Kjellberg
CRO Manager
VWO has been so helpful in our optimization efforts. Testing opportunities are endless and it has allowed us to easily identify, set up, and run multiple tests at a time.
Elizabeth Levitan
Digital Optimization Specialist
As the project manager for our experimentation process, I love how the functionality of VWO allows us to get up and going quickly but also gives us the flexibility to be more complex with our testing.
Tara Rowe
Marketing Technology Manager
You don't need a website development background to make VWO work for you. The VWO support team is amazing
Elizabeth Romanski
Consumer Marketing & Analytics Manager


![10 Best Enterprise Analytics Platforms [2026]: Expert Picks with Reviews and Comparisons](https://static.wingify.com/gcp/uploads/sites/3/2025/08/Feature-image-10-Best-Enterprise-Analytics-Platforms_-In-Depth-Reviews-and-Comparisons.jpg?tr=h-600)