

I face this problem a lot. I never find relevant stats for research at a flash bolt speed. It takes a search phase some patience and calm fishing before the desired figures can be pulled out.
Information like statistics should be readily available. The figures and decimals are intimidating enough and then if searching for them becomes a task, one would rather skip it.
Download Free: A/B Testing Guide
Figures are important for your business (and mine). A comparative study, an emerging trend, and a success formula are all simplified into math. All complex sciences are proved and then approved by the simplicity of Math and Statistics. We love things simplified at VWO, so we bring you a compilation of all relevant eCommerce statistics.
Some of them might even surprise you!
Related Post: Consumer Insights from VWO Cart Abandonment Survey.
General eCommerce statistics on selling trends
- 40% of the world’s population has bought online. That’s a staggering figure of more than a billion people. Of course, it is still rising. (World’s population with access to internet, there are 3 billion people with internet connections worldwide.)
- There are no ‘Monday Blues’ in eCommerce. According to research Monday is the day people shop the most. (Followed by Tuesday and Wednesday.)
- The average online conversion rate for the year 2014 was 2.95%.
- Books are the best-selling commodity online (a projected 600 million in the year 2014 followed by electronics and computer goods).
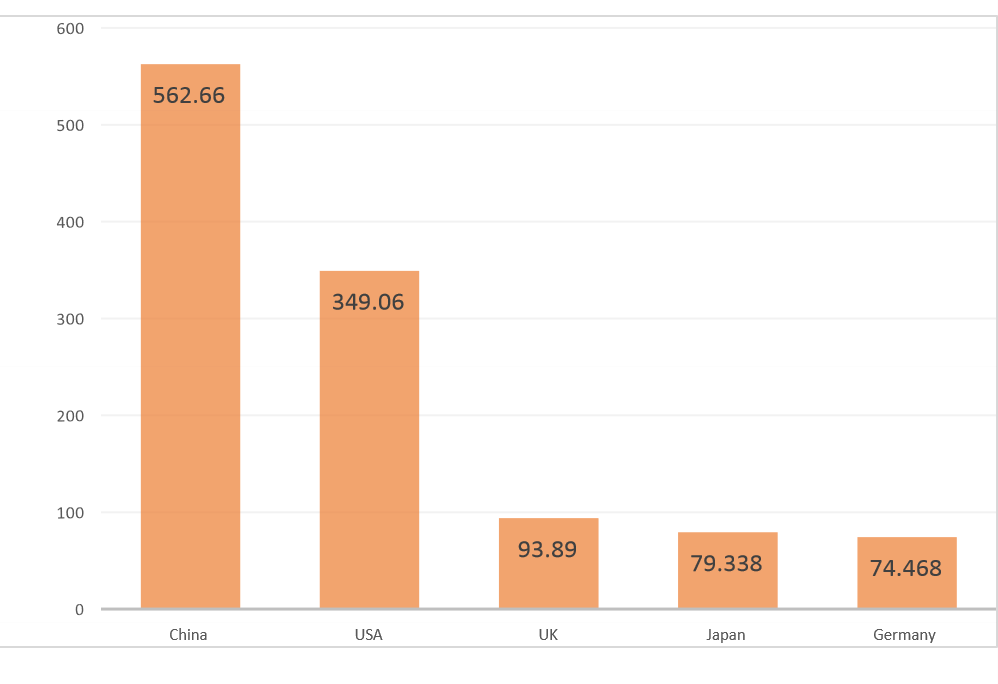
- Countries that spend the most online (Source: Remarkety) :
China ($562.66 Bn)
USA ($349.06 Bn)
UK ($93.89 Bn)
Japan ($79.338 Bn)
Germany ($74.468 Bn)
- On average, an internet user in China is 25 years old.
- 33% of sales in the UK occur after 6 pm.
- The online sale makes up 30% of the UK’s economy.
- Average order value in the united states for the fourth quarter $108.73.
- Most common form of payment in Russia is COD.
- Even though only 28% of small business are selling products online, over half (57.4%) of the US population shops online.
- This also implies that 72% of SMBs are not operating online in the US.
- The biggest emerging eCommerce market is India.
- The Millennials (18 to 34 year old age group) contribute the most to online sales, the average spending per user is $2000 (annually)! Even though they earn less than the 40 to 50 year olds.
Churn rate statistics
Churn Rate:
customers lost in a given time period/total active customers at the beginning of the period
- 43% profits come from retained customers for average eCommerce stores. The margin increases to 80% for best in class.
- Only 42% companies are able to measure CLV (Customer Lifetime Value) accurately.
Related Post: What Metric Should You Track: Average Order Value vs Conversion Rate vs Revenue Per Visitor
Customer acquisition and retention statistics in eCommerce
It isn’t surprising that a regular customer is preferred by businesses. The catch is that you have to retain one to make one. Still customer retention costs less compared to customer acquisition.
- 44% companies focus more on customer acquisition then customer retention.
- 16% focus more on retention.
- Only 40% focus equally on both.
Average acquisition cost
Here’s a little statistical insight that shows how pricey an affair acquisition is. A survey by Marketing Sherpa compared the mean acquisition costs of companies and then averaged them out in three classifications. This classification was based on if the customer acquisition cost were steady, rising or falling.
- Steady ( Mean $109)
(54% companies said that they were seeing a steady pattern in acquisition costs.)
- Rising (Mean $82)
(31% companies said that their acquisition costs were rising.)
- Falling (Mean $72)
(15% companies reported a fall in acquisition cost.)
Notice that the companies that were counted in the ‘Steady’ group, had a high customer acquisition cost as is seen from the mean figures. The 15% that observed a fall had low customer acquisition cost anyway (could be that they are already huge in terms of customer base) .
Thus, the overall trend shows that the acquisition cost is either steady (and huge) or rising for most businesses. A lesson if you are not able to retain your customers is that the new ones are not coming easy.
- Probability of selling to a new customer is 5 to 20%.
- Probability of selling to an existing customer is 50 to 70%.
It can’t get any clearer, the numbers say it all. Retaining your customers gets you profits and saves you costs.
Old brings Gold, the probability of selling to a seasoned customer is 50 to 70 percent.
eCommerce statistics on digital marketing
Customer acquisitions and retention both require a strong marketing strategy. With businesses growing online, Social Media is replacing hoardings and billboards. A lot of potential customer base is redirected to eCommerce sites through social media.
Though it is not the most effective channel of marketing to retain, read on to know more. (Source: Cleverbridge)
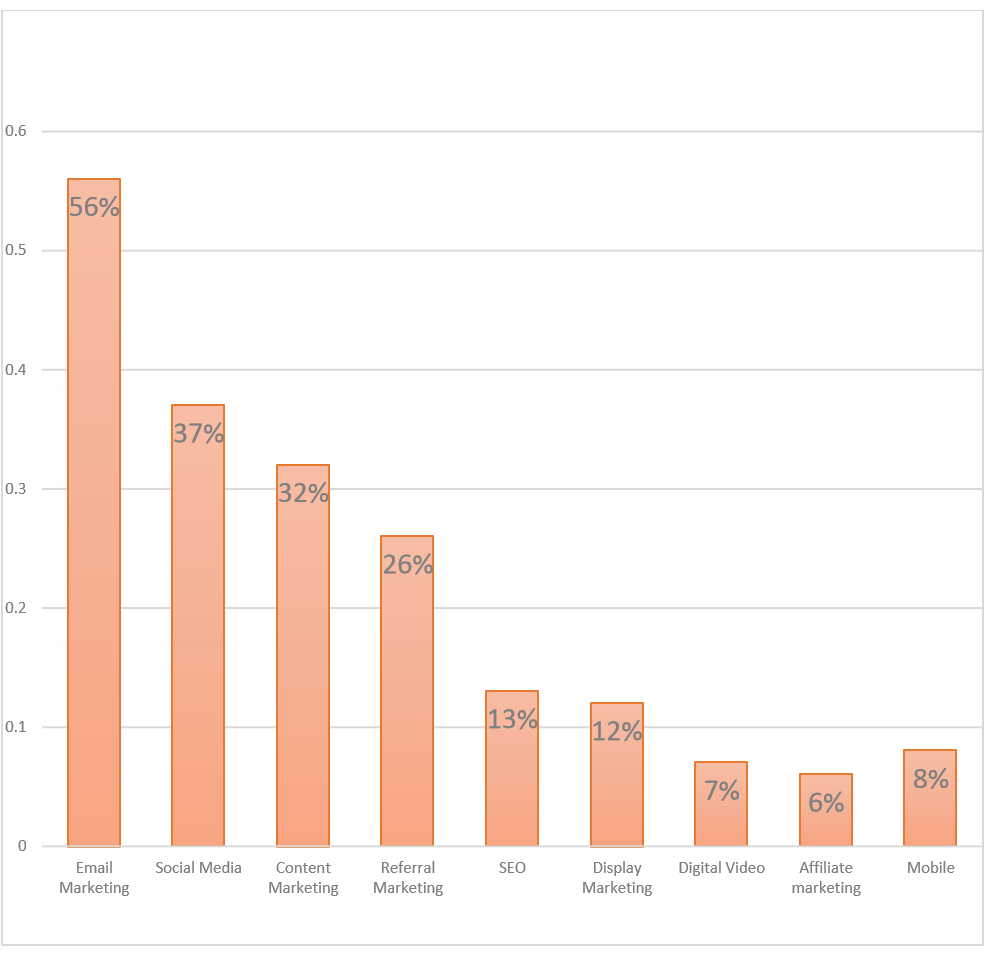
Most effective digital marketing methods for retention
- Email Marketing (56%)
- Social Media (37%)
- Content Marketing (32%)
- Referral Marketing (26%)
- SEO (13%)
- Display Marketing (12%)
- Mobile (8%)
- Digital Video (7%)
- Affiliate Marketing (6%)
- Paid Search (4%)
Most effective digital marketing tools for acquisition
- Website (89%)
- Email (81%)
- Social Media (72%)
- Direct Mail (66)
- SEO/PPC (65%)
- Web Banners (60%)
- Mobile Devices (34%)
- Aggregator Website (32%)
- Price Comparison (18%)
- 75% of consumers were willing to buy something after receiving a promotional email of some sort, in China.
- 72% Millennials are favorable to re-targeting by sites. Millennials are also the group that spend the most online.
Download Free: A/B Testing Guide
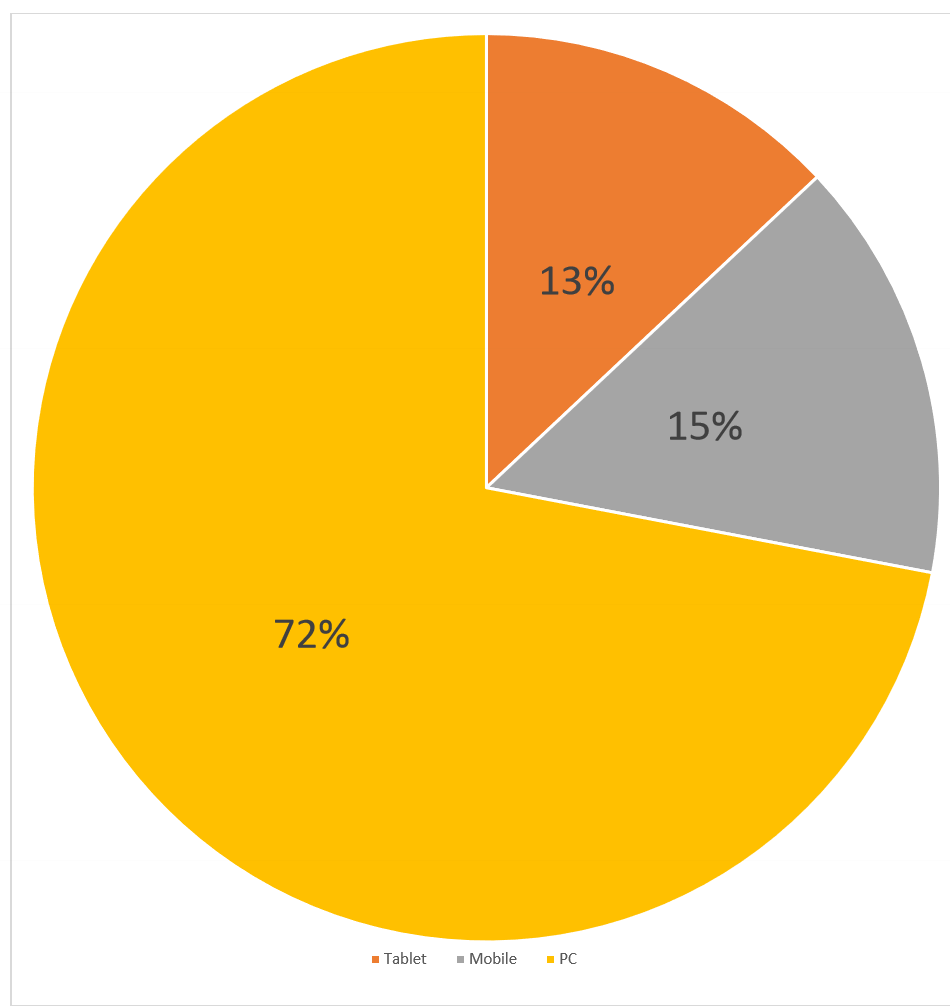
Device favored for shopping: Mobile phones
A mobile site would get you half of your traffic, though not most of your conversions. While it’s easy to browse through products on mobile phones people prefer desktops for security reasons.
Online spending by device
- PC (72%)
- Tablet (13%)
- Smartphone (15%)
- 9 million Americans have purchased, at least once, on a mobile device.
February 2015 the recorded sales on mobiles were one-third of the total for the fourth quarter of 2014.
Browsing eCommerce stores is the new window shopping. The Millennials shopping on their smartphones view it as entertainment.
Cart abandonment statistics in eCommerce
The Millennials spend the most online. They are favorable to re-targeting, they contribute the most to the online but they are most likely to abandon carts as well!
While this may sound like a paradox, it’s not. Read on to know more about why they eCommerce’s most coveted customer base.
- 69% is the measured abandonment rate for carts.
- Which age group abandons their carts the most? 18 to 34 year old. The Millennials are an impatient lot and they may be browsing about aimlessly. But high rates of cart abandonment can not be blamed on the young and the reckless alone. In fact, unexpected costs cause most of the cart and buyer fallouts.
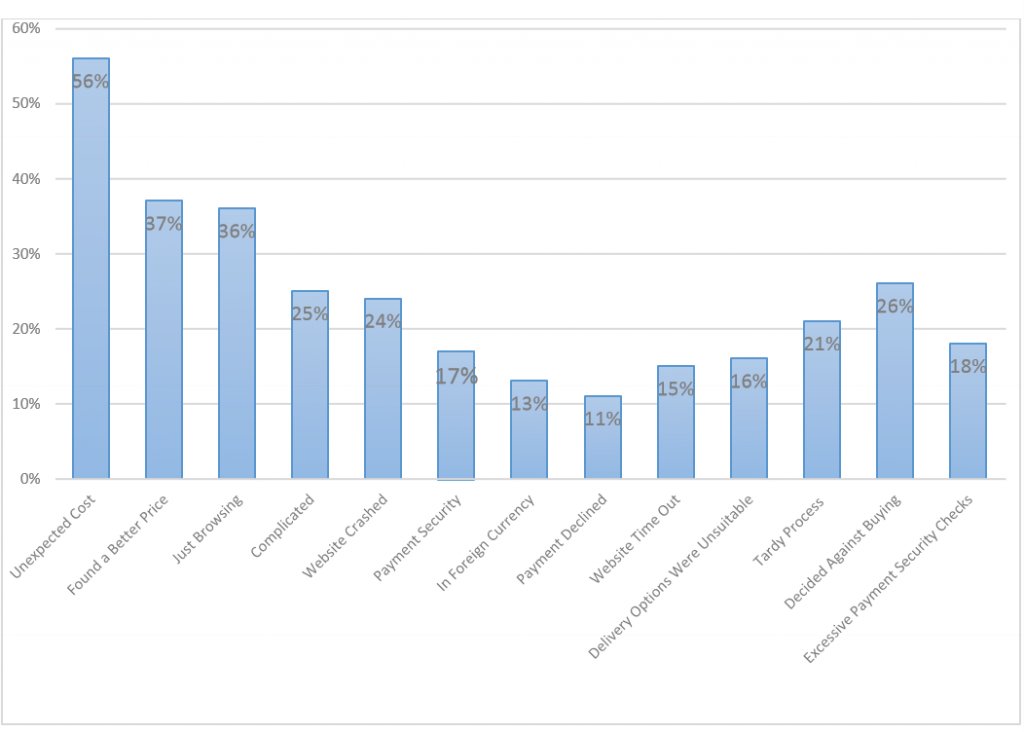
Reasons for cart abandonment
- Presented with unexpected cost (56%)
- Found a better price (37%)
- Just browsing (36%)
- Website navigation too complicated (25%)
- Website crashed (24%)
- Concerned about payment security (17%)
- Payment mentioned in foreign currency (13%)
- My payment was declined (11%)
- Website Time out (15%)
- Delivery options were unsuitable (16%)
- Process was taking too long (21%)
- Decided against buying (26%)
- Excessive payment security checks (18%)
![]() 72% of Millenials who were offered discounts claim abandoned carts. Re-target with discounts to them.
72% of Millenials who were offered discounts claim abandoned carts. Re-target with discounts to them.
Social media trends and eCommerce
We mentioned before that social media is what makes up for the huge hoardings and billboards in the age of digital marketing. If you thought that personalized marketing and emails were enough then you need to go through the shock and awe that these numbers will throw at you.
- In 2014 eCommerce orders coming from social media grew a staggering 202%.
- Facebook also makes 72% of the ID logins in eCommerce. (Year 2014).
- Facebook also has the highest Conversion rate 1.85% of the overall traffic.
Others compare as shown below: - Vimeo (1.16%)
- Youtube (0.16%)
- Instagram (0.08%)
- Pinterest (0.54%)
- Twitter (0.77%)
- LinkedIn (0.47%)
- Reddit increased traffic to eCommerce by 152% from 2012 to 2013.
- 84% people see reviews of the product on social media before purchase.
Facebook Dominates the Following Industries in Terms of Traffic Acquisition
- Photography (98%)
- Sports and Recreation (94%)
- Pet Supplies (94%)
- Drop/Shipping (93%)
- Jewelry and Watches (92%)
- Clothing and Apparel (87%)
- Food and Beverage (86%)
- Home and Garden (83%)
- Web Design (81%)
- Health and Beauty (81%)
- Movies and Music (80%)
Payment methods popular with eCommerce customers
Once your user has clicked the magic button that says ‘Buy Now’ here are the options you should be adding to the payment methods. The check-out page is critical to your conversions, not adding choices could mean losing out on buyers. Here’s a priority order to add options
- Debit Cards (43%)
- Credit Cards (35%)
- PayPal (other online eWallets ) (3%)
- Charge card (2%)
- Check (5%)
- Gift cards (pre-paid) (1%)
- Store credit cards (9%)
eCommerce statistics on customer reviews
Your customers matter the most to your business. Their opinion matters the most to your potential customers. If you get positive reviews from your buyers or if you are recommended further by existing users, it does wonders for your reputation.
You may want to upscale your customer service. It’s no longer about addressing customer woes.
It’s about making customers go wow.
A couple of recommendations would be more effective than marketing campaigns that are known to blow their own trumpet.
Here are the figures backing that hypothesis :
- 90% consumers read reviews.
- 85% consumers read more than 10 reviews.
- 72% consumers trust a local business more if the reviews are positive.
- Consumers are 2 times more likely to share bad customer reviews than good ones.
- A typical business hears from 4% of its dissatisfied customers.
- It takes 12 positive experiences to nullify one negative experience.
- Anything between one in three negative reviews online deters shoppers.
- For every complaint 26 customers have remained silent.
- 45% of consumers will abandon an online transaction if questions or concerns are not addressed.
- 89% customers have stopped doing business with companies after experiencing bad customer service.
- 68% of customers that left these negative reviews got an adequate response.
- 18% of these people became loyal customers as a result.
- 33% turned around and posted a positive review, and 34% deleted the original negative
review.
It’s no longer about addressing the woes. It’s about making customers go WOW!
Related Post: Customer Review Widget Increases Conversion by 58.29% for eCommerce Website.
It’s easier to spot trends and test them as a thesis when you have the data to back you.
Now that you are equipped..go conquer!
Categories:


